Ionized Gas Kinematics at High Resolution IV: Star Formation and a Rotating Core in the Medusa (NGC 4194)
Abstract
NGC 4194 is a post-merger starburst known as The Medusa for its striking tidal features. We present here a detailed study of the structure and kinematics of ionized gas in the central 0.65 kpc of the Medusa. The data include radio continuum maps with resolution up to (35 pc) and a m [NeII] data cube with spectral resolution km s-1: the first high resolution, extinction-free observations of this remarkable object. The ionized gas has the kinematic signature of a core in solid-body rotation. The starburst has formed a complex of bright compact H ii regions, probably excited by deeply embedded super star clusters, but none of these sources is a convincing candidate for a galactic nucleus. The nuclei of the merger partners that created the Medusa have not yet been identified.
1 Introduction
The most luminous starbursts appear to be caused by major mergers of galaxies (Sanders et al., 1988, e.g.,) and are rare because major mergers are infrequent. Minor mergers create LIRGS; slightly less luminous but much more common, and important to galaxy evolution due to their sheer numbers (Kartaltepe et al., 2010). Minor mergers, like major mergers, appear to instigate intense star formation in compact regions and create concentrated sources. But minor mergers evolve differently from major mergers, so the characteristics of star formation are likely to be different. How does star formation develop in a minor merger? How will these starbursts evolve and how do they affect their surroundings as they contribute to the newly formed galaxy? To answer those questions we need to understand the structure and kinematics of the gas ionized by the embedded stars with the highest possible spectral and spatial resolution. We consider here the case of NGC 4194, “The Medusa”, a galaxy with distorted morphology and luminous star formation that appears to be the result of an unequal merger between an elliptical and a smaller spiral.
This is the fourth paper in a series on high resolution spectroscopy of intense extragalactic star formation sources in the middle infrared (Beck et al., 2010, 2012, 2013). We use mid-infrared lines of metal ions to trace the kinematics and spatial distribution of ionized gas in Galactic H ii regions and in starburst galaxies (Achtermann & Lacy, 1995; Zhu et al., 2008; Beck et al., 2013) because they are little affected by extinction and permit us to attain true spectral resolution, including thermal effects, much higher than is possible with any hydrogen line. The ’Medusa galaxy’, NGC 4194 (a.k.a. Arp 160 and Mkn 201) is a starburst galaxy at 39 Mpc distance (1″= 190 pc) with striking tidal features; it has been variously classed as Magellenic, Sm(pec) and BCG. The central kpc of NGC 4194 is a powerful infrared source with 60 m/100 m, typical of starburst heating. Spitzer IRS spectra (from the Heritage Archive) show a spectrum typical of a starburst-dominated galaxy, with little if any contribution from an AGN. NGC 4194 is believed to be a merger remnant, with the favoured history being a small gas-rich spiral falling into an elliptical four times it mass (Manthey et al., 2008). The central region of NGC 4194 is the site of intense star formation: Weistrop et al. (2004) and Hancock et al. (2006) find numerous bright optical and UV knots that they identify as very young globular cluster precursors. But the structure of this central starburst has not been probed. The observations are either too low in spatial resolution (e.g. the 2Mass survey) or too affected by the deep extinction (Hattori et al., 2004) to determine the structure. Beswick et al. (2005) mapped the center of NGC 4194 at 21 cm with sub-arcsecond resolution and found two compact sources separated by only 0.35″ , which they identify with the galactic nucleus, and which Manthey et al. (2008) appear to tentatively accept as the nuclei of the progenitor galaxies, but the nature of these source and their relation to the merger history have not been explored.
We report here on radio continuum maps of NGC 4194 with sub-arcsecond spatial resolution and on spectra of the 12.8 m emission line of [NeII] with velocity resolution better than 5 km s-1. The radio maps are at short cm wavelengths, which are sensitive to both the thermal emission of H ii regions and the non-thermal emission of SNR. The fine-structure line of at 12.8 m is usually one of the strongest mid-infrared emission lines in H ii regions and is a preferred kinematic probe because of its low susceptibility to thermal broadening; in a H ii region the FWHM from thermal effects will be km s-1 compared to km s-1 for .
2 Observations
2.1 TEXES [NeII] Data Cube
NGC 4194 was observed at the NASA Infrared Telescope Facility on Mauna Kea, Hawaii, on the night of 2 February 2013, with the TEXES spectrometer (Lacy et al., 2002). TEXES on the IRTF has a seeing and diffraction-limited beam of . The observations were taken in the high-resolution mode, with a plate scale per pixel and spectral resolution km s-1. Ceres was the telluric comparision source and the wavelength scale was set from atmospheric lines. The slit was 29-pixel long and wide; it was set North-South and scanned across the galaxy in R.A. steps of to generate data cubes with Nyquist spatial sampling. The total observation time was 2.23 hours.
2.2 Radio Maps
NGC 4194 was observed at the NRAO Very Large Array (VLA)111The National Radio Astronomy Observatory is a facility of the National Science Foundation operated under cooperative agreement by Associated Universities, Inc. in program AN095. A array observations at 6 and 3.6 cm (C and X bands) were obtained on 17 November 2000 and B array observations at X band on 19 March 2001. The data were calibrated and reduced with AIPS. Maps were produced with varied weightings and beam sizes; the observing and reduction parameters are given in Table 1.
2.3 Archival Data
2.3.1 Radio
We obtained archival data in the radio and infrared regimes from the VLA and from Spitzer. NGC 4194 was observed at 2 cm (U band) in the A array for program AE47 and at 6 cm with the B array in program AS286. Note that the resolution of these B array observations is on the order of the diffraction-limited TEXES beam. The parameters of these maps are given in Table 1.
2.3.2 Infrared Spectra
NGC 4194 was observed by Spitzer as part of the IRS Standard Spectra program and the results are in the Spitzer Heritage Archive. It is dominated by the low-excitation lines of [NeII] and [SIII] m. All the lines appearing in the m SH and m LH modules are in the ratios expected of a starburst galaxy (Sturm et al., 2002); there is no spectral signature of an AGN.
3 H ii Regions in the Central Kpc of NGC 4194
3.1 Radio Continuum
Optical and UV observations of NGC 4194 have detected multiple star-forming knots near the nucleus (Weistrop et al., 2004; Hancock et al., 2006), but because of heavy dust obscuration these observations did not penetrate the nucleus itself. Published infrared and radio observations are either of low resolution or at a wavelength not sensitive to the thermal emission of young starforming regions. The radio observations we report here are the first high-resolution, obscuration-free images of star formation activity in the nucleus of NGC 4194. We first discuss the spatial distribution and structure of the nucleus, and then the nature of the radio sources.
3.1.1 Spatial Distribution of Radio Emission
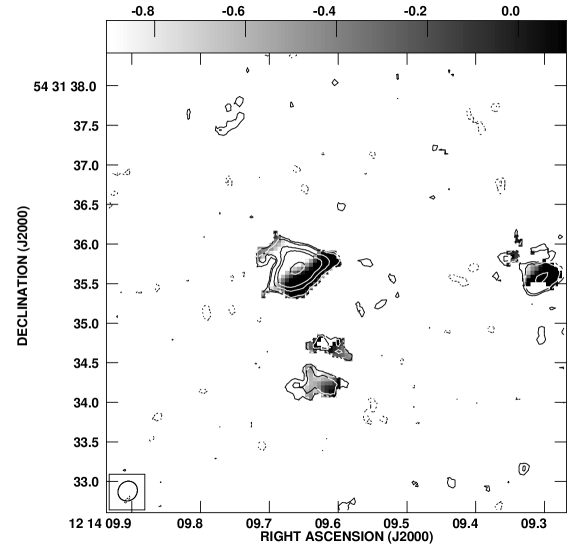
Maps of NGC 4194 at 6 and 3.6 cm are shown in Figure 1, and a 2 cm map, converted from the B1950 to J2000 system, is in Figure 2. This is the first complete and extinction-free high resolution view of ionized gas structure near the nucleus in NGC 4194. The radio continuum in the central of NGC 4194 has a complex structure which our highest resolution maps barely resolve. The central source222This source has been identified with the galactic nucleus in earlier radio maps, and this has been assumed by other authors: Kaaret & Alonso-Herrero (2008), for example, attribute the X-ray source they find near here to the ’nucleus’. However kinematic and other considerations, discussed in section 4.3, cast doubt on that identification, and it will be called ‘the central source’ in this paper at , appears elongated SE-NW at the lower resolutions. In the highest resolution 3.6 cm maps it breaks up into 3 sources in a line at p.a.. Another distinct source lies west of the center. South of the center is a region in length, with 3 distinct sources in a background of extended clumpy emission. These 7 distinct sources were fit with single gaussians and their sizes, positions and fluxes are in Table 2. We discuss the nature of these sources in the next section. .
In addition to the compact sources there is extended emission over a region. Figure 3 shows a naturally-weighted 3.6 cm image plotted so as to emphasize the lower level emission. It is clearly not axisymmetric. Weak emission connects the central and western radio source with what Beswick et al. (2005) described as an ‘arm-like feature’, and the southern and central source are immersed in what could be a nuclear spiral, a nuclear bar, or part of a starforming ring or disk. Non-axisymmetric structure has been seen in NGC 4194 and interpreted as a bar (Jog & Maybhate, 2006), but that was at much larger (kpc) radii and does not seem related to the nuclear emission. These structures are discussed in 4.
3.1.2 Thermal Emission and the Spectral Index
The radio continuum of starburst galaxies combines non-thermal emission from synchrotron sources created in previous generations of stars with thermal free-free emission generated in young H ii regions tracing the current episode of star formation (Condon, 1992; Turner & Ho, 1994). Non-thermal processes typically dominate the longest wavelengths (20 cm and longer) and thermal free-free the shorter 2 cm and mm bands. The radio spectrum can be characterized by the spectral index , such that : for pure thermal free-free emission from H ii regions, , for optically thick emission and can be as great as . For non-thermal synchrotron emission is steeper, i.e. more negative, than the thermal value. Non-thermal emission of starburst galaxies is observed to have in the range and between 21 and 2 cm. The integrated 21 cm flux of Condon et al. (1990) and the single dish 6 cm result of Becker et al. (1991) give the spectral index of NGC 4194 as between 21 and 6 cm.
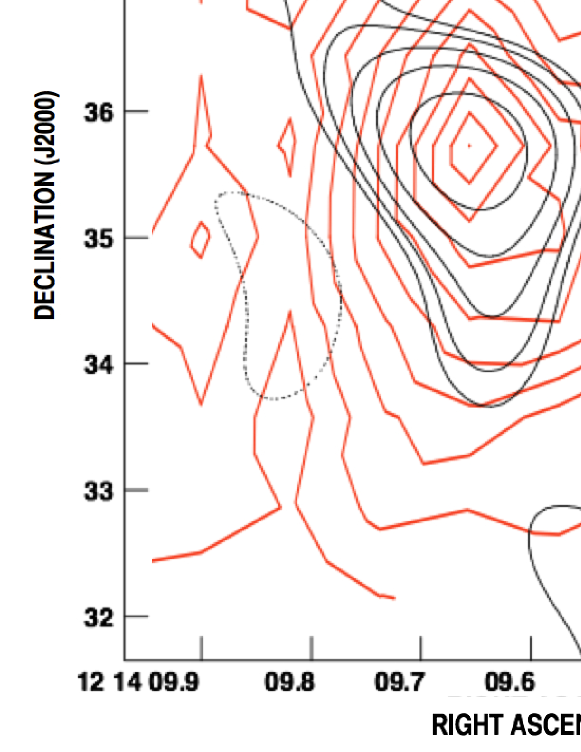
The archival 2 cm observations offer a wider baseline view of the spectral index. We created a 2 cm image with the same beam size as the 6 cm and took the spectral index between 6 and 2 cm, which is shown in Figure 4 along with the 2 cm map contours. The 6 to 2 cm spectral index shows that the central and southern sources have substantial non-thermal emission and the western is purely thermal. In fact, the spectrum of the western source may actually be rising at 2 cm, consistent with a thermal source of such high emission measure as to be partly optically thick at 6 cm.
The radio continuum at 6 and 3.6 cm is a mixture of thermal free-free emission and non-thermal synchrotron emission, but the 2 cm map is mostly thermal. This is shown by comparing the fluxes to those at 2.7 mm, where the non-thermal emission is insignificant and dust emission is negligible. Aalto et al. (2010) measured mJy total flux at 2.7 mm over this entire region. With this predicts total thermal fluxes mJy at 2 cm and mJy at 6 cm. So 88% of the total 2 cm flux is thermal (but only 15% of the total 6 cm.) The 2 cm emission in Figure 2 is thus an excellent high-resolution representation of the extinction-free star formation traced by the free-free emission.
The Lyman continuum rate to maintain this thermal flux is estimated from the prescription of Ho, Beck & Turner (1990) and the 3mm flux to be for the three main star-forming regions of the central 10″ . This corresponds to , and a star formation rate of 10 for a Kroupa 3 Myr starburst based on STARBURST99.
The non-thermal emission in the compact sources of NGC 4194 is probably from recent supernovae. There must have been considerable supernova activity in the recent past: the 3.3 mJy of 3.6 cm emission which we calculate to be non-thermal requires 450 objects like CasA. Beswick et al. (2005) found that at 21 cm, where the non-thermal component dominates, the emission appears with a MERLIN beam of ″ to be a very compact double source. The two components have 12.6 and 5.1 mJy and their positions and separation are consistent with Central Sources 1 and 3 in our 6 and 3.6 maps. There is also a weak 21 cm source north of the midpoint of the double source with peak flux density 0.7mJy/bm; it has no 3.6 cm counterpart. We cannot, with our present data, map the spectral index with sufficient spatial resolution to locate the non-thermal sources precisely. The 6 to 2 cm spectral index hints that the emission is more strongly non-thermal on the northern side of the central source, perhaps related to the weak third source in the 21 cm map, but that is not conclusive: the 2 cm data were observed in a different epoch than the 6 cm and the precessesion may not be perfectly accurate. We conclude that thermal and non-thermal emission are mixed in the central and southern sources of NGC 4194 at wavelengths 3.6 cm and longer.
The purely thermal index of the small western source argues that it is a young H ii region that has not yet produced a significant number of supernovae. From the radio flux we deduce that the Lyman continuum flux in that source is , equivalent to O7V stars and a star formation rate of . If this is one star cluster it is one of the largest super star clusters yet seen; it is much brighter than the central source in NGC 5253 and almost as strong as the SW radio source in NGC 4102 (Beck et al., 2010) and the brightest source in M82 (Tsai et al., 2009). The extended nature of the western source argues that it is probably more than one cluster, however.
In summary, the three main radio sources are intense regions of star formation, but at different evolutionary stages. The central and southern source are old enough that many of their stars have gone supernova. The presence of an X-ray source (presumably an X-ray binary) near the central radio source (Kaaret & Alonso-Herrero, 2008) is another sign of stars in very late stages of evolution. The western source, in contrast, is too young to have formed a significant number of supernovae.
3.2 [NeII] Spatial Structure Agrees with the Radio
The spatial distribution of the [NeII] emission is found from the data cube by collapsing the cube along the velocity axis. The resulting map is shown in Figure 5, superimposed on a radio map convolved to the same beam size. In the [NeII] map the western source is a discrete peak, while the southern source is a plateau extending the central source; the radio continuum at the same spatial resolution looks very similar. [NeII] is a star formation tracer showing the presence of young H ii regions, so its distribution here argues that all the nuclear sources, including those with non-thermal radio spectra, host some recent star formation.
The total flux of [NeII] summed over the line extent and the region mapped is , with absolute uncertainty The IRS on Spitzer had two pointings of the SH module on this position and measured and Jy, which is . There are considerable systemic uncertainties in converting Jy to flux for an unresolved line and in comparing observations of such different resolution as TEXES and IRS; we can say only that the results are consistent with TEXES having recovered the entire Spitzer flux.
3.2.1 Abundance
The strength of the [NeII] line and of the thermal radio continuum are related because both depend on the emission measure If the neon abundance has the solar value of by number, and is all in (an overestimate, since Spitzer detected [NeIII]), the collision strengths of Osterbrock & Ferland (2006) give . This predicts a total 5 GHz flux of 8 mJy for NGC 4194, compared to the 6 mJy deduced above for thermal radio emission. The sizable uncertainty in our absolute flux calibration permits us to say only that the flux is consistent with a solar or somewhat higher abundance, and even marginally consistent with the slightly less than solar metallicity cited by O’Halloran et al. (2006).
3.3 Ionized Gas does not Coincide with the Molecular Gas
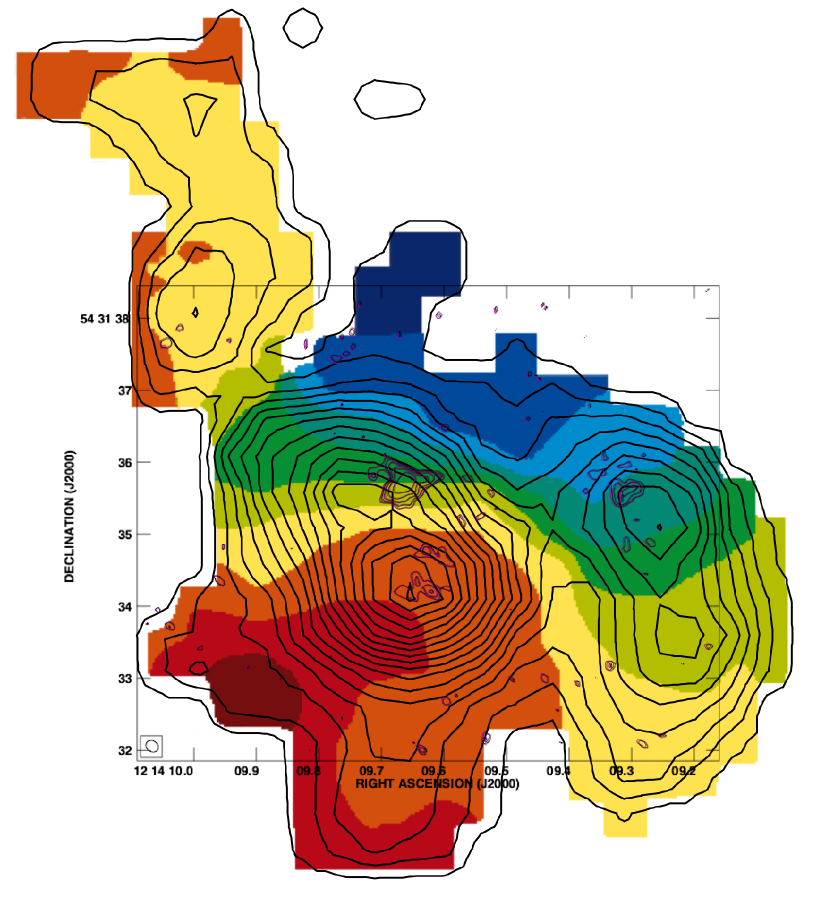
Aalto & Huttemeister (2000) used the OVRO interferometer to map the emission in the center of NGC 4194 with beam sizes 1.7″–2.5″ and velocity resolution of 20 km s-1. They found that in the region mapped in radio and [NeII] the molecular gas comprises 5 distinct peaks and an extended component. We precessed their figures to the J2000 system used in the radio continuum observations and show the 2 cm map overlaid on the CO in Figure 6. Since both the radio and CO maps are interferometer maps, the uncertainty in registration should be negligible. It is clear from the figure that the spatial distribution of molecular gas differs materially from the ionized. First, the brightest radio and [NeII] source is not perfectly coincident with any of the 5 CO peaks, but sits on the north-west side of CO peak B. The offset is , much larger than the 0.1″ conservatively estimated for the possible error in the precession. Second, the southern clump of radio sources agrees in position with the molecular peak A, but not in relative intensity: the radio and [NeII] flux on peak A is much weaker than on peak B, which has the brightest radio emission. The CO/2 cm ratio on A is higher than on B by at least a factor of 5. Third, there is no ionized gas detected on peak D even though it is almost (80%) as strong in CO as peak C, which is coincident with the western radio source; the CO/2 cm ratio in D must be at least 10 times higher than in C.
We see that the greatest concentration of molecular mass is neither the radio peak nor the geometrical center of the starburst activity, and that star formation activity is concentrated on one side of the molecular gas distribution. In other words, the ionized gas does not trace the mass distribution on scales of 0.5″ or 80–100 pc. The mass of young stars in the H ii regions is not significant on these scales: the total stellar mass in the clusters is less than a few times , a small fraction of the total molecular mass of and of the in each cloud.
This raises a new question: where and what is the galactic nucleus?. We cannot assume that the nucleus is identical with one of the radio peaks–not even the central source. We return to this in the Conclusions.
4 Kinematics
The kinematics of molecular gas in NGC 4194 were studied by Aalto & Huttemeister (2000), who observed CO emission with a ″ beam and 20 km s-1 spectral resolution, and by Aalto et al. (2010) who measured 13CO with a beam. The atomic gas was observed by Beswick et al. (2005), who had 21 km s-1 resolution. The velocity field in NGC 4194 is extremely complex, reflecting the merger that created the galaxy. Aalto & Huttemeister (2000) and Beswick et al. (2005) agree that in the inner (3.5″) there is a shallow N-S velocity gradient of km s-1per arcsecond, consistent with rotation, that there are significant non-circular motions at larger distances, and that the nuclear region contains some velocity components not due to rotation.
4.1 Kinematics of Ionized Gas: [NeII] Distribution
The TEXES observations are the first to measure ionized gas kinematics in NGC 4194. The spatial distribution of the emission is shown as a 2-D grid of spectra in Figure 7a. The [NeII] emission in the central ″ covers the velocity range km s-1. This is close to the full range over which Beswick et al. (2005) see HI absorption in the central ″. The overall distribution of the peak velocities also agrees roughly with the HI result: the highest velocities observed are around km s-1 and are in the southern extension, the lowest are around km s-1 and are at the north end of the source , and the north west is at intermediate velocities of km s-1.
Besides the similarities there are substantial differences between the ionized gas kinematics, as shown on the spectral grid, and the atomic and molecular findings. While is the commonest ionization state of neon in a high-metal star formation region like NGC 4194 and is probably widely distributed in the galaxy, the [NeII] line is collisionally excited and is most readily seen in H ii regions of moderate to high density (i.e., ). So the [NeII] is concentrated in the compact and intense radio sources to which the high resolution radio maps are sensitive. The spatially isolated km s-1 feature may be straightforwardly associated with the western thermal source. We assign the km s-1 feature to the nuclear source and the km s-1 to the southern emission complex. The spatial resolution is not high enough to separate the central and southern source completely and they overlap in some positions, creating very complex line profiles (as for example, in Figure 7b).
4.2 [NeII] Line Profiles
What can the [NeII] spectra tell us about the ionized gas motion in this galaxy? The profile of a fine-structure emission line can be formed and influenced by thermal velocity dispersion, gravitational turbulence in a virialized system (such as a bound nebula), and non-turbulent bulk motions. The obvious bulk motion in NGC 4194 is rotation creating a velocity gradient. Does this contribute to the line profiles, or can we treat the sources as kinematically isolated? We explored this question by creating data cubes from the spatial structure of the radio maps and a given velocity gradient. For a reasonable gradient like the km s-1 arcsec-1 of the CO, the gradient does not affect the line widths of the individual sources. The sources are simply too small to include a significant range of the gradient velocities. This justifies analysing the line profiles in terms of internal, rather than large-scale galactic, motions.
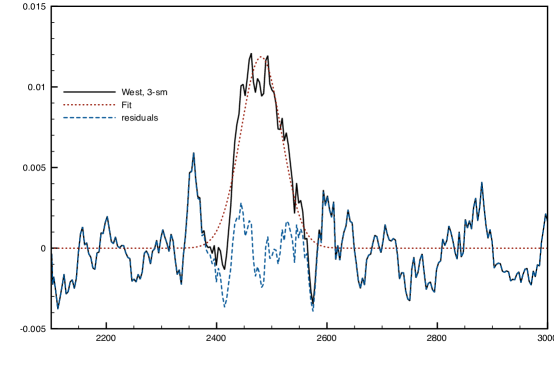
Thermal velocity dispersion is not an important factor in these line profiles; because of the high mass of neon an H ii region with has FWHM from thermal effects of only km s-1 . The FWHM increases only as the square root of . Gravitational turbulence in a virialized system will create a gaussian line whose FWHM can be found from where is the radius of the system. But since we do not resolve the individual emitting regions in the [NeII] sources we do not know . Further, the radio maps show that the central and southern [NeII] source each include several distinct radio sources, presumably super star clusters, whose sum creates the observed lines. So while the gravitational turbulence is probably responsible for most of the width of the line profile, it cannot be satisfactorily calculated from these data for the southern and central sources. For the spatially isolated and apparently simple western source, we show the line summed over a pixel box in Figure 8 along with the best single gaussian fit. The FWHM is 104 km s-1 and line center is km s-1 ; is 1.03 and the residuals do not show structure. The virial velocity relation formally gives , while the total stellar mass estimated from the and a Kroupa IMF extending to is only . The source is unresolved with the 0.18″() beam of the highest resolution radio map. It is likely that even this apparently simple source contains multiple clusters at offset velocities, which make the line appear wider than the true turbulent FWHM. Line profiles in the central and southern sources have FWHM from km s-1 , which formally gives of , but since these sources clearly (from the radio maps) contain multiple sub-sources both the FWHM and the mass concentrations are only upper limits.
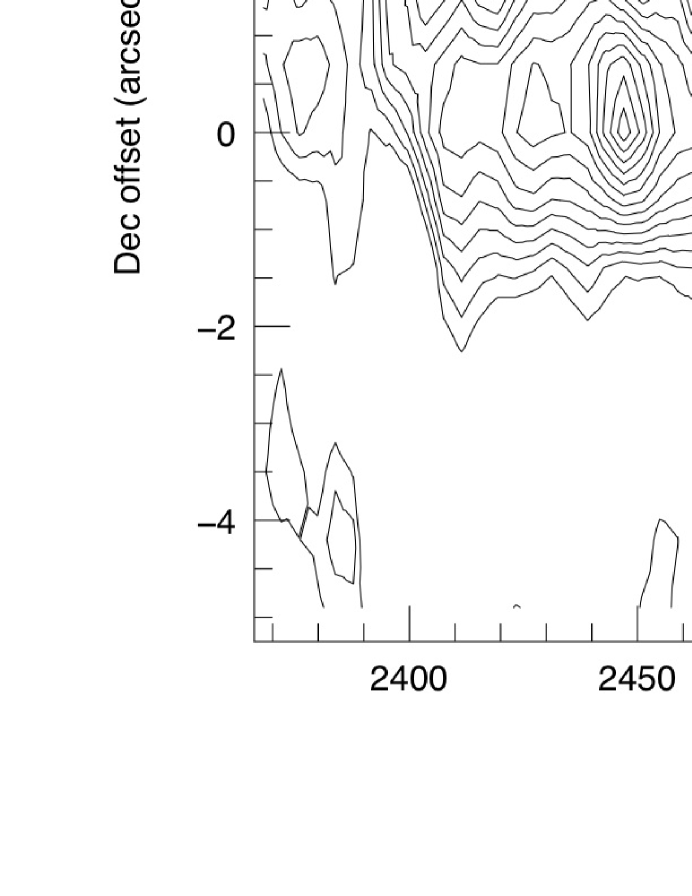
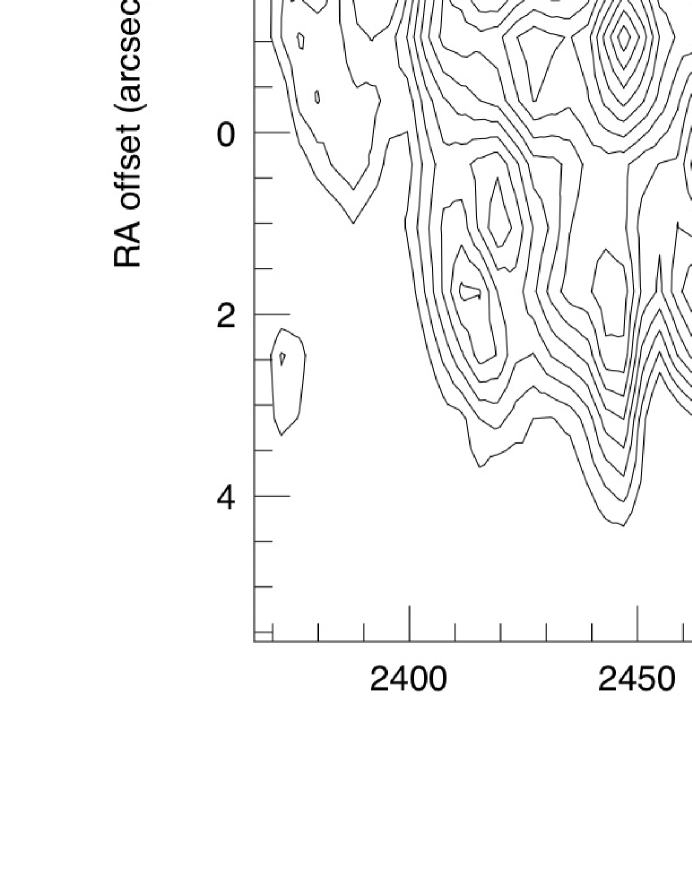
4.3 [NeII] Kinematics on Large Scales: Position-Velocity Diagrams
To examine what [NeII] can tell us about the large scale kinematics of the nuclear region, we created a data cube binned by 4 spectral pixels and 2 pixels along the slit, to create almost square km s-1 pixels. From this we can see the ionized gas kinematics with minimal spatial averaging. Figure 9a shows the line extent as a function of position along a N-S cut through the central source; Figure 9b shows an E-W cut, also through the center. The N-S position-velocity diagram has an obvious velocity gradient of several tens of km s-1 arcsec-1 with blue north and red south, very similar to the CO (Aalto & Huttemeister, 2000) and HI (Beswick et al., 2005) results. The ionized gas gradient is km s-1 in 4.2″, for a spatial gradient (corrected for the inclination angle) of 390 km s-1kpc-1. The total velocity extent is similar to the CO results but the gradient is slightly higher than the 320 km s-1kpc-1 of the atomic and molecular gas; this may be because of the very different beam sizes.
The [NeII] observations average over a very patchy distribution of ionized gas. We checked that this does not distort the position-velocity diagram by comparing it to that of the simulated data cube based on the radio continuum maps; they are consistent. The gradient is not due to averaging over sources at offset velocities: the velocity offsets between the [NeII] sources result from their positions along an incompletely sampled velocity gradient.
In the E-W position-velocity diagram the central and the western source appear spatially separated and with almost identical velocity ranges of 2400–2550 km s-1 . There is nothing to suggest an E-W gradient; we find from the simulated cube that if there were a gradient as large as 20 km s-1 per arcsecond, it would appear in the position-velocity diagram. There is a separate red feature at 2580 km s-1 , most clearly in the central source; we believe that to be part of the southern source which was included in the same beam.
4.4 A Galaxy Core in Solid-Body Rotation
In the previous sections we showed that the none of the H ii regions measured in the [NeII] and radio are likely to be a galactic nucleus. But even if the mass distribution is not apparent in the CO, radio and [NeII] maps, its gravitational effects cannot be hidden. We now find that there is no kinematic sign of a nuclear mass concentration either. In a spiral galaxy there is usually a very broad line on the nucleus and a velocity jump across it; there is no such pattern in NGC 4194. Specifically the central source, the apparent candidate for nucleus, has the narrowest line profile of all the [NeII] sources. The only kinematic hint at a mass concentration is in the CO velocity field; the isovelocity contours, which are evenly spaced across the main radio and CO peaks, kink and take on a closer spacing around . But that location is between the central and western radio sources and there is no emission peak, at any wavelength, there. Instead, the kinematics are dominated by a smooth gradient N-S in both molecular and ionized gas. Smooth gradients imply solid body rotation. In disk galaxies solid body rotation is usually associated with rings, and elliptical galaxies, especially those that are post-merger, may host cores several hundred pc in size, kinematically distinct from the rest of the galaxy, with this rotation pattern (de Zeeuw & Franx, 1991).
How can the galaxy have the kinematic signature of solid body rotation while the ionized gas appears to be a two-armed spiral? If we critically examine the low-level radio emission maps in Figure 3, it is clear that the appearance of ‘spiral structure’ depends very strongly on the southeast elongation of the southern source. The sub-sources fall on a line southeast-northwest and the emission extends further in a spur in the same direction. The whole southern complex is almost perpendicular to the emission connecting the southern and central sources, so that together with the elongated central source the region suggests a ‘twin peaks’ star formation structure–but again, that contradicts the kinematics, which are not at all like those of the barred spirals where ‘twin peaks’ form. Finally, the ‘arm-like’ arc of radio emission connecting the central and western sources lies north-west of the main CO emission in the region of highest radio-to-CO ratio; it may show a front of star formation proceeding into the clouds, rather than a true spiral arm. So the spiral structure which appears to first glance is less certain on closer inspection.
Let us now work from the opposite direction: how does the ionized gas distribution fit the kinematic results? The central and southern sources are clusters that have formed in a rotating spheroidal core with southern end receding. We cannot rule out that the rotating region is a very thick ring or disk instead of a spheroid; if this case the clusters have formed throughout the thickness of the ring. That the western source has almost the same velocity as the central may agree with the finding of Aalto & Huttemeister (2000) that the velocities of cloud C and D are consistently lower than if they were in solid body rotation with A and B. The western source, like its host cloud, may not have yet settled into equilibrium.
5 Conclusions
We have presented high-resolution radio continuum maps at 6, 3.6 and 2 cm, and a high spectral-resolution velocity-position cube in the [NeII] m emission line, of the central of NGC 4194. These maps are the first high resolution, extinction-free, measurements of ionized gas in the center of this galaxy and trace the star formation regions with resolution up to 0.18″(). We find that:
-
•
NGC 4194 hosts a nuclear starburst that has formed multiple compact sources, apparently groups of embedded super star clusters, within a 3″ radius. The low-level radio emission suggets a ’nuclear spiral’ but that is not confirmed by the kinematics.
-
•
Based on the thermal radio emission at 2 cm, which agrees well with previous observations at 2.7mm, we find for the central 10″ region a thermal free-free flux of , which implies a Lyman continuum rate of . For a Kroupa IMF and a 3 Myr starburst, this implies a star formation rate of 10 , and a luminosity in massive young stars of , about a third of the total infrared luminosity of . The star formation in this galaxy is dispersed widely over the inner 10″ (1.9 kpc) region. Our radio observations are not sensitive to regions with 2 cm fluxes less than mJy, or , so it is possible that the remaining infrared luminosity arises in smaller, and widely dispersed, star forming regions within the system.
-
•
Of the compact emission sources that are bright enough to analyze, one has a pure thermal or slightly rising spectrum, typical of a very young embedded H ii region. The others are older and have a mix of thermal and significant non-thermal emission. The [NeII] line velocity dispersions are consistent with the gravitational effects of many dense star clusters.
-
•
The ionized gas has a smooth N-S velocity gradient of 390 km s-1kpc-1 across the observed region, consistent with a core in solid body rotation.
-
•
None of the radio sources can be convincingly identified with a galactic nucleus. The nuclei of the original merger partners have not been identified.
-
•
The CO velocity field shows that a mass concentration is present at . This location is in between and roughly equidistant from the three star formation regions, and there is no star formation detected there.
How can the last two items on this list be reconciled with the scenario that the Medusa is a minor merger? Each of the merger partners presumably hosted a nucleus of mass that would be detected via their influence on the kinematics. It is possible, and would be consistent with the simulations, to have both original nuclei now included in the mass concentration detected in the isovelocity contours. But in this case the nuclei must be devoid of star formation and ionised gas, or they would be detected in the radio and [NeII]. The gas and stars in the center of NGC 4194 have not come to equilibrium and the starburst may continue in regions now quiescent. Measurements of ionised and molecular gas with higher spatial resolution, and simulations exploring the central kpc, could perhaps find more clues to the behaviour of this remarkable galaxy.
TEXES observations at the IRTF were supported by NSF AST-0607312 and by AST-0708074 to Matt Richter. This research has made use of the NASA&IPAC Extragalactic Database (NED) which is operated by the Jet Propulsion Laboratory, Caltech, under contract with NASA. We thank an anonymous referee for careful and thoughtful comments.
References
- Achtermann & Lacy (1995) Achtermann, J.M. & Lacy, J.H., ApJ 439, 163 (1995)
- Aalto et al. (2010) Aalto, S., Beswick, R., & Jutte, E. å 552, A59 (2010)
- Aalto & Huttemeister (2000) Aalto, S, & Huttemeister, S. A&A 362, 42 (2000)
- Beck et al. (2010) Beck, S.C., Lacy, J., Turner, J., ApJ 722, 1175 (2010)
- Beck et al. (2013) Beck, S.C., Turner, J., Lacy, J., Greathouse, T., Lahad, O., ApJ 767, 53 (2013)
- Beck et al. (2012) Beck, S.C., Lacy, J., Turner, J., Kruger, A., Richter, M., & Crosthwaite, L., ApJ 755, 59 (2012)
- Becker et al. (1991) Becker, R. H.; White, R. L.; Edwards, A. L., ApJS 75, 1 (1991)
- Beswick et al. (2005) Beswick, R.J., Aalto, S., Pedlar, A., & Huttemeister, S., A&A 44, 791 (2005)
- Condon et al. (1990) Condon, J. J.; Helou, G.; Sanders, D. B.; Soifer, B. T. ApJS 73, 359 (1990)
- Condon (1992) Condon, J. ARA&A 30, 575 (1992)
- de Zeeuw & Franx (1991) de Zeeuw, T, & Franx, M., ARA&A, 29, 239 (1991)
- Hancock et al. (2006) Hancock, M.; Weistrop, D.; Nelson, C. H.; Kaiser, M. E., AJ 131, 135 (2006)
- Hattori et al. (2004) Hattori, T.; Yoshida, M.; Ohtani, H.; Sugai, H.; Ishigaki, T.; Sasaki, M.; Hayashi, T.; Ozaki, S.; Ishii, M.; Kawai, A., AJ 127, 736 (2004)
- Ho, Beck & Turner (1990) Ho, P., Beck, S.C., & Turner, J. ApJ, 349, 57 (1990)
- Jog & Maybhate (2006) Jog, C., & Maybhate, A., MNRAS 370, 891 (2006)
- Kaaret & Alonso-Herrero (2008) Kaaret, P., & Alonso-Herrero, A. 2008, ApJ, 682, 1020
- Kartaltepe et al. (2010) Kartaltepe, J. S., Sanders, D. B., Le Floc’h, E.,Frayer, D. T., Aussel, H., Arnouts, S., Ilbert, O., Salvato, M., Scoville, N. Z., Surace, J., and 19 coauthors, ApJ 721, 98 (2010)
- Keto et al. (1999) Keto, E., Hora, J., Fazio, G, Hoffmann, W., & Deutsch, L., ApJ 518, 183 (1999)
- Lacy et al. (2002) Lacy, J., Richter, M., Greathouse, T., &Zhu, Q-F., PASP 114, 153 (2002)
- Manthey et al. (2008) Manthey, E.; Aalto, S.; H ttemeister, S.; Oosterloo, T. A, A&A 484, 693 (2008
- O’Halloran et al. (2006) O’Halloran, B., Satyapal, S., & Dudik. R.P., ApJ 641, 795 (2006)
- Osterbrock & Ferland (2006) Osterbrock, D., & Ferland, G. ’Astrophysics of Gaseous Nebulae and Active Galactic Nuclei’, Sausolito, Ca. University Science Books (2006)
- Sanders et al. (1988) Sanders, D. B., Soifer, B. T., Elias, J. H., Neugebauer, G., & Matthews, K. 1988, ApJ, 328, L35
- Sturm et al. (2002) Sturm, E., Lutz, D., Verma, A., Netzer, H., Sternberg, A., Moorwood, A., Oliva, E., & Genzel, R. A&A 393, 821 (2002)
- Tsai et al. (2009) Tsai, C.-W., Turner, J. L., Beck, S. C., Meier, D. S., & Ho, P. T. P. 2009, AJ, 137, 4655
- Turner et al. (2003) Turner, J. L.; Beck, S. C.; Crosthwaite, L. P.; Larkin, J. E.; McLean, I. S.; Meier, D. S., Nature 423, 621 (2003)
- Turner & Ho (1994) Turner, J.L., & Ho, P.T.H., ApJ 421, 122 (1994)
- Weistrop et al. (2004) Weistrop, D.; Eggers, D.; Hancock, M.; Nelson, C. H.; Bachilla, R.; Kaiser, M. E., AJ 127, 1360 (2004)
- Zhu et al. (2008) Zhu, Q-F., J.H., Jaffe, D., Richter, M. & Greathouse, T., ApJS 177, 584 (2008)
| Date | Instrument | Wavelength | Beam Size | aa is the angular size of the largest structure to which the observations were sensitive. | noise | Program |
|---|---|---|---|---|---|---|
| 2/2/2013 | TEXES | m | n.a. | n.a. | 1.4″ | n.a. |
| 6/7/1987 | VLA | 2 cm | ″ | 3.6″ | 0.06 mJy/bm | AE47 |
| 21/11/1987 | VLA | 6 cm | ″ | 24″ | 0.05 mJy/bm | AS286 |
| 20/11/2000 | VLA | 6 cm | ″ | 8.9″ | 0.08 mJy/bm | AN095 |
| ” | ” | ” | ″ | 8.9″ | 0.02 mJy/bm | ” |
| ” | ” | 3.6 cm | ″ | 5.3″ | 0.023 mJy/bm | ” |
| ” | ” | ” | ″ | 5.3″ | 0.015 mJy/bm | ” |
| 19/3/2001 | ” | ” | ″ | 17″ | 0.04mJy/bm | ” |
| ID | RA (2000) | Dec (2000) | Major Axis | Minor Axis | Peak Intensity | Total |
|---|---|---|---|---|---|---|
| Central 1 | 12 14 09.68 | 54 31 35.73 | 0.46″ | 0.22″ | 0.8 mJy/bm | 1.2 mJy |
| Central 2 | 12 14 09.67 | 54 31 35.74 | 0.21″ | 0.14″ | 1.16 mJy/bm | 2 mJy |
| Central 3 | 12 14 09.65 | 54 31 35.86 | 0.22″ | 0.11″ | 1.9 mJy/bm | 3.3 mJy |
| W. Source | 12 14 09.326 | 54 31 35.68 | 0.23″ | 0.14″ | 0.46 mJy/bm | 0.94 mJy |
| South 1 | 12 14 09.59 | 54 31 34.6 | 0.5″ | 0.37″ | 0.3 mJy/bm | 0.57 mJy |
| South 2 | 12 14 09.63 | 54 31 34.27 | 0.51″ | 0.43″ | 0.46 mJy/bm | 0.9 mJy |
| South 3 | 12 14 09.66 | 54 31 34.21 | 0.69″ | 0.513″ | 0.46 mJy/bm | 1.24 mJy |