Examination of the directed flow puzzle in heavy-ion collisions
Abstract
Recent STAR data for the directed flow of protons, antiprotons, and charged pions obtained within the beam energy scan program are analyzed within the parton-hadron-string-dynamics (PHSD and HSD) transport models and a 3-fluid hydrodynamics (3FD) approach. Both versions of the kinetic approach, HSD and PHSD, are used to clarify the role of partonic degrees of freedom. The PHSD results, simulating a partonic phase and its coexistence with a hadronic one, are roughly consistent with data. The hydrodynamic results are obtained for two equations of state (EoS), a pure hadronic EoS and an EoS with a crossover type transition. The latter case is favored by the STAR experimental data. Special attention is paid to the description of antiproton directed flow based on the balance of annihilation and the inverse processes for pair creation from multimeson interactions. Generally, the semiqualitative agreement between the measured data and the model results supports the idea of a crossover type of quark-hadron transition that softens the nuclear EoS but shows no indication of a first-order phase transition.
pacs:
25.75.-q, 24.85.+p, 12.38.MhI Introduction
As has been widely recognized, the study of the particle azimuthal distribution in momentum space with respect to the reaction plane is an important tool to probe the hot, dense matter created in heavy-ion collisions VPS10 ; So10 . The directed flow refers to a collective sidewards deflection of particles and is characterized by the first-order harmonic of the Fourier expansion of the particle azimuthal angular distribution with respect to the reaction plane PV98 . The second harmonic coefficient , called elliptic flow, and the triangular flow have been extensively studied both theoretically and experimentally in the last years by about 5 orders of magnitude in the collision energy STAR10 . In contrast, apart from first measurements in the early nineties and till recent times, the directed flow was studied mainly theoretically although some experimental information from the GSI Schwerionen Synchrotron (SIS) to CERN Super Proton Synchrotron (SPS) energies is available CBMbook .
It is generally believed that the directed transverse flow is generated early in the heavy-ion collision before a thermalization of the degrees of freedom occurs. In particular, in the fragmentation region (i.e. at large rapidity or pseudorapidity), the directed flow is generated during the nuclear passage time So97 ; HWW99 . The directed transverse flow therefore probes the onset of bulk collective dynamics during thermalization, thus providing valuable information on the pre-equilibrium stage SH92 ; KKP95 ; E877 ; NA44 . In earlier times (at moderate beam energies) the first flow harmonic defined as
| (1) |
with respect to the reaction plane was characterized differently, i.e., by the mean transverse momentum per particle projected on the reaction () plane in the center-of-mass system which differs from the harmonic component. Unfortunately, it is not possible to convert or directly compare data to the earlier analysis. The NA49 Collaboration NA49 has measured the flow coefficient for pions and protons at SPS energies and a negative slope was observed by the standard event plane method for pions. Often, just the slope of at midrapidity has been used to quantify the strength of the directed flow.
At BNL Alternating Gradient Synchrontron (AGS) energies 11.5 A GeV, the dependence has a characteristic S-shape attributed to the standard distribution. The projected average momentum grows linearly with rising rapidity between the target and projectile fragmentation regions. Conventionally, this type of flow – with positive derivative – is called normal flow, in contrast to the antiflow for which 0 E877-7 ; NA49 ; RR97 ; HWW99 . At these moderate energies the slope of at midrapidity is observed to be positive for protons and significantly smaller in magnitude and negative for pions E877-7 ; NA49 ; WA98 . The smooth fall off of this function with beam energy is reasonably reproduced by the available hadronic kinetic models (see the comparison in Ref. INN00 ).
The shape of the rapidity dependence is of special interest because the directed flow at midrapidity may be modified by the collective expansion and reveal a signature of a phase transition from normal nuclear matter to a quark-gluon plasma (QGP). This is commonly studied by measuring the central rapidity region that reflects important features of the system evolution from its initial state. The predicted flow coefficient is small close to midrapidity with almost no dependence on pseudorapidity. However, as first demonstrated in Refs. Ri95 ; Ri96 , the 3D hydrodynamic expansion with an equation of state (EoS) including a possible phase transition exhibits some irregularity in the evolution of the system. When including a first order phase transition this leads to a local minimum in the proton excitation function of the transverse directed flow at 8 A GeV. Such a first-order transition leads to a softening of the EoS and consequently to a time-delayed expansion. The existence of this “softest point” of the EoS at a minimum of the energy density leads to a long lifetime of the mixed phase and consequently in a prolonged expansion of matter HS94 . Presently, the critical energy density (or latent heat for a first-order transition at finite quark chemical potential) is not well known and estimates vary from 0.5 GeV/fm3 to 1.5 GeV/fm3 HS94 ; ST95 ; MO95 ; RG96 ; RPM96 . A softest point at 1.5 GeV/fm3 should give a minimum in the directed flow excitation function at 30 A GeV HS94 ; ST95 . In the case of ideal hydrodynamics the directed proton flow shows even a negative (“ collapse”) between 8 A GeV and 20 A GeV St05 and with rising energy increases back to a positive flow. The ideal hydro calculations suggest that this “softest point collapse” is at 8 A GeV but this was not confirmed by available AGS data St05 . However, a linear extrapolation of the AGS data indicates that a collapse of the directed proton flow might be at 30 A GeV. However, this minimum in the given energy range is not supported in the two-fluid model with a phase transition INN00 .
This finding was further developed in more detail in the AGS-SPS energy range. It was demonstrated that at these energies the event shape resembles an ellipsoid in coordinate space, tilted by an angle with respect to the beam axis. This ellipsoid expands predominantly orthogonal to the bouncing-off direction given by , forming a so-called “third component” CR99 or “antiflow component” Br00 . In addition to the deep minimum at 8 A GeV a clear maximum was observed at 40 A GeV Br00 exhibiting a characteristic “wiggle” SSV00 in the excitation function. For high-energy nucleus-nucleus collisions, a combination of space-momentum correlations of radial expansion together with the correlation between the position of a nucleon in the nucleus and its stopping, results in a very specific rapidity dependence of directed flow: a reversal of the sign in the midrapidity region SSV00 , in other words, the directed flow changes sign three times. A similar rapidity dependence of the directed flow could be developed due to a change in the matter compressibility if a QGP is formed CR99 ; Br00 ; BS02 . Although being in good agreement with experimental data for many global observables, the three-fluid hydrodynamic model IRT06 with a purely hadronic EoS fails to describe the directed flow at energies above 40 A GeV RI06 .
Thus, in hydrodynamic calculations Br00 ; CR99 ; St05 , the wiggle like structure in the excitation function appears only under the assumption of a QGP with a first-order phase transition thus becoming a signature of the QGP phase transition. The wiggle structure is interpreted as a consequence of the expansion of the highly compressed, disk-shaped system tilted with respect to the beam direction Br00 . A similar wiggle structure of the nucleon is predicted in transport models if one assumes strong but incomplete baryon stopping together with strong space-momentum correlations caused by transverse radial expansion SSV00 .
While the predictions for baryon directed flow are very similar in both hydrodynamical and transport models, the situation for the pion directed flow is less clear. The Relativistic Quantum Molecular Dynamics (RQMD) model calculations SSV00 for Au+Au collisions at 200 GeV indicate that shadowing by protons causes the pions to flow dominantly with the opposite sign to the protons, but somewhat diffused due to higher thermal velocities for pions. Similar the Ultra-relativistic Quantum Molecular Dynamics (UrQMD) calculations BS02 predict no wiggle for pions in the central rapidity region with a negative slope at midrapidity as observed at lower collision energies. It is argued that directed flow, as an odd function of rapidity , may exhibit a small slope flatness at midrapidity due to a strong expansion of the fireball being tilted away from the collision axis. If the tilted expansion is strong enough, it can even overcome the bouncing-off motion and result in a negative slope at midrapidity, potentially producing a wiggle-like structure in .
Note that although the calculations Br00 ; CR99 for antiflow and/or a third flow component are found for collisions at SPS energies, where a first-order phase transition to a QGP might be expected St05 , the direct reason for the negative slope is the strong, tilted expansion, which may also be important at top BNL Relativistic Heavy Ion Collider (RHIC) energies. The directed flow at 200 GeV with a tilted source as the initial condition is predicted to be small near midrapidity with very weak dependence on pseudorapidity. Calculations involving a QGP phase with a first-order phase transition suggest that may exhibit a characteristic “wiggle” CR99 ; St05 ; Br00 ; SSV00 ; BS02 . In this case - in contrast to the observed sideward deflection pattern at lower energy, where the sign changes only at midrapidity - the directed flow changes sign three times, not counting a possible sign change near beam rapidities. In these calculations the wiggle structure is interpreted as a consequence of the expansion of the system, which is initially tilted with respect to the beam direction; the expansion leads to the above-mentioned antiflow or third flow component.
It is an experimental challenge to measure accurately at RHIC energies due to the relatively small signal and a potentially large systematic error arising from azimuthal correlations not related to the reaction plane orientation (nonflow effects). The first RHIC measurements of azimuthal anisotropy for charged particles at (62-200) GeV show that appears to be close to zero near midrapidity. Similar results have been obtained by the STAR STAR-v1 , PHOBOS PHOBOS-v1 , and PHENIX Collaborations using different correlation methods. The model analysis of these data for nonidentified hadrons is in reasonable agreement with experiment and shows no wiggle structure BW10 ; To12 . Generally, similar conclusions follow from the analysis of the excitation functions in a large energy range carried out within different macroscopic (hydro with hadronic, two-phase and chiral transition EoS BW10 ; MSM11 ; CHIRAL11 ) and microscopic (UrQMD and multiphase transport BW10 ; UrQMD06 ; AMPT10 ) models that definitely show that systematic measurements with higher precision for identified hadrons and more developed models are needed.
The interest in the directed flow has recently been enhanced considerably due to new STAR data obtained in the framework of the beam energy scan (BES) program STAR-14 . The directed flow of identified hadrons – protons, antiprotons, and positive and negative pions – has been measured first with high precision for semicentral Au+Au collisions in the energy range (7.7-200) GeV. These data provide a promising basis for studying direct-flow issues as discussed above and have been addressed already by the Frankfurt group SAP14 limiting themselves to the energy 20 GeV where hadronic processes are expected to be dominant. However, the authors of Ref. SAP14 did not succeed in describing the data and in obtaining conclusive results which led to the notion of the “directed flow puzzle”. Our study aims to analyze these STAR results in the whole available energy range including in particular antiproton data. Here we use two complementary approaches: the kinetic transport [the parton-hadron string dynamics (PHSD)] approach and relativistic three-fluid hydrodynamics (3FD) with different equations of state.
We start with a short presentation of the PHSD approach and its hadronic version HSD (without partonic degrees of freedom) and then analyze the BES data in terms of both transport models to explore where effects from partonic degrees of freedom show up. Furthermore, we make comparisons also with predictions of other kinetic models in Sec. II while in Sec. III a similar analysis is performed within a collective model, i.e., the 3FD. Our findings are summarized in Sec. IV.
II Directed flow in microscopic approaches
II.1 Reminder of PHSD
The PHSD model is a covariant dynamical approach for strongly interacting systems formulated on the basis of Kadanoff-Baym equations JCG04 ; CB09 or off-shell transport equations in phase-space representation, respectively. In the Kadanoff-Baym theory the field quanta are described in terms of dressed propagators with complex self-energies. Whereas the real part of the self-energies can be related to mean-field potentials of Lorentz scalar, vector, or tensor type, the imaginary parts provide information about the lifetime and/or reaction rates of timelike particles Ca09 . Once the proper complex self-energies of the degrees of freedom are known, the time evolution of the system is fully governed by off-shell transport equations for quarks and hadrons (as described in Refs. JCG04 ; Ca09 ). The PHSD model includes the creation of massive quarks via hadronic string decay – above the critical energy density 0.5 GeV/fm3 – and quark fusion forming a hadron in the hadronization process. With some caution, the latter process can be considered as a simulation of a crossover transition because the underlying EoS in PHSD is a crossover Ca09 . At energy densities close to the critical energy density the PHSD describes a coexistence of this quark-hadron mixture. This approach allows for a simple and transparent interpretation of lattice QCD results for thermodynamic quantities as well as correlators and leads to effective strongly interacting partonic quasiparticles with broad spectral functions. For a review of off-shell transport theory we refer the reader to Ref. Ca09 ; PHSD model results and their comparison with experimental observables for heavy-ion collisions from the lower SPS to RHIC energies can be found in Refs. Ca09 ; To12 ; KBC12 ; Linnyk2011 . In the hadronic phase, i.e., for energies densities below the critical energy density, the PHSD approach is identical to the hadron-string-dynamics (HSD) model EC96 ; PhysRep ; CBJ00 .
The HSD approach formally can be written as a coupled set of transport equations for the phase-space distributions of hadron , which includes the real part of the scalar and vector hadron self-energies. The hadron quasiparticle properties here are defined via the mass-shell constraint with effective masses and momenta. In the HSD transport calculations we include nucleons, ’s, , , , , and hyperons, ’s, and ’s as well as their antiparticles. High-energy inelastic hadron-hadron collisions are described by the FRITIOF model Fritiof , where two incoming hadrons emerge from the reaction as two excited color singlet states, i.e., “strings”. The excitation functions for various dynamical quantities as well as experimental observables from SIS to RHIC energies within the HSD transport approach can be found in Refs. PhysRep ; CBJ00 ; Brat04 .
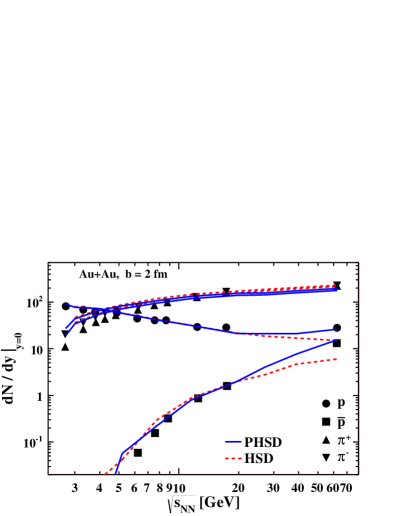
Figure 1 illustrates how the hadron multiplicity at midrapidity is reproduced within the PHSD (solid lines) and HSD (dashed lines) kinetic approaches. We point out that the antiproton abundance is a crucial issue. In the AGS-SPS low-energy range (20 GeV) both models agree quite reasonably with experiment, including the antiproton yield. The enhancement of the proton and antiproton yield at 62 GeV in PHSD relative to HSD can be traced back to a larger baryon/antibaryon fraction in the hadronization process. At lower energies this agreement is reached by taking into account the annihilation to three mesons (e.g., , , and ) as well as the inverse channels employing detailed balance as worked out in Ref. Ca02 . These inverse channels are quite important; in particular, at the top SPS energy this inverse reaction practically compensates the loss of antiprotons due to their annihilation Ca02 . At lower SPS and AGS energies the annihilation is dominant due to the lower meson abundancies; however, the backward channels reduce the net annihilation rate. We mention that the multiple-meson recombination channels are not incorporated in the standard UrQMD transport model Bass . The proton multiplicities are reproduced rather well in the PHSD and HSD approaches but the multiplicity of charged pions is slightly overestimated for 10 GeV. This discrepancy is observed also in other transport models Br99 ; LCLM01 and is the subject of separate investigations.
II.2 Directed flow from microscopic dynamical models
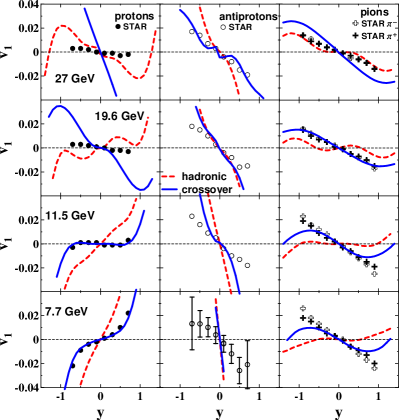
The whole set of directed flow excitation functions for protons, antiprotons and charged pions from the PHSD and HSD models is presented in Fig. 2 in comparison to the measured data STAR-14 including early STAR results for the two highest energies. The initial states in the PHSD and HSD are simulated on an event-by-event basis taking into account fluctuations in the position of the initially colliding nucleons and fluctuations in the reaction plane. This procedure is identical to that in the study of the elliptic flow in Ref. KBC12 . The average impact parameter for the selected events is 7 fm. In the simulations the experimental acceptance GeV/c is taken into account for all hadrons STAR-14 .
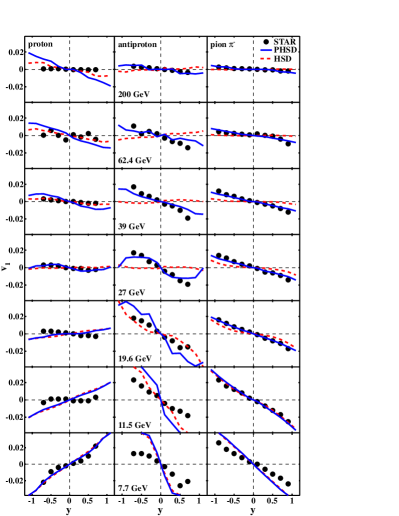
At first glance, both models – in particular the PHSD – correctly reproduce the general trends in the differential with bombarding energy: the slope for protons is positive at low energies ( 20 GeV) and approaches zero with increasing energy while antiprotons and pions have negative slopes, respectively, in the whole energy range. In more detail: for protons the directed flow distributions are in reasonable agreement with the STAR measurements in the whole range of the collision energies considered (except for 11.5 and 200 GeV). However, for antiprotons agrees with the data only for the highest energies where baryon-antibaryon pairs are dominantly produced by hadronization. This becomes evident from a comparison to the HSD results with . The shape of the distribution for antiprotons starts progressively to differ from the measured data if we proceed from 11.5 to 7.7 GeV. In the lower energy range the HSD and PHSD results get very close which indicates the dominance of hadronic reaction channels (absorption and recreation). The direct flow distributions for negative and positive pions are close to each other and also begin to disagree with experiment in the same range of low collision energies as for antiprotons (see Fig. 2). Again the PHSD results are very close to the experimental measurements at higher energies while the HSD results deviate more sizeably, thus stressing the role of partonic degrees of freedom in the entire collision dynamics. The clear overestimation of the and slopes at 7.7 GeV demonstrates that the heavy-ion dynamics is not yet fully understood within the string/hadron picture at the lower energies.
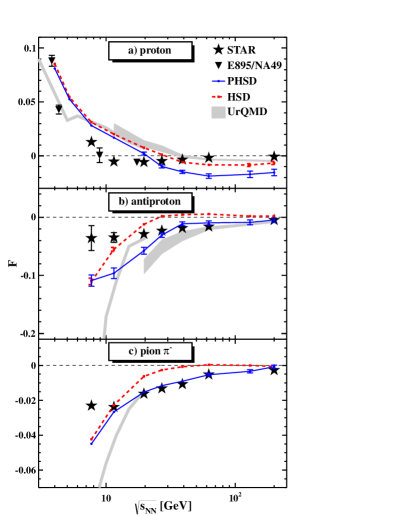
The characteristic slope of the distributions at midrapidity, , is presented in Fig. 3 for all cases considered in Fig. 2. In a first approximation the flow in the center-of-mass system may be well fitted by a linear function within the rapidity interval . A cubic equation is also used,
| (2) |
to obtain an estimate of the uncertainty in extracting the coefficient . The error bars in Fig. 3 just stem from the different fitting procedures. Note that the energy axis in Fig. 3 is extended by adding experimental results for 62 and 200 GeV STAR-14 . This representation is more delicate as compared to in Fig. 2. For protons there is a qualitative agreement of the HSD ahd PHSD results with the experiment measurements: the slope at low energies, however, exceeding the experimental values by up to a factor of about 2; the slope crosses the line 0 at 20 GeV, which is twice larger than the experimental crossing point, and then stays negative and almost constant with further energy increase. However, the absolute values of the calculated proton slopes in this high energy range are on the level of –(0.01-0.02), while the measured ones are about –0.005. The standard UrQMD model results, as cited in the experimental paper STAR-14 and in the more recent theoretical work SAP14 , are displayed in Fig. 3 by the wide and narrow shaded areas, respectively. These results for protons are close to those from the HSD model and essentially overestimate the slope for energies below 30 GeV but at higher energy become negative and relatively close to the experiment. The predictions for the pure hadronic version of the transport model HSD [dotted lines in Fig. 3(a)] slightly differ from the PHSD results, which overpredict the negative proton slope at higher RHIC energies.
For the antiproton slopes we again observe an almost quantitative agreement with the BES experiment STAR-14 : with increasing collision energy the HSD and PHSD slopes grow and then flatten above 20-30 GeV. The HSD results saturate at , while the PHSD predictions stay negative and in good agreement with experiment [see Fig. 3(b)]. It is noteworthy to point out that these PHSD predictions strongly differ from the UrQMD results which no longer describe the data for 20 GeV but are in agreement with the measurements for higher energies. This disagreement might be attributed to a neglect of the inverse processes for antiproton annihilation Ca02 in UrQMD as described above.
The differences between the calculations and experimental data become apparent for the charged pion slopes at 11 GeV: the negative minimum of the charged pion slope is deeper than the measured one. The HSD and PHSD results practically coincide at low energy (due to a minor impact of partonic degrees of freedom) but dramatically differ from those of the UrQMD model for 20 GeV [see Fig.3(c)]. This difference might be attributed again to a neglect of the inverse processes for antiproton annihilation in UrQMD.
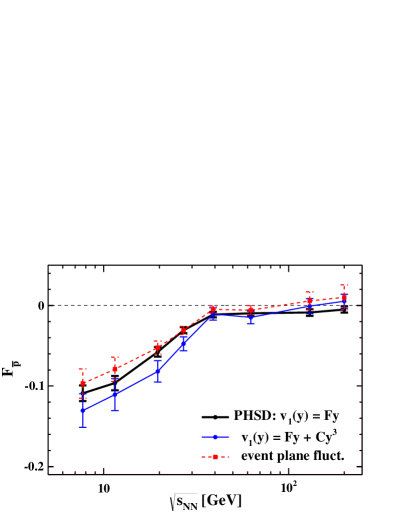
As noted before, we have taken into account fluctuations of the reaction plane which have an influence on the determination of the slopes. The influence of reaction plane fluctuations on the slope is illustrated in Fig. 4 for the case of antibaryons and improves the agreement with experiment STAR-14 . The correction due to fluctuations is not large enough, although it acts in the right direction. We note in passing that in the case of protons and charged pions this effect is even smaller. Furthermore, as is seen from the same figure, the use of a linear or cubic approximation for the fit of the distributions around midrapidity practically does not influence the slopes but changes the error bars.
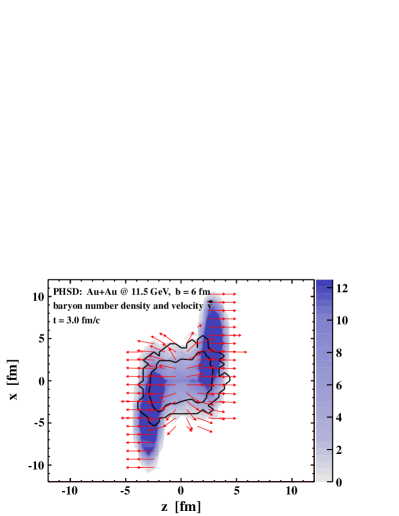
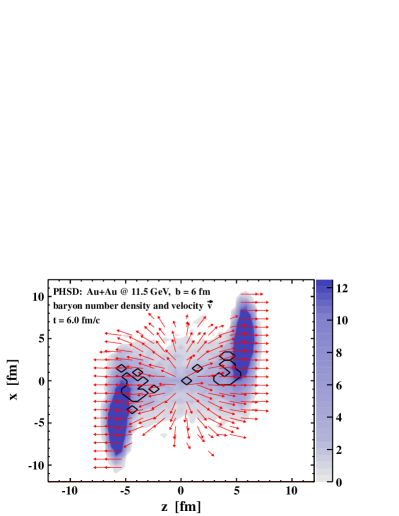
The appearance of negative slopes can be explained by the evolution of the tilted ellipsoid-like shape of the participant zone. This situation is illustrated in Fig. 5 by PHSD calculations and was assumed in Refs. CR99 ; Br00 . Snapshots of the velocity profile are shown for times 3 and 6 fm/c for semi peripheral Au+Au (11.5 GeV) collisions in the background of baryon density distributions where also parton blobs can be identified. Indeed, among the scattered particles there are many which move perpendicularly to the stretched matter (antiflow) and their multiplicity increases with time.
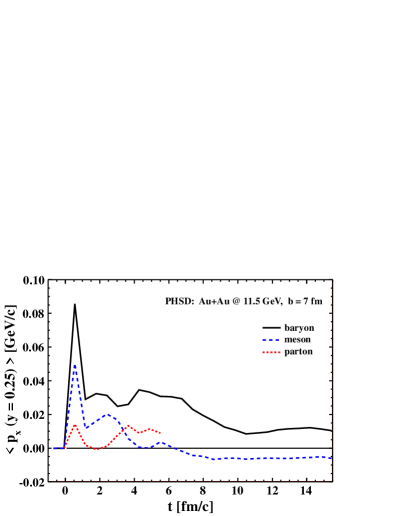
However, this component is weak and it is not clear whether these snapshots will result in observable effects for the final slope. The solution of this question is shown in Fig. 6. Here it is seen that the collective flow steeply rises within the first fm/c and decreases again in time. While the flow for partons (dotted line) stays small throughout time, the baryon flow drops to some constant positive value and the pion flow turns negative after fm/c in accordance with the results in Fig. 3.
Thus, in agreement with the STAR experimental data, in the considered energy range the PHSD model predicts for protons a smooth function that is flattening at 10 GeV and reveals no signatures of a possible first-order phase transition as expected in Refs. Ri95 ; Ri96 ; St05 . For antiprotons the slope at midrapidity manifests a wide but shallow negative minimum for 30 GeV while the measured slope is a monotonically increasing function. It is noteworthy that the new STAR data are consistent with the PHSD results which include a crossover transition by default due to a matching of the EoS to lattice QCD results.
III Directed flow in a macroscopic approach
III.1 The 3FD model
The 3FD model IRT06 is a straightforward extension of the two-fluid model with a radiation of direct pions MRS88 ; RIPH94 ; MRS91 and the (2+1)-fluid model Kat93 ; Brac97 . These models have been extended to treat the baryon-free fluid on an equal footing with the baryon-rich ones. A certain formation time, , is allowed for the fireball fluid, during which the matter of the fluid propagates without interactions. The formation time is associated with the finite time of string formation and decay and is incorporated also in the kinetic transport models such as PHSD and HSD.
The 3FD model IRT06 treats a nuclear collision from the very beginning, i.e., from the stage of the incident cold nuclei to the final freeze-out stage. Contrary to the conventional hydrodynamics, where a local instantaneous stopping of projectile and target matter is assumed, the specific feature of the 3FD is a finite stopping power resulting in a counter streaming regime of leading baryon-rich matter. The basic idea of a 3FD approximation to heavy-ion collisions Iv87-1 ; Iv87-2 is that at each space-time point a generally nonequilibrium distribution of baryon-rich matter can be represented as a sum of two distinct contributions initially associated with constituent nucleons of the projectile and target nuclei. In addition, newly produced particles, populating predominantly the midrapidity region, are associated with a fireball fluid. Therefore, the 3FD approximation is a minimal way to simulate the finite stopping power at high incident energies.
Different EoS’s can be implemented in the 3FD model in contrast to the PHSD that incorporates only a crossover transition. In particular, in this work we apply a purely hadronic EoS GM79 and an EoS with a crossover transition as constructed in Ref. KRST06 . In the latter case the transition is very smooth and the hadronic fraction (which can be treated as the order parameter) survives up to very high densities as illustrated in Ref. Iv13-alt1 . The physical input of the 3FD calculations is described in detail in Ref. Iv13-alt1 . No tuning (or change) of 3FD-model parameters has been done in the present study as compared to that stated in Ref. Iv13-alt1 .
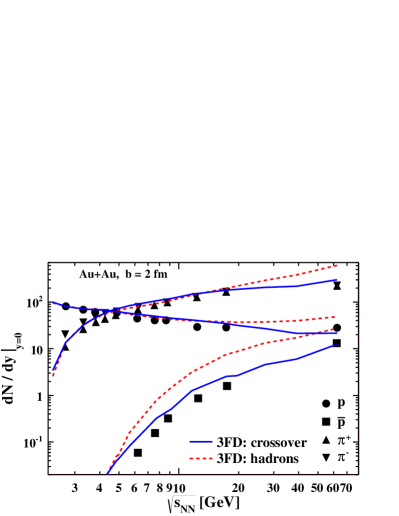
The particle yield at midrapidity calculated within the 3FD model is presented in Fig. 7. Both the hadronic EoS (dashed lines) and crossover EoS results (solid lines) for the proton and pion abundancies at 20 GeV are in good agreement with the experimental data and, in the case of charged pions, in even better agreement than in the HSD and PHSD approaches (cf. Fig. 1). The purely hadronic EoS definitely overestimates the antiproton yield at midrapidity in this energy range, while the EoS with the crossover transition quite reasonably agrees with the experimental data. Note that the antiprotons are mainly produced from the fireball (baryonless) fluid IRT06 . To a certain extent, this may be interpreted as being due to multimeson formation of in equilibrium in analogy to HSD and PHSD approaches where these channels are not in full equilibrium. The difference between the two EoS’s is clearly seen at higher energies 20 GeV, where the crossover EoS is favorable for all hadronic species rather than only for antibaryons () as pointed out in Ref. Iv13-alt2 .
III.2 Directed flow in the 3FD model
In recent works Iv13-alt1 ; Iv13-alt2 ; Iv13-alt3 ; Iv14 an analysis of the major part of bulk observables has been performed: the baryon stopping Iv13-alt1 , yields of different hadrons, their rapidity and transverse momentum distributions Iv13-alt2 ; Iv13-alt3 , and the elliptic flow excitation function Iv14 . This analysis has been carried out for the hadronic EoS and two types of EoS with deconfinement transition: a first-order phase transition and a crossover. It was found that scenarios with deconfinement transitions are preferable especially at high collision energies, though they are not perfect.
In this study we consider only two of the above mentioned scenarios, i.e., the purely hadronic scenario and the crossover one. The reason is primarily technical: It turned out that calculations of the directed flow are demanding and require a high numerical accuracy. In contrast to other observables, the directed flow is very sensitive to the step width of the computational grid and the number of test particles.111A numerical “particles-in-cell” scheme is used in the present simulations; see Ref. IRT06 and references therein for more details. The matter transfer due to pressure gradients, friction between fluids and production of the fireball fluid, is computed on a fixed grid (the so-called Euler step of the scheme). An ensemble of Lagrangian test particles is used for the calculation of the drift transfer of the baryonic charge, energy, and momentum (the so-called Lagrangian step of the scheme). Therefore, accurate calculations require very high memory and CPU time and accordingly, calculations for a first-order-transition EoS have not been completed yet. In particular, for the same reason we have failed so far to perform calculations for energies above 30 GeV. Note that the change of other observables, analyzed so far Iv13-alt1 ; Iv13-alt2 ; Iv13-alt3 ; Iv14 , is below 15% as compared to results of previous calculations.
The directed flow as a function of rapidity at BES-RHIC bombarding energies is presented in Fig. 8 for pions, protons and antiprotons. As seen, the 3FD model does not perfectly describe the distributions. However, we can definitely conclude that the description of the STAR data is better with the crossover EoS than that with the purely hadronic EoS. Note that the negative slope at midrapidity does not necessarily assume a QGP EoS SSV00 once a combination of space-momentum correlations – characteristic of radial expansion together with the correlation between the position of a nucleon in the fireball and its stopping – may result in a negative slope in the rapidity dependence of the directed flow in high-energy nucleus-nucleus collisions. Apparently, this is the case at 27 GeV with the hadronic EoS.
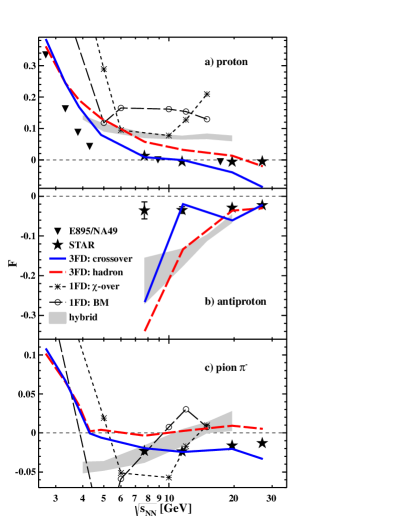
The excitation functions for the slopes of the distributions at midrapidity are presented in Fig. 9. As noted above, the discrepancies between experiment and the 3FD model predictions are larger for the purely hadronic EoS (dashed line) and, in addition, some weak substructure is observed here for protons and pions (for example, at 19.8 GeV). Indeed, the agreement with the 3FD model for the crossover EoS looks better (solid line in Fig. 9) though it is far from being perfect. Similarly to the kinetic approaches, hydrodynamics has a problem with the description of the low-energy behavior of the directed flow; however, the boundary of this disagreement shifts down to 8 GeV as compared to 20 GeV in the case of PHSD (cf. Fig. 3).
In Ref. CHIRAL11 an essential part of the STAR data (for 20 GeV) is analyzed within collective approaches: the one-fluid (1F) hydrodynamical model with a first-order phase transition simulated by the bag model (BM) and a crossover chiral transition (-over), as well as within a modern hybrid model combining hydrodynamics with a kinetic model in the initial and final (after-burner) stages of the collision using both EoS’s mentioned above. The results of this work are also displayed in Fig. 9 for comparison (the open circles and stars).
The 3FD model predicts reasonable results for the proton slopes in the range 20 GeV for the crossover EoS; the pure hadronic EoS results in a similar energy dependence but with slopes exceeds the experimental ones by 0.2. A similar behavior is observed for the pion slope function (see Fig. 9). In the case of antiprotons the slope for the crossover EoS (solid line in Fig. 9) is well described above 10 GeV but it sharply goes down with decreasing energy. For the pure hadronic EoS the 3FD functional dependence of the antiproton slope (dashed line in Fig. 9) looks similar but is shifted by almost 2-10 GeV towards higher energies.
The results of Ref. SAP14 for the proton slopes in the 1FD model overestimate the measured ones by an order of magnitude for both chiral (-over) and BM EoS’s; appropriate results for antiprotons are not reported. The calculational results are more definite for the hybrid model SAP14 : the shaded region in Fig. 9, which covers predictions for both EoS’s, is quite close to the 3FD results with the pure hadronic EoS for protons and antiprotons rather than to the experiment. One can conclude that the fluid dynamical calculations presented in Ref. CHIRAL11 are not able to explain the observed directed flow of identified hadrons.
III.3 Longitudinal fluctuations
The 3FD approach describes the evolution of participants that are defined by the initial geometry. Along with the participants there are also spectators, i.e., nucleons that emerged from the colliding nuclei and do not take part in any reaction with other nucleons during the collision process and move with their initial momenta. The number of spectators from each of the nuclei changes event-by-event and, due to this fluctuation, the center-of-mass (cm) of the participant system does not coincide with the collider center-of-mass system. These event-by-event fluctuations of are included automatically in the kinetic approach but not in the hydrodynamic case. As noted in Refs. long-sc ; VAC13 these fluctuations in the longitudinal cm rapidity might be especially significant in peripheral collisions and influence noticeably the flow characteristics.
To shed some light on this issue let be the probability of a fluctuation of the cm rapidity with respect to its mean value . Then
| (3) |
The flow at fixed is well fitted by
| (4) |
Then the flow due to fluctuations is
| (5) |
Thus
| (6) |
and the effective slope becomes . As a rule, and are of the same order and opposite in sign. Therefore, to significantly change (as compared to ) one needs , i.e. 0.5. In Ref. VAC13 it was estimated that 0.1 for midcentral Au+Au collisions, which does not produce a noticeable effect.
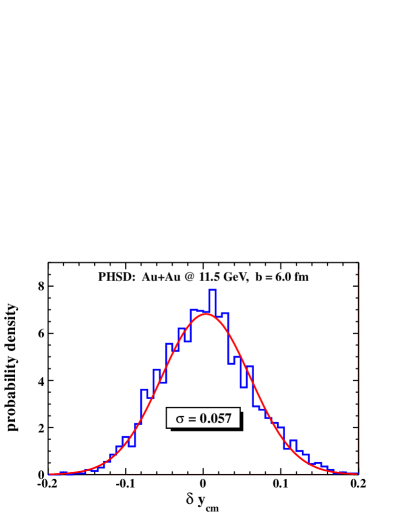
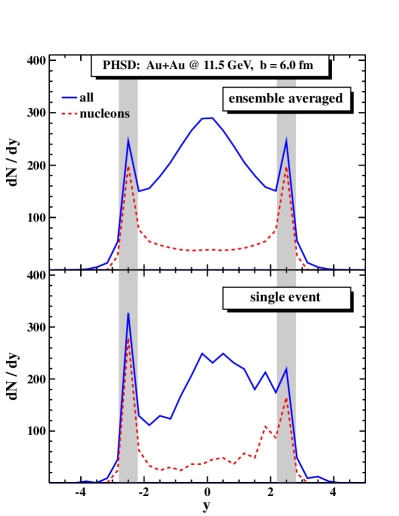
In Fig. 10 the rapidity distributions calculated for the PHSD at energy 11.5 GeV are presented for the average over many events and an individual event. Note that at this energy the PHSD CB09 and 3FD Iv13-alt2 predict similar results in an approximate agreement with experiment. We calculate the fluctuations within the PHSD approximating the result by a Gaussian distribution,
| (7) |
As is seen from Fig. 11 the PHSD calculations of the c.m. rapidity fluctuations at 11.5 GeV give a standard deviation 0.057 which slowly increases with energy reaching 0.08 at 17.3 GeV. Nevertheless, influence of fluctuations on the slope of the distribution remains negligible.
IV Conclusions
In this study the PHSD approach has been applied for the analysis of the recent STAR data on the directed flow of identified hadrons STAR-14 in the energy range 7.7-200 GeV. The excitation functions for the directed flows of protons, antiprotons, and charged pions turn out to be smooth functions in bombarding energy without “wiggle like” irregularities as expected before in Refs. Ri95 ; Ri96 ; HS94 ; ST95 ; MO95 ; RG96 ; RPM96 ; St05 ; CR99 ; Br00 . Our results differ from the standard UrQMD model at lower bombarding energies as included in Ref. STAR-14 and the recent theoretical analysis in Ref. SAP14 . The microscopic PHSD transport approach reproduces the general trend in the differential excitation function and leads to an almost quantitative agreement for protons, antiprotons, and pions especially at higher energies. We attribute this success to the Kadanoff-Baym dynamics incorporated in PHSD (with more accurate spectral functions) as compared to a Boltzmann-like on-shell transport model (UrQMD) and the account for parton dynamics also in this “moderate” energy range. The latter is implemented in PHSD in line with an equation of state from lattice QCD Wuppertal . The formation of the parton-hadron mixed phase softens the effective EoS in PHSD and describes a crossover transition (in line with the lattice QCD EoS). Accordingly, the PHSD results differ from those of HSD where no partonic degrees of freedom are incorporated. A comparison of both microscopic models has provided detailed information on the effect of parton dynamics on the directed flow (cf. Fig. 2).
Antiprotons have been shown to be particularly interesting. In HSD and PHSD we include antiproton annihilation into several mesons while taking into account also the inverse processes of creation in multimeson interactions by detailed balance Ca02 . Related kinetic models (including UrQMD) that neglect the inverse processes for antiproton annihilation at lower energies do not describe the data on the directed flow of hadrons . It is noteworthy that 3FD demonstrates high sensitivity to the nuclear EoS and provides the best results with a crossover for the quark-hadron phase transition being in a reasonable agreement with the STAR results in the considered energy range 30 GeV. Note also that a crossover transition is implemented by default in PHSD.
Still sizable discrepancies with experimental measurements in the directed flow characteristics are found for the microscopic kinetic models at 20 GeV and are common for both HSD and PHSD (and UrQMD Brat04 ) because the partonic degrees of freedom are subleading at these energies. We recall that the flow observables are not only ones where the kinetic approaches have a problem in this energy range. Another long-standing issue is the overestimation of pion production as seen in Fig. 1 in the energy regime around the “horn” in the meson ratio GG99 ; CBJ00 , which before has been related to a first-order phase transition or to the onset of deconfinement GGS11 . Our flow analysis shows no indication of a first-order transition. However, we have found further strong evidence that the dynamics of heavy-ion reactions at lower SPS and AGS energies is far from being understood especially on the hadronic level. We speculate that extended approaches including consistently chiral partners as well as a restoration of chiral symmetry at high baryon density and/or temperature might lead to a solution of the problem as well as precise experimental studies at the Facility for Antiproton and Ion Research (FAIR) and the Nuclotron-based Ion Collider Facility (NICA) CBMbook .
Acknowledgements.
The authors are thankful to E. L. Bratkovskaya for illuminating discussions and valuable suggestions. This work in part was supported by the LOEWE Center HIC for FAIR as well as BMBF. Y.B.I. was partially supported by Grant No. NS-932.2014.2.References
- (1) S. A. Voloshin, A. M. Poskanzer and R. Snellings, in Relativistic Heavy Ion Physics, edited by R. Stock, Landolt-Boernstein New Series, I/23, (Springer-Verlag, Berlin, 2010) p. 5-54.
- (2) P. Sorensen, in Quark-Gluon Plasma 4, edited by R. Hwa and X. N. Wang, (World Scientific, Singapore, 2010).
- (3) A. M. Poskanzer and S. A. Voloshin, Phys. Rev. C 58, 1671 (1998).
- (4) M. M. Aggarwal et al. (STAR Collaboration), arXiv:1007.2613.
- (5) P. Senger et al., Lect. Notes Phys. 814, 681 (2011).
- (6) H. Sorge, Phys. Rev. Lett. 78, 2309 (1997).
- (7) N. Herrmann, J. P. Wessels, and T. Wienold, Annu. Rev. Nucl. Part. Sci. 49, 581 (1999).
- (8) E. Schnedermann and U. Heinz, Phys. Rev. Lett. 69, 2908 (1992).
- (9) D. E. Kahana, D. Keane, Y. Pang, T. Schlagel and S. Wang, Phys. Rev. Lett. 74, 4404 (1995).
- (10) J. Barrette et al. (E877 Collaboration), Phys. Rev. Lett. 73, 2532 (1994).
- (11) I. G. Bearden et al. (NA44 Collaboration), Phys. Rev. Lett. 78, 2080 (1997).
- (12) C. Alt et al.(NA49 Collaboration), Phys. Rev. C 68, 034903 (2003).
- (13) J. Barrette et al. (E877 Collaboration), Phys. Rev. C 55, 1420 (1997); J. Barrette et al., Phys. Rev. C 56, 3254 (1997).
- (14) W. Reisdorf and H. G. Ritter, Annu. Rev. Nucl. Part. Sci. 47, 663 (1997).
- (15) M. M. Aggarwal et al. (WA98 Collaboration), arXiv:nucl-ex/9807004.
- (16) Yu. B. Ivanov, E. G. Nikonov, W. Nörenberg, A. A. Shanenko, and V. D. Toneev, Acta Phys. Hung. New Ser. Heavy Ion Phys. 15, 117 (2002).
- (17) D. H. Rischke, Y. Pursun, J. A. Maruhn, H. Stöcker, and W. Greiner, Acta Phys. Hung. New Ser. Heavy Ion Phys. 1, 309 (1995).
- (18) D. H. Rischke, Nucl. Phys. A 610, 88 (1996).
- (19) C. M. Hung and E. V. Shuryak, Phys. Rev. Lett. 75, 4003 (1995).
- (20) A. A. Shanenko and V. D. Toneev, JINR Rap. Com.5[73], 21 (1995); E. G. Nikonov, A. A. Shanenko and V. D. Toneev, Heavy Ion Phys. 4, 333 (1996).
- (21) L. Mornas and U. Ornik. Nucl. Phys. A587, 828 (1995).
- (22) D. Rischke and M. Gyulassy, Nucl. Phys. A597, 701 (1996).
- (23) D. H. Rischke, Y. Pürsün, J. A. Maruhn, H. Stöcker and W. Greiner, Acta Phys. Hung. New. Ser.: Heavy Ion Phys. 1, 309 (1996), [arXiv:nucl-th/9505014].
- (24) H. Stöcker, Nucl. Phys. A 750, 121 (2005).
- (25) L. P. Csernai and D. Rohrich, Phys. Lett. B 458, 454 (1999).
- (26) J. Brachmann, S. Soff, A. Dumitru, H. Stöcker, J. A. Maruhn, W.Greiner, L.V. Bravina, and D. H. Rischke, Phys. Rev. C 61, 024909 (2000).
- (27) R. J. M. Snellings, H. Sorge, S. A. Voloshin, F. Q. Wang, and N. Xu, Phys. Rev. Lett. 84, 2803 (2000).
- (28) M. Bleicher and H. Stöcker, Phys. Lett. B 526, 309 (2002).
- (29) Yu. B. Ivanov, V. N. Russkikh, and V. D. Toneev, Phys. Rev. C 73, 044904 (2006).
- (30) V. N. Russkikh, and Yu. B. Ivanov, Phys. Rev. C 74, 034904 (2006).
- (31) J. Adams et al. (STAR Collaboration), Phys. Rev. Lett. 92, 062301 (2004); A. H. Tang (STAR Collaboration), J. Phys. G 30, S1235 (2004); J. Adams et al., Phys. Rev. C 72, 014904 (2005); J. Adams et al., Phys. Rev. C 73, 034903 (2006). B. I. Abelev et al., Phys. Rev. Lett. 101, 252301 (2008); Y. Pandit (STAR Collaboration), J. Phys. Conf. Ser. 316, 012001 (2011).
- (32) M. Belt Tonjes (PHOBOS Collaboration), J. Phys. G30, S1243 (2004); B. B. Back et al. (PHOBOS Collaboration), Phys. Rev. Lett. 97, 012301 (2006).
- (33) P. Bozek and I. Wyskiel, Phys. Rev. C 81, 054902 (2010).
- (34) V. D. Toneev, V. Voronyuk, E. L. Bratkovskaya, W. Cassing, V. P. Konchakovski, and S. A. Voloshin, Phys. Rev. C 85, 034910 (2012).
- (35) A. V. Merdeev, L. M. Satarov, and I. N. Mishustin, Phys. Rev. C 84, 014907 (2011).
- (36) J. Steinheimer, V. Dexheimer, M. Bleicher, H. Petersen, S. Schramm, and H. Stöcker, Phys. Rev. C 81, 044913 (2010).
- (37) J. Y. Chen, J. X. Zuo, X. Z. Cai, F. Liu, Y. G. Ma, and A. H. Tang, Phys. Rev. C 81, 014904 (2010).
- (38) H. Petersen, Q. Li, X. Zhu, and M. Bleicher, Phys. Rev. C 74, 064908 (2006).
- (39) L. Adamczyk, et al. (STAR Collaboration), Phys. Rev. Lett. 112, 162301 (2014).
- (40) J. Steinheimer, J. Auvinen, H. Petersen, M. Bleicher, and H. Stöcker, Phys. Rev. C 89, 054913 (2014).
- (41) S. Juchem, W. Cassing, and C. Greiner, Phys. Rev. D 69, 025006 (2004); Nucl. Phys. A 743, 92 (2004).
- (42) W. Cassing, E. L. Bratkovskaya, Nucl. Phys. A 831, 215 (2009); Phys. Rev. C 78, 034919 (2008); W. Cassing, Nucl. Phys. A 791, 365 (2007).
- (43) W. Cassing, Eur. Phys. J.: Spec. Top. 168, 3 (2009).
- (44) V. P. Konchakovski, E. L. Bratkovskaya, W. Cassing, V. D. Toneev and V. Voronyuk, Phys. Rev. C 85, 011902 (2012).
- (45) O. Linnyk et al., Phys. Rev. C 84 (2011) 054917; Phys. Rev. C 85 (2012) 024910; Phys. Rev. C 87 (2013) 014905.
- (46) W. Ehehalt and W. Cassing, Nucl. Phys. A 602, 449 (1996).
- (47) W. Cassing and E. L. Bratkovskaya, Phys. Rep. 308, 65 (1999).
- (48) W. Cassing, E. L. Bratkovskaya, S. Juchem, Nucl. Phys. A674, 249 (2000).
- (49) E. L. Bratkovskaya, M. Bleicher, M. Reiter, S. Soff, H. Stöcker, M. van Leeuwen, S. A. Bass, and W. Cassing, Phys. Rev. C 69, 054907 (2004).
- (50) A. Andronic, P. Braun-Munzinger and J. Stachel, Nucl. Phys. A 772, 167 (2006).
- (51) X. Zhu (STAR Collaboration), Acta Phys. Pol. B Proc. Suppl. 5, 213 (2012).
- (52) C. Blume, M. Gazdzicki, B. Lungwitz, M. Mitrovski, P. Seyboth, and H. Stroebele, https://edms.cern.ch/document/1075059
- (53) C. Blume and C. Markert, Prog. Part. Nucl. Phys. 66, 834 (2011).
- (54) H. Pi, Comp. Phys. Commun. 71, 173 (1992); T. Sjöstrand et al., Comp. Phys. Commun. 135, 238 (2001).
- (55) W. Cassing, Nucl. Phys. A 700, 618 (2002).
- (56) S. A. Bass, M. Belkacem, M. Bleicher, M. Brandstetter, L. Bravina, C. Ernst, L. Gerland, M. Hofmann, S. Hofmann, J. Konopka, G. Mao, L. Neise, S. Soff, C. Spieles, H. Weber, L. A. Winckelmann, H. Stöcker, W. Greiner, Ch. Hartnack, J. Aichelin, and N. Amelin, Prog. Part. Nucl. Phys. 42, 279 (1998).
- (57) L. V. Bravina et al., J. Phys. G 25, 351 (1999); L. V. Bravina et al., Phys. Rev. C 62, 064906 (2000).
- (58) A. B. Larionov, W. Cassing, S. Leopold, and U. Mosel, Nucl. Phys. A 696, 747 (2001).
- (59) H. Liu et al. (E895 Collaboration), Phys. Rev. Lett. 84, 5488 (2000).
- (60) J. Barrette et al. (E877 Collaboration), Phys. Lett. B485, 319 (2000).
- (61) I. N. Mishustin, V. N. Russkikh, and L. M. Satarov, Yad. Fiz. 48, 711 (1988) [Sov. J. Nucl. Phys. 48, 454 (1988)].
- (62) V. N. Russkikh, Yu. B. Ivanov, Yu. E. Pokrovsky, and P. A. Henning, Nucl. Phys. A572, 749 (1994).
- (63) I. N. Mishustin, V. N. Russkikh, and L. M. Satarov, Yad. Fiz. 54, 429 (1991) [Sov. J. Nucl. Phys. 54, 260 (1991)]
- (64) U. Katscher, D. H. Rischke, J. A. Maruhn, W. Greiner, I. N. Mishustin, and L. M. Satarov, Z. Phys. A346, 209 (1993).
- (65) J. Brachmann, A. Dumitru, J. A. Maruhn, H. Stöcker, W. Greiner, and D. H. Rischke, Nucl. Phys. A619, 391 (1997).
- (66) Y. B. Ivanov, Yad. Fiz. 46, 100 (1987) [Sov. J. Nucl. Phys. 46, 63 (1987).
- (67) Yu. B. Ivanov, Nucl. Phys. A474, 669 (1987).
- (68) V. M. Galitsky and I. N. Mishustin, Sov. J. Nucl. Phys. 29, 181 (1979).
- (69) A. S. Khvorostukhin, V. V. Skokov, K. Redlich, and V. D. Toneev, Eur. Phys. J. C48, 531 (2006).
- (70) Yu. B. Ivanov, Phys. Rev. C 87, 064904 (2013).
- (71) Yu. B. Ivanov, Phys. Rev. C 87, 064905 (2013).
- (72) Yu. B. Ivanov, Phys. Rev. C 89, 024903 (2014).
- (73) Yu. B. Ivanov, arXiv:1401.2265; Yu. B. Ivanov, Phys. Lett. B 723, 475 (2013).
- (74) Y. Cheng, Y.-L. Yan, D.-M. Zhou, X. Cai, B.-H. Sa, and L. P. Csernai, Phys. Rev. C 84, 034911 (2011).
- (75) V. Vovchenko, D. Anchishkin, and L. P. Csernai, Phys. Rev. C 88, 014901 (2013).
- (76) Y. Aoki et al., Phys. Lett. B 643, 46 (2006); S. Borsanyi et al., JHEP 1009, 073 (2010); JHEP 1011, 077 (2010); JHEP 1208, 126 (2012); Phys. Lett. B 730, 99 (2014).
- (77) M. Gazdzicki and M. I. Gorenstein, Acta Phys. Pol. B30, 2705 (1999).
- (78) M. Gazdzicki, M. Gorenstein and P. Seyboth, Acta Phys. Pol. B42, 307 (2011).