A solar type II radio burst from CME-coronal ray interaction: simultaneous radio and EUV imaging
Abstract
Simultaneous radio and extreme ultraviolet (EUV)/white-light imaging data are examined for a solar type II radio burst occurring on 2010 March 18 to deduce its source location. Using a bow-shock model, we reconstruct the 3-dimensional EUV wave front (presumably the type-II emitting shock) based on the imaging data of the two STEREO spacecraft. It is then combined with the Nançay radio imaging data to infer the 3-dimensional position of the type II source. It is found that the type II source coincides with the interface between the CME EUV wave front and a nearby coronal ray structure, providing evidence that the type II emission is physically related to the CME-ray interaction. This result, consistent with those of previous studies, is based on simultaneous radio and EUV imaging data for the first time.
1 Introduction
It has long been suspected that the interaction of a coronal mass ejection (CME) with nearby dense coronal structures like streamers or rays is important to solar type II radio bursts (e.g., Wild et al., 1963; Classen & Aurass, 2002; Reiner et al., 2003; Mancuso & Raymond, 2004; Cho et al., 2005). These coronal structures are featured by higher plasma density and lower bulk flow speed (in the magnetically-closed part of streamers) than that of the surrounding solar wind plasmas (e.g., Habbal et al., 1997; Strachan et al., 2002). Thus when a CME interacts with a nearby streamer or coronal ray, the associated disturbance may propagate into a region with much lower characteristic speed. This favors the formation or enhancement of coronal shock, as well as the consequent electron acceleration and type II excitation.
Previous studies along this line of reasoning were largely based on a combined analysis of coronagraph images and radio spectrograph data. For example, Reiner et al. (2003) suggested that the type IIs of their study originated from dense region of the corona, likely from streamers. Cho et al. (2007) determined the shock heights by combining the type II spectral data from Green Bank Solar Radio Burst Spectrometer (GBSRBS; White et al. (2006)) and the polarization Brightness (pB) data from the Mauna Loa Solar Observatory (MLSO) MK4 coronameter (Elmore et al., 2003), and compared them to the MK4 CME-front heights. They concluded that the type II burst was generated at the interface of the CME flank and the streamer. In a follow-up study, Cho et al. (2008) expanded the study to 19 events and found that nearly half of them were probably associated with CME-streamer interaction.
In a series of studies, Feng et al. (2012, 2013) and Kong et al. (2012) proposed a novel method to diagnose the type II sources by relating specific morphological features (e.g., bumps or breaks) of the dynamic spectra to imaging features (e.g., CME-driven shock propagating across a dense streamer). These studies confirmed that the CME-shock interaction with dense coronal structures like streamers is important to type II bursts. However, none of the studies was based on radioheliograph imaging data which provide the most direct evidence on the radio source location. This is due to the scarcity of simultaneous imaging in radio and white light/EUV wavebands. Nevertheless, existing studies have demonstrated the importance of combining these imaging observation as well as the spectral data in revealing the origin of metric type II bursts and their relationship with CME-driven shocks (e.g., Bastian et al., 2001; Maia et al., 2000; Dauphin et al., 2006; Bain et al., 2012; Zimovets et al., 2012; Carley et al., 2013). Along this line of observational endeavors, in this study we show a type II event with imaging data from both the Nançay radioheliograph (NRH; Kerdraon & Delouis (1997)) and instruments onboard the twin Solar TErrestrial RElations Observatory (STEREO; Kaiser et al. (2008)) and the Solar and Heliospheric Observatory (SOHO; Domingo et al. (1995)) spacecraft. This allows us to pinpoint the type II source location that is found to correspond to a CME-coronal ray interface.
2 Spectral and imaging observations of the type II burst on 2010 March 18
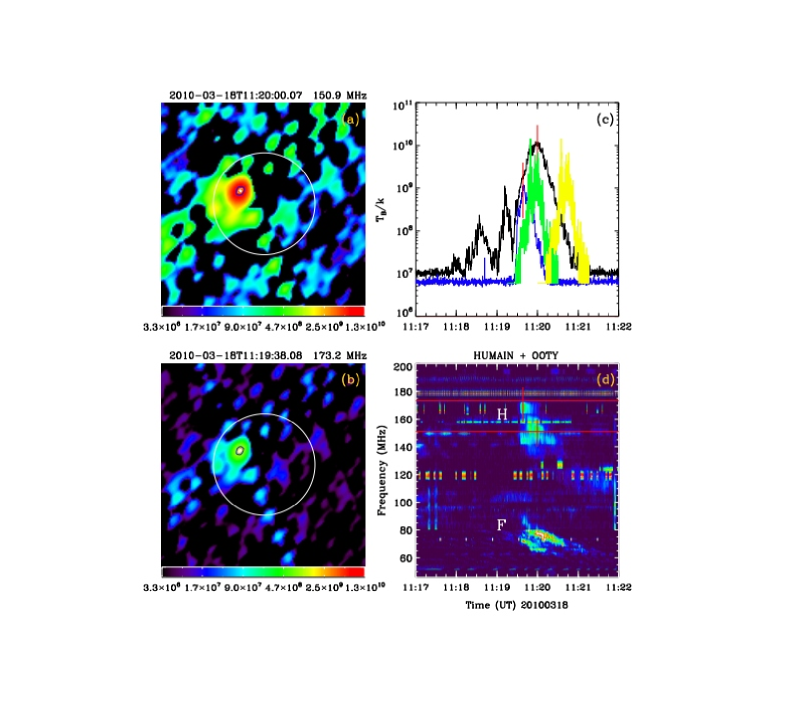
The type II burst was imaged by NRH at 173.2 and 150.9 MHz, also recorded by the Humain spectrograph from 45 - 80 MHz and 163 - 387 MHz and by OOTY (http://soleil.i4ds.ch /solarradio/) from 80 - 163 MHz, with a temporal resolution of 0.25 s. The spectral resolutions vary irregularly with frequencies. For the data below 80 MHz, the resolution varies from 0.06 to 1 MHz, and the higher frequency data have a resolution from 1 to 3 MHz. A combination of these data is shown in Figure 1. The contours in the NRH images represent the 80% (blue), 90% (orange), and 95% (white) of the corresponding intensity maximum.
The type II burst lasted for about 1.5 min from 11:19:30 to 11:21:00 UT. The start (end) frequency of the F branch is 80 (60) MHz on the lower band. This burst shows band-splitting feature on both the fundamental (F) and harmonic (H) branches (Smerd et al., 1974; Nelson & Melrose, 1985). The splitting width, i.e., the mean frequency ratio of the upper and lower bands, is estimated to be 1.17, and the average drift (F band) is 0.2 MHz s-1. Both are typical values in this frequency range (e.g., Vrnak et al., 2001).
The radio source centroid location at the two NRH frequencies can be told from Figures 1(a) and (b). Its uncertainty can be estimated with the 95% contour of the NRH flux intensity, as usually done in literature (see, e.g., Bain et al., 2012; Zimovets et al., 2012). According to the 150.9 MHz data, the position of the type II source is in a range of (y = -0.48 0.02, z=0.26 0.02) in units of solar radii (R⊙), expressed in the Heliocentric Earth Ecliptic (HEE) coordinate system with the x-axis pointing from the solar center towards the Earth, z perpendicular to the Earth orbital plane (positive north), and y completing the right-handed orthogonal triad. From panel (c), the radio flux at 173.2 MHz (blue) increased rapidly to a brightness temperature (TB) of 109 K within seconds. From the accompanying animation, at 150.9 MHz and 11:18:30 UT there appeared a bright emission with = 108 K in the same position, indicating that the burst may start as early as 11:18:30 UT. However, no corresponding spectral feature was found due to the lower sensitivity of spectrographs than NRH.
The type II sources observed by NRH at 150.9 MHz (11:20:00 UT) and 173.2 MHz (11:19:38 UT) were close to each other since the uncertainty of the radio source centroid measurement ( R⊙) is considerably larger than the projected moving distance of the radio source within 20 seconds (see next section for a wave speed measurement). It is therefore not possible to deduce the shock speed using available NRH data.
3 EUV/white-light data of the solar eruption
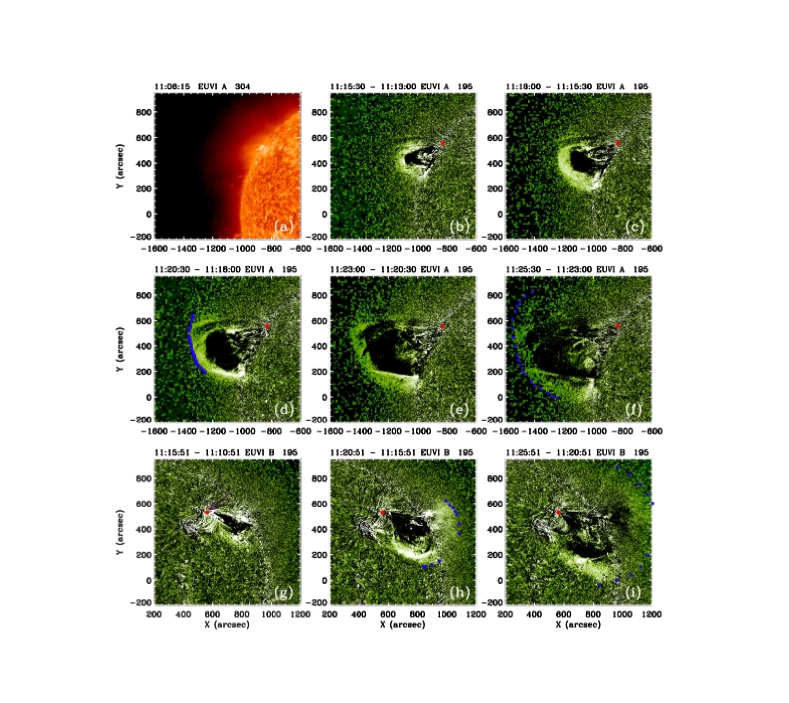
As observed by Extreme Ultraviolet Imaging Telescope (EIT; Delaboudinire et al., 1995)/SOHO and the Extreme Ultraviolet Imager(EUVI; Wuelser et al., 2004) /STEREO, the type II burst was associated with a filament eruption, a CME, and a weak B5 X-ray flare from a small active region (AR) at N23E22, which is northwest of the NOAA AR11056 (N18E20). The flare start, peaking and end times were 11:09, 11:15, and 11:18 UT, respectively, according to the online GOES-SXR data ).
In Figure 2(a), we show the overall configuration of the spacecraft. STEREO-A (SA) was 66∘ ahead and STEREO-B (SB) 71∘ behind the earth. The CME source was at N23E22 in the SOHO field of view (FOV), while in the SB (SA) FOV it was at N27W49 (N28E88). Therefore, the CME was basically observed by SA as a limb event. In Figure 2(b) we show the EIT difference image and the NRH intensity contours (taken from Figure 1(a)). It can be seen that the NRH radio source lagged behind the southern-eastern part of the EIT-EUV front, mainly due to the projection effect and the fact that the EIT data were obtained 4 min later. In the following section, the 3-d reconstruction of the EUV wave fronts will be extrapolated to the times of the EIT and NRH data for a direct comparison. The type II source seems to be close to the SA solar limb (the red dashed line in Figure 2(b)), as will be confirmed by further analysis.
From the EUVI 195 Å RDIs shown in Figure 2 and the online animation, the CME EUV front swept through a nearby ray along the southern part. The front appeared at a time as early as 11:05:30 UT, propagated to a distance of 1.14 R⊙ from the solar center at a time (11:10:51 UT) close to the flare onset, and reached 1.25 R⊙ at 11:13:00 UT near the flare peak. In addition, from the EUVI-A 304 Å data shown in Figure 3(a), an associated filament eruption was observed at 11:06:15 UT. These indicate that the EUV wave was driven by the CME, rather than by the flare.
The ray that was swept by the CME front is relatively bright and thus dense (see the yellow arrows in Figure 2). It is connected to the bright loop complex as seen from SB and to a cusp-like structure from SA. These features are similar to those of typical streamers observed by coronagraphs, yet with a low cusp. Upon the CME impact, the ray was strongly deflected, its brightness increased and width decreased consequently.
Further details of the interaction can be seen from the running difference images (RDIs) shown in Figure 3(b-i) and the accompanying animation. The bright front along the southern part of the eruption can be clearly recognized. We delineated four of these fronts using blue solid circles, which is of further usage in the Appendix for shock reconstruction. The average propagation speed of the SA EUV front is 465 km s-1, on which the projection effect is not serious since the event is a limb one in the SA FOV.
Consistent with Figure 2, the expanding front swept through the upper part of the ray in the 5-min interval from 11:15 to 11:20 UT. The deflected ray, as well as the interaction interface, can be clearly seen by SA. As early as 11:18 UT, the CME front may have already touched the lower northern part of the ray. The deflection is clearly manifested as a bright structure enclosed by the CME front in RDIs of Figures 3(d) to 3(f). This suggests that the expanding CME has passed by the lower part of the ray at the corresponding moment, indicating that the CME front is not the ejecta itself. Rather, it has the nature of a fast magnetosonic wave or a fast shock that can propagate across magnetic structures. At the time after panel (i), the CME front became diffusive and hardly recognizable.
We emphasize that the EUVI images were recorded at 11:20:30 UT from SA and 11:20:51 UT from SB. At both times, the NRH images of the type II burst at 150.9 MHz were also available. These simultaneous imaging at the EUV and radio wavelengths from different vantage points are critical to our study, as shown in the following section.
4 Origin of the type II radio burst
Although the EUV front presents a fast-mode nature, its relation with the type-II emitting shock is a question of intensive studies (e.g., Biesecker et al. 2002; Klassen et al. 2000; Pohjolainen et al. 2001; Khan & Aurass, 2002; Vrsnak et al. 2006). These studies provide important insights into the physical relation between the type-II emitting shock and the EUV front. Based on these studies, the demonstrated wave nature of the front, the observed deflection of the coronal ray, as well as the fact that the EUV front outlines the outermost envelope of the CME, we presume that the EUV front corresponds to the type-II-emitting shock (see also Ontiveros & Vourlidas, 2009). With this assumption, we reconstruct the 3-d surface of the EUV fronts based on the nearly-simultaneous data of the two STEREO spacecraft. The details of the method are presented in the Appendix. The reconstructions are used to establish the physical relationship between the type II burst and the CME interaction with the nearby ray structure.
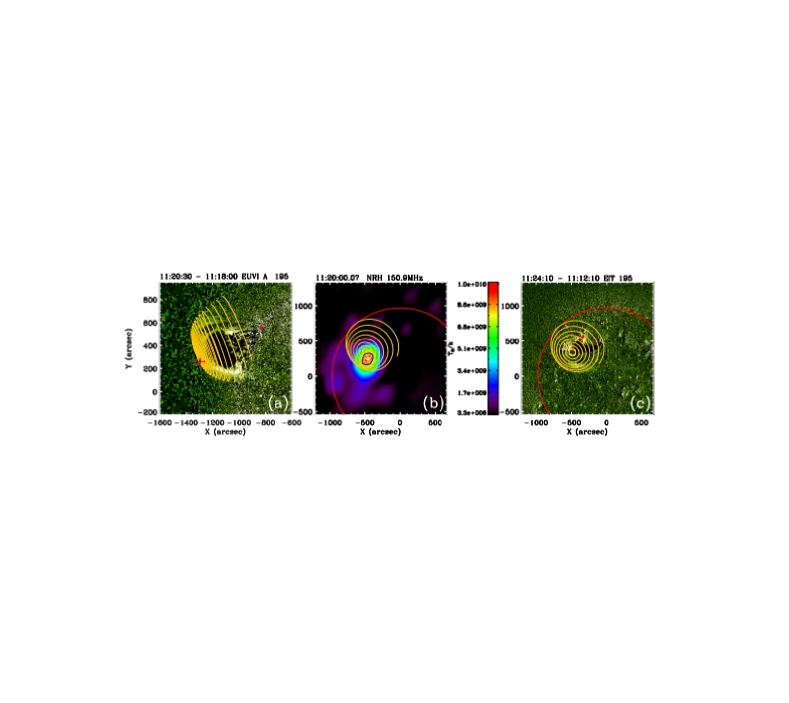
Given the successful reconstruction of the 3-d shock surface (see the Appendix) and the knowledge of the NRH type II source, it is straightforward to determine the 3-d coordinates of the type II source. In Section 2, we obtained that the NRH radio source is located at y = -0.48 0.02 R⊙, z = 0.26 0.02 R⊙ at 11:20:30 UT, the corresponding x coordinate on the 3-d shock surface can then be deduced to be x = 1.20 0.03 R⊙. Please see the Appendix for an estimate of the error contributed by the reconstruction.
SA is 66∘ to the west of the Earth, after a rotation we get the type II source location viewed in its FOV: = 0.04 0.03, = -1.29 0.03, and = 0.26 0.02 (R⊙). The errors consist contributions from both NRH imaging data and the reconstruction (see the Appendix for details). Since and are both significantly larger than , the type II source was very close to the solar limb of SA, as expected earlier. In Figure 4(a), this source is plotted on the simultaneous EUVI-A image. The obtained profile of the 3-d shock is also shown as yellow curves.
It is found that the type II source lay right on top of the deflected bright streamer structure, i.e., basically coincide with the CME interface with the ray. The collocation of the type II source and the CME-streamer interface is a strong evidence supporting that the type II is physically related to the CME-ray interacting process.
To make a direct comparison between the NRH and EIT data which were obtained at 11:20:00 and 11:24:10 UT, respectively, we extrapolate the reconstruction result at 11:20:30 UT to the above times. These extrapolated bow shock profiles are superposed onto the corresponding NRH and EIT images in Figures 4 (b) and (c). We see that the type II source is located at the southern part of the shock front, the radio source centroid is 100 arcsecs away from the shock nose, and the reconstructed shock front using the STEREO data basically envelopes the visible part of the EIT wave front.
5 Conclusions and discussion
In this paper we show evidence supporting that the type II solar radio burst occurring on 2010 March 18 was originated from the interaction between a CME and a nearby dense coronal ray structure. This is based on simultaneous radio and EUV imaging data recorded at different vantage points. The NRH data were used to constrain the projected type II source location in the Earth FOV, and the multi-vantage point EUV data were used to reconstruct the 3-d profile of the EUV front (presumably the type-II emitting shock). We find that the type II source lay closely to the CME-ray intersection region. This study demonstrates the importance of CME interaction with dense coronal structures (like rays or streamers) to metric type IIs.
The suspect that CME-streamer interactions may be important to metric type IIs (e.g. Wild et al., 1963; Classen & Aurass, 2002; Reiner et al., 2003; Mancuso & Raymond, 2004; Cho et al., 2005) stems from following considerations. Firstly, the CME-related disturbance may frequently run into a nearby density structure along the CME flank due to its lateral expansion. This interaction region likely corresponds to a quasi-perpendicular shock geometry, if a shock exists. Shocks of such geometry have been predicted to account for efficient electron acceleration (Holman et al., 1983; Wu, 1984). Secondly, it is expected that when a CME disturbance propagates into a dense coronal structure with low Alfvénic speed, the disturbance may steepen into a shock, or a preexisting shock may get enhanced in strength, also favoring electron acceleration. Thirdly, it is suggested that the closed field topology within the streamer, when swept by an outward-propagating shock, may give rise to a collapsing magnetic trap configuration (Baker et al., 1987; Zlobec et al., 1993; Somov & Kosugi, 1997; Chen, 2013), within which electrons are trapped by the upstream field lines, and may return to the shock and be accelerated repeatedly. This also favors the generation of energetic electrons. While we do not consider the exact electron acceleration process in this word, our study is consistent with the above scenarios.
Appendix A A bow reconstruction of the 3-d shock surface: method and result
We assume the CME shock can be approximated by a symmetrical 3-d bow-shock geometry (see Ontiveros, V. & Vourlidas (2009)). The bow shock is given by (Smith et al. (2003), see also bowshock_cloud.pro in Solar Software),
where determines the shock apex height from the CME start point (S for short), controls the bluntness of the shock surface, and describes how wide the shock shape is. The equation is given in a local Cartesian coordinate system with S taken to be the origin, the bow symmetrical axis is along Z pointing from S to the bow apex (A), and X and Y define the plane perpendicular to Z. The above parameters define the shape and height (measured from S) of the bow. The bow axis, when measured in the Earth Ecliptic spherical coordinate system, is further constrained by other two pairs of angular parameters. The first pair gives the co-latitude and longitude of S, and the other pair of co-latitude and longitude gives its pointing direction.
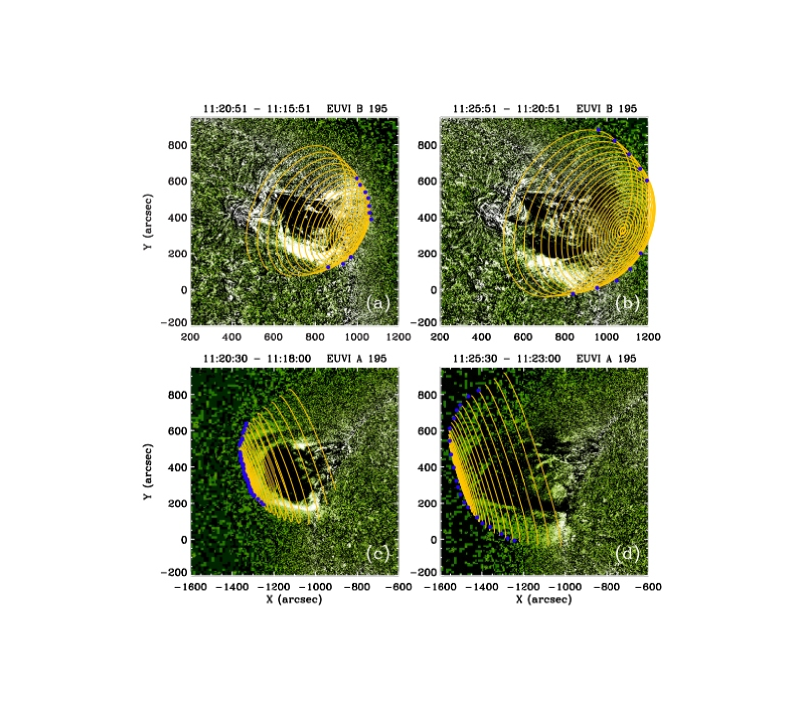
We first measure the shock front locations from EUVI images. More measurements on the SA data are used since in SA the CME is more clear and at the limb. The best-fit solution was deduced by minimizing the standard deviation of the measurements and the reconstructed shock front locations. This is done for the EUV data at 11:20:30 and 11:25:30 UT for SA and 11:20:51 and 11:25:51 UT for SB. The influence of the SA-SB time difference (21 s) is reduced by extrapolating the SB measurements slightly backwards by a distance of 1.3 10-2 R⊙, which is given by measuring the average EUV-front speed in SB FOV (450 km s-1). The extrapolated measurements are used for reconstructions. The bows thus obtained are superposed onto the original EUV images in Figure 5, where the bows for SB have been extrapolated outwards to account for the 21 s time difference. We see that the above technique provides a nice fitting to the EUV fronts observed by both STEREO spacecraft.
To estimate the associated error on the radio source location, we first conduct reconstructions for 10 independent measurements of the EUV wave fronts, and deduce a distribution of the x coordinate of the type-II source. The resulting 1- spread of x is 0.01 R⊙, taken to be the error of the reconstruction. Taking this into account, the total error of the x coordinate becomes 0.03 R⊙ in the NRH FOV, and that of the x and y coordinates become 0.03 R⊙ in the SA FOV.
References
- Baker et al. (1987) Baker, D. N., Anderson, R. C., Zwickl, R. D. & Slavin, J. A. 1987, JGR, 92, 71
- Bastian et al. (2001) Bastian, T. S., Pick, M., Kerdraon, A., Maia, D. & Vourlidas, A. 2001, ApJ, 558, L65
- Bain et al. (2012) Bain, H. M., Krucker, S., Glesener, L. & Lin, R. P. 2012, ApJ, 750, 44
- Carley et al. (2013) Carkey, E. P.,Long, D. M., Pyrne, J. P., et al. Nature Physics, 9, 811, 16
- Chen (2013) Chen, Y. 2013, Chin Sci Bull, 58, 1599
- Cho et al. (2005) Cho, K. S., Moon, Y.-J., Dryer, M., et al. 2005, JGR, 110, A12101
- Cho et al. (2007) Cho, K. S., Lee, J., Moon, Y. J., et al. 2007, A&A, 461, 1121
- Cho et al. (2008) Cho, K. S., Bong, S. C., Kim, Y. H., et al. 2008, A&A, 491, 873
- Classen & Aurass (2002) Classen, H. T. & Aurass, H. 2002, A&A, 384, 1098
- Dauphin et al. (2006) Dauphin, C., Vilmer, N. & Krucker, S. 2006, A&A, 455, 339
- Delaboudinire et al. (1995) Delaboudinire, J.-P., Artzner, G. E., Brunaud, J., et al.1995, Sol. Phys., 162, 291
- Domingo et al. (1995) Domingo, V., Fleck, B. & Poland, A. I. 1995, SoPh, 162, 1
- Elmore et al. (2003) Elmore, D. F., Burkepile, J. T., Darnell, J. A., Lecinski, A. R. & Stanger, A. L. 2003, Proc. SPIE, 4843
- Feng et al. (2012) Feng, S. W., Chen, Y., Kong, X. L., et al. 2012, ApJ, 753, 21
- Feng et al. (2013) Feng, S. W., Chen, Y., Kong, X. L., et al. 2013, ApJ, 767, 29
- Habbal et al. (1997) Habbal, S. R., Woo, R., Fineschi, S., O’Neal, R., Kohl, J., Noci, G. & Korendyke, C. 1997, ApJ, 489, L103
- Holman et al. (1983) Holman, G. D. & Pesses, M. E. 1983, ApJ, 267, 837
- Kaiser et al. (2008) Kaiser, M. L., Kucera, T. A., Davila, J. M., et al. 2008, SSRv, 136, 5
- Kerdraon & Delouis (1997) Kerdraon, A. & Delouis, J.-M. 1997, in Lecture Notes in Physics, Berlin Springer Verlag, Vol. 483, Coronal Physics from Radio and Space Observations, ed.G. Trottet, 192
- Kong et al. (2012) Kong, X. L., Chen, Y., Li, G., et al. 2012, ApJ, 750, 158
- Maia et al. (2000) Maia, D., Pick, M., Vourlidas, A. & Howard, R. 2000, ApJ, 528, 49
- Mancuso & Raymond (2004) Mancuso, S. & Raymond, J. C. 2004, A&A, 413, 363
- Nelson & Melrose (1985) Nelson, G. S. & Melrose, D. B. 1985, in Solar Radiophysics, ed. D. J. McLean & N. R. Labrum (Cambridge: Cambridge Univ. Press), 333
- Ontiveros, V. & Vourlidas (2009) Ontiveros, V. & Vourlidas, A. 2009, ApJ, 693, 267
- Reiner et al. (2003) Reiner, M. J., Vourlidas, A., Cyr, O. C. St., et al. 2003, ApJ, 590, 533
- Strachan et al. (2002) Strachan, L., Suleiman, R., Panasyuk, A. V., Biesecker, D. A. & Kohl, J. L. 2002, ApJ, 571, 1008
- Somov & Kosugi (1997) Somov, Boris V. & Kosugi, Takeo, 1997, ApJ, 485, 859
- Smerd et al. (1974) Smerd, S. F., Sheridan, K. V. & Stewart, R. T. 1974, in IAU Symp. 57, Coronal Disturbances, ed. G. A. Newkirk (Dordrecht: Reidel), 389
- Smith et al. (2003) Smith, M. D., Khanzadyan, T. & Davis, C. J. 2003, MNRAS, 339, 52
- Vrnak et al. (2001) Vrnak, B., Aurass, H., Magdaleni, J. & Gopalswamy, N. 2001, A&A, 377, 321
- White et al. (2006) White, S. M., Bastian, T. S., Bradley, R., Parashare, C. & Wye, L. 2006, in ASP Conf. Ser. 345, From Clark Lake to the Long Wavelength Array: Bill Erickson’s Radio Science, ed. N Kassim et al. (San Francisco: ASP), 176
- Wild et al. (1963) Wild, J. P., Smerd, S. F. & Weiss, A. A. 1963, ARA&A, 1, 291
- Wu (1984) Wu, C. S. 1984, JGR, 89, 8857
- Wuelser et al. (2004) Wuelser, J.-P., Lemen, J. R., Tarbell, T. D., et al. 2004, Proc. SPIE, 5171, 111
- Zimovets et al. (2012) Zimovets, I., Vilmer, N., Chian, A. C.-L., et al. 2012, A&A, 547, 6
- Zlobec et al. (1993) Zlobec, P., Messerotti, M., Karlicky, M. & Urbarz, H. 1993, Sol. Phys., 144, 373