Bending and Breathing Modes of the Galactic Disk
Abstract
We explore the hypothesis that a passing satellite or dark matter subhalo has excited coherent oscillations of the Milky Way’s stellar disk in the direction perpendicular to the Galactic midplane. This work is motivated by recent observations of spatially dependent bulk vertical motions within kpc of the Sun. A satellite can transfer a fraction of its orbital energy to the disk stars as it plunges through the Galactic midplane thereby heating and thickening the disk. Bulk motions arise during the early stages of such an event when the disk is still in an unrelaxed state. We present simple toy-model calculations and simulations of disk-satellite interactions, which show that the response of the disk depends on the relative velocity of the satellite. When the component of the satellite’s velocity perpendicular to the disk is small compared with that of the stars, the perturbation is predominantly a bending mode. Conversely, breathing and higher order modes are excited when the vertical velocity of the satellite is larger than that of the stars. We argue that the compression and rarefaction motions seen in three different surveys are in fact breathing mode perturbations of the Galactic disk.
keywords:
Galaxy: kinematics and dynamics - Galaxy: solar neighbourhood - Galaxy: structure1 INTRODUCTION
Recently, three independent surveys of stellar kinematics within of the Sun detected spatially dependent bulk motions in the direction perpendicular to the Galactic plane (Widrow et al., 2012; Williams et al., 2013; Carlin et al., 2013). Widrow et al. (2012) found that the bulk motions of stars, when plotted as a function of position relative to the Galactic midplane, have characteristics of a breathing mode perturbation with a velocity gradient of . This result was based on a sample of 11K main sequence stars from the Sloan Extension for Galactic Understanding and Exploration (SEGUE) survey, which focused on intermediate latitudes above and below the Galactic midplane and Galactic longitudes in the range (Yanny et al., 2009). Williams et al. (2013) used a sample of 72K red-clump stars from the Radial Velocity Experiment (RAVE) survey (Steinmetz et al., 2006) to map out bulk motions as a function of Galactocentric radius and and found evidence for compressional motion outside the solar circle and rarefaction inside with peak vertical bulk velocities of . Carlin et al. (2013) found similar features in their analysis of 400K F-type stars with proper motions from the PPMXL catalog (Roeser et al., 2010) and spectroscopic radial velocities from the LAMOST/LEGUE survey (Cui et al., 2012; Zhao et al., 2012). As stressed by Carlin et al. (2013), the three surveys look in different parts of the extended solar neighborhood and consider different spatial projections of the data.
Widrow et al. (2012) also found a North-South asymmetry in the number counts when plotted against . The number count asymmetry was confirmed by Yanny & Gardner (2013) who carried out a careful analysis of the uncertainties and potential systematic effects. The number counts show a 10% (North - South)/(North + South) deficit at and an excess of about the same magnitude at .
It is possible that the North-South asymmetries in number counts and bulk vertical motions are the result of stellar debris from a tidally disrupted satellite galaxy that is mixing in with the disk stars. Widrow et al. (2012) considered an alternative hypothesis in which the North-South asymmetries arise from coherent oscillations of the disk itself, which were excited by a passing satellite or dark matter subhalo. Eventually, the oscillations die away due to phase mixing and Landau damping. The disk settles into a new equilibrium state, albeit one with a higher velocity dispersion. Thus, the bulk motions seen in the data may indicate an early phase of a disk heating event. The aim of this paper is to explore this hypothesis in more detail through toy model calculations and numerical simulations.
A similar question was posed by Minchev et al. (2009) in the context of the stellar velocity distribution in the solar neighborhood. Detailed analyses of Hipparcos data (Chereul et al., 1998; Dehnen, 1998; Chereul et al., 1999; Nordström et al., 2004) have revealed rich substructure in the local velocity distribution. There are classical moving groups, which are thought to be the stellar streams from dissolved star clusters (see Eggen (1996) and references therein). Velocity-space features may arise from dynamical effects of the bar (Dehnen, 2000) or spiral structure (De Simone et al., 2004; Quillen & Minchev, 2005; Chakrabarty, 2007) or they may be due to streams of stars that were tidally stripped from accreted satellite galaxies (Navarro et al., 2004; Helmi et al., 2006). Minchev et al. (2009) consider a different scenario in which the “energy kick” from a passing satellite leaves ripples in the (disk-plane) velocity distribution of stars. Their conjecture is that velocity-space substructure in the solar neighborhood is a manifestation of these ripples.
Satellites, dark matter subhalos, and globular clusters for that matter, have long been recognized as possible culprits of disk heating and thickening. In general, a massive object that passes through the disk will transfer a fraction of its orbital energy to the disk stars (Lacey & Ostriker, 1985; Toth & Ostriker, 1992; Sellwood et al., 1998). Satellite interactions can also cause the disk to spread out radially and develop warps and flares (Quinn & Goodman, 1986; Quinn et al., 1993; Walker et al., 1996; Velazquez & White, 1999)
Satellite encounters can excite various modes in the disk such as bending modes and breathing modes (Toomre, 1966; Araki, 1985; Mathur, 1990; Weinberg, 1991). It is the latter that corresponds most closely to the velocity perturbations seen in the SEGUE, RAVE, and LAMOST surveys. We will show that a bending mode perturbation arises when the satellite’s vertical velocity is less than that of the disk stars while breathing and higher-order modes are excited when the vertical velocity of the satellite exceeds that of the stars.
Satellites and subhalos can also excite spiral structure and bars in stellar disks. (See Sellwood (2013) for a recent review of the stellar dynamics of disk galaxies.) The seminal work of Toomre & Toomre (1972) showed that the tidal interaction between a stellar disk and a companion galaxy of comparable mass can generate grand design spiral structure similar to what is seen in M51. Alternatively, multi-armed and flocculent spiral structure can arise from the continual interactions between the disk and a system of satellite galaxies and dark matter subhalos. Cosmological simulations of structure formation in a CDM universe suggest that the halos of Milky Way size galaxies harbour a wealth of substructure in the form of subhalos (Klypin et al., 1999; Moore et al., 1999; Gao et al., 2004). These results motivated Gauthier et al. (2006) and Dubinski et al. (2008) to explore satellite-disk interactions for an M31-like galaxy. For their particular M31 model, when the halo is smooth the disk remains stable against bar formation for 10 Gyr and relatively weak spiral structure develops, presumably seeded by the shot noise of the N-body realization. Conversely, when of the halo mass initially resides in compact subhalos, the disk develops prominent spiral features and forms a strong bar. Similar results were found in a series of simulations by Kazantzidis et al. (2008).
More recently, Purcell et al. (2011) considered a model Milky Way disk that was perturbed by a single satellite galaxy. The prototype for their perturber was the Sagittarius dwarf spheroidal galaxy (Ibata et al., 1994, 1997), which is believed to have survived several orbits about the Galaxy. In the Purcell et al. (2011) simulations spiral structure emerges that is similar to the spiral structure observed in the Milky Way. Gómez et al. (2013) reanalysed these simulations and found that vertical perturbations in the number density of disk particles at roughly the Sun’s position from the Galaxy’s center were also generated and qualitatively similar to those seen in Widrow et al. (2012) and Yanny & Gardner (2013).
It is not at all surprising that a Sagittarius-like dwarf produces vertical oscillations similar to what is found in the data. The solar neighborhood is characterized by a circular speed about the Galactic center of (see, for example, Bovy et al. (2012c) and references therein) and a stellar surface density of (see, for example, Holmberg & Flynn (2004)). Stars in the disk have vertical velocities in the range of (Robin et al., 2003; Bovy et al., 2012a). A satellite with a comparable surface density to that of the solar neighborhood, with an orbit that is matched to the local standard of rest (LSR), and with a vertical velocity through the midplane in resonance with the vertical motions of disk stars will produce the strongest perturbations.
In Section 2, we review earlier discussions of disk heating and thickening and then present a simple toy-model calculation for the excitation of bending and breathing modes. In Section 3, we present results from one-dimensional N-body simulations that support the toy-model calculation and also illustrate the potentially long-lived nature of the oscillations. We provide preliminary results from fully self-consistent 3D N-body simulations of satellite-disk encounters in Section 4. Finally, we summarize our results and give concluding remarks in Section 5.
2 BENDING AND BREATHING MODES
This section focuses on the physics of bending and breathing mode perturbations of a stellar disk. We begin with a heuristic discussion that makes contact with the previous work of disk heating and thickening.
2.1 Free-particle approximation
In an early paper on disk heating, Toth & Ostriker (1992) calculated the transfer of energy to a stellar disk from a passing satellite by treating the disk stars as free particles that are scattered in the Keplerian potential of the satellite. The satellite loses energy via dynamical friction (Chandrasekhar, 1943) and it is this energy that heats the disk.
Consider a satellite of mass that passes through the disk with speed at an angle relative to the disk normal as measured in the LSR. For illustrative purposes, we focus on stars initially in the plane that contains the satellite’s orbit and the disk normal. Following Toth & Ostriker (1992), we ignore the random motion of the stars with respect to the LSR. The impact parameter for a star-satellite scattering event is where the is the position of the star relative to the point at which the satellite passes through the Galactic midplane. The change in the vertical component of the star’s velocity is then
| (1) |
where is the impact parameter that leads to scattering by . Note that
| (2) |
As a measure of bending and breathing mode perturbations we define
| (3) |
and
| (4) |
In the small and large impact parameter limits we have
| (5) |
and
| (6) |
Thus, both breathing and bending modes are excited by a passing satellite.
2.2 Resonant interaction
The previous calculations ignore the epicyclic motions of stars in the vertical direction. Stars near the Galactic midplane, where the gravitational potential is approximately quadratic in the vertical direction, oscillate about the midplane with frequency
| (7) |
Stars whose orbits take them further from the midplane oscillate with a frequency . Sellwood et al. (1998) calculated the change in vertical energy of a star due to the tidal field from the passing satellite in the impulse approximation (see also Spitzer (1958)). They averaged over satellite directions and found
| (8) |
where , is the characteristic vertical energy for stars in the disk, and the function is unity for and is exponentially small for .
By focusing on the tidal field, Sellwood et al. (1998) pick out the breathing and higher order modes. When the satellite velocity is high, as in the free-particle approximation (Eq.6 with ). On the other hand, if the time scale for a satellite to pass through the disk is long as compared to , then the interaction between the satellite and star will be adiabatic and the energy transfer will be exponentially small. The energy transfer peaks when (see Figure 1 of Sellwood et al. (1998)), that is, when the satellite is in resonance with the stellar orbit.
Note that the above equations ignore the finite size of the satellite in calculating the stellar orbits. The perturbing force due to a real satellite will be softened inside a characteristic scale radius . In general where is the central velocity dispersion of the satellite and is a constant of order unity. Then . With a softened perturber, for whereas for a point mass perturber, is nonzero and constant for , as in Eq. 5.
2.3 Energy transfer to disk stars
The change in vertical energy of a star due to a perturbing vertical force is
| (9) |
In both Toth & Ostriker (1992) and Sellwood et al. (1998), the change in vertical energy of a star is approximated as . In other words, they assume that in Eq. 9 is generated entirely by . The function introduced by Sellwood et al. (1998) is a crude way of accounting for the orbital motion. If the time scale for the satellite to pass through the disk is long as compared to the orbital period, then the integral on the right hand side of Eq. 9 approaches zero.
Our interest here is in the details of the vertical perturbations that are excited by a passing satellite; what modes are excited by a passing satellite and what is their subsequent evolution? In the sections that follow, we address these questions numerically. Here, we discuss the excitation of vertical perturbations under the assumption that the perturbations are small. We can then approximate Eq. 9 by substituting the unperturbed orbit for for inside the integral. This prescription resembles the Born approximation that is used to calculate scattering amplitudes in quantum mechanics.
The isothermal plane (Spitzer, 1942; Camm, 1950) provides a simple equilibrium model for the vertical phase space structure of a stellar disk. In this model, the distribution function (DF) is
| (10) |
where is the vertical energy and is the velocity dispersion in the vertical direction. The density and potential are given by
| (11) |
and
| (12) |
where is the density at the midplane and . Stars with execute simple harmonic motion about the midplane with a maximum excursion of and a period that is approximately independent of . On the other hand, for stars with , we have and . In what follows, we set and to unity and so that and .
It is useful to introduce the orbital phase angle , which is related to time by the expression . In Figure 1, we follow the vertical motions of two stars that have the same but whose phase angles differ by . A satellite with speed greater than the maximum speed of the stars passes through the disk at . The upper two panels show the vertical position and velocity respectively. The third panel shows the tidal force of the satellite on the star, that is, the force of the satellite on the star minus the force of the satellite on a star at . Note that we’ve softened the force law with . The fourth panel shows the change in vertical energy of the star,
| (13) |
Evidently, both stars gain energy. Likewise, two stars whose phase angles differ from these two stars by will lose energy. The predominant perturbation in this case is a breathing mode.

Figure 2 follows two stars that interact with a satellite whose speed is less than their maximum speed. Once again, the two stars differ in phase angle by . However, in this case, one star gains energy while the other loses energy. The perturbation in this case is predominantly a bending mode.

To further study the nature of the perturbation, we consider the Fourier transform of :
| (14) |
and the corresponding inverse transform
| (15) |
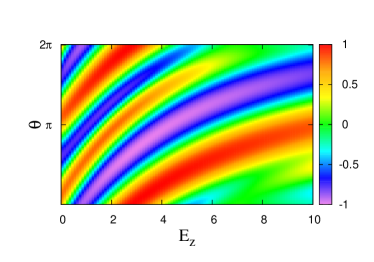
The term corresponds to a bending mode perturbation while the term corresponds to the breathing mode. In Figure 3 we show the fractional change in energy, , as a function of and for . We see that for , where the characteristic orbital speed of the stars is less than the speed of the satellite, has a pattern characteristic of a breathing mode (i.e., strong pattern in as a function of at fixed energy). For , the pattern for is that of a bending mode ( pattern).
For stars of energy the power in the mode of the perturbation is
| (16) |
where, by Parseval’s theorem, the total power is
| (17) |
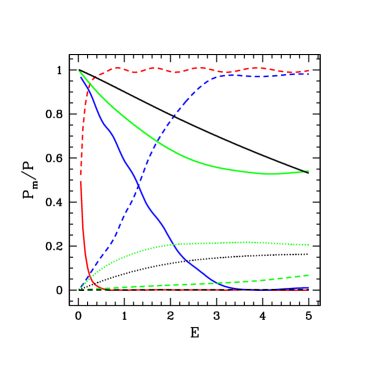
In Figure 4, we plot the normalized power as a function of for various choices of and . For our choice of constants, a star with has a maximum orbital speed of . We see that for a slow moving satellite (), the perturbation is almost entirely a bending mode for . On the other hand, for a fast moving satellite ( or ), breathing and higher-order modes are excited, especially for low-energy stars.
2.4 Toward a realistic model
The results presented in the previous figures are for a dimensionless version of the single-component self-gravitating isothermal plane. By contrast, the stellar disk of the Milky Way is better described by multiple components and the Galactic potential has contributions from the bulge and dark halo as well as the disk.
To make contact with the actual Milky Way, we consider several observationally motivated models. Kuijken & Gilmore (1989) modeled the DF of stars and the vertical potential in the extended solar neighborhood based on a survey of K dwarfs toward the south Galactic pole. They chose the following parametric form for the potential:
| (18) |
The first term on the right hand side is meant to account for the disk’s contribution to the potential where is the effective thickness of the disk and is proportional to the disk’s surface density. The second term is meant to account for the halo where is proportional to the effective halo density in the solar neighborhood. Kuijken & Gilmore (1989) fixed to be and imposed the constraint
| (19) |
to be consistent with observations of the Galactic rotation curve. They found
| (20) |
and therefore
| (21) |
| Model | D (pc) | |||
|---|---|---|---|---|
| KG | 180 | |||
| Besançon | 320 | 33 | 0.019 | 6.1 |
| WPD | 540 | 58 | 0.006 | 5.6 |
The Besançon model (Robin et al., 2003), which is one of the most widely cited models of the Milky Way, provides a self-consistent description of the Galactic potential and stellar populations for the Milky Way based on star counts and the rotation curve. The model is presented as a set of density-laws for the (multi-component) thin disk, the thick disk, the bulge, the stellar halo, and the dark halo. From these results, it is straightforward to extract the vertical potential in the solar neighborhood.
Apart from the physical interpretation ascribed by Kuijken & Gilmore (1989), Eq.18 provides a convenient parametric form for the vertical potential in part because the inverse is analytic. With the parameters given in Table 1, Eq. 18 provides an excellent fit to for the Besançon model in the range .
Widrow et al. (2008) presented a set of twenty-five disk-bulge-halo models for the Milky Way designed to fit observational data for the rotation curve and local kinematics. Each model is represented by self-consistent expressions for the DF and density of the three components as well as the total gravitational potential. The models are characterized by their susceptibility to bar and spiral instabilities. Here, we consider the most stable model (Toomre parameter , global stability parameter ) and again fit the vertical potential at to Eq. 18.
The vertical potential and force for the three models are shown in Figure 5. Figure 6 shows the mean speed and maximum excursion in for the three models considered here as well as the DF for the Besançon model. Consider, for example, stars that have . These stars have a mean speed of about with the thick and thin disks making similar contributions to the total stellar DF.


3 EVOLUTION OF VERTICAL OSCILLATIONS
The mode decomposition scheme described above provides a useful starting point for understanding the evolution of perturbations in a stellar disk. Bending, breathing, and higher order modes are collective excitations (Araki, 1985; Sellwood et al., 1998; Mathur, 1990; Weinberg, 1991), which can lose energy via Landau damping and dynamical friction with the halo. Phase mixing also effects the evolution of the modes and may lead to an effective damping of observables, which invariably involve a projection of the coarse-grained DF. Finally, the interaction region of the disk for a satellite encounter will be sheared by differential rotation. In what follows, we provide a brief discussion of these effects and then present one-dimensional numerical simulations of a satellite that interacts with a plane-symmetric disk.
3.1 Theoretical considerations
It is a well known result that perturbations in a homogeneous self-gravitating fluid with density and sound speed grow via the Jeans instability if the wave length of the perturbation is greater than the Jeans length . Perturbations whose wavelength is less than oscillate as sound waves with period (see for example Binney & Tremaine (2008)). In a homogeneous collisionless system with Maxwellian DF, the Jeans length is the same as for a fluid except that the sound speed is replaced by the velocity dispersion. However, perturbations with are strongly damped by a process known as Landau damping, which was first discussed in the context of plasma waves (Landau, 1946). (For an excellent pedagogical discussion, see Stix (1992)). Particles can draw energy from or feed energy to the collective mode. In the case of a spatially homogeneous Maxwellian DF, the net effect of the stars is to damp the wave on a time-scale comparable to the period of the oscillations (Lynden-Bell, 1962).
As stressed in Binney & Tremaine (2008) and elsewhere, Landau-damped waves are not true modes but rather the response of the system to a perturbation. True modes of the system would satisfy the collisionless Boltzmann and Poisson equations with a harmonic time-dependence for all times.
In the case when the unperturbed system is spatially homogeneous, one must resort to the Jeans swindle, which side-steps the fact that the unperturbed potential is ill-defined. For the isothermal plane, the existence of a self-consistent equilibrium solution (Eqs. 10-12) allows one to carry out a perturbation analysis without resorting to the Jeans swindle (Araki, 1985).
In principle, wavelike perturbations of the isothermal plane will also experience Landau damping, which occurs when there are particles in the distribution in resonance with the wave, i.e., whenever the frequency of the wave matches where is the orbital frequency of a star and is an integer. The orbital frequencies of stars in the isothermal plane range from to . Thus, the spectrum of orbits and their harmonics consist of semi-infinite overlapping segments where is a positive integer. For a mode of frequency , there will be a set of particles with that are in resonance with and therefore capable of Landau-damping, the mode.
Mathur (1990) and Weinberg (1991) showed that true modes, that is, modes that do not suffer Landau damping, exist for the truncated isothermal plane. In that model, the distribution function is given by
| (22) |
Orbital frequencies range from to where is the orbital frequency of a star with energy and is the frequency for a star with , that is, a star whose orbit stays near the midplane. The frequency spectrum for orbits has a gap from to , called the principal gap (Mathur (1990); Weinberg (1991)). If , then there will be a second gap between and , and so on. Weinberg (1991) showed that a mode exists for . This mode corresponds to a displacement of the system as a whole and corresponds to a bending mode. Once the system is embedded in an external potential, the frequency of the mode shifts to a non-zero value.
Weinberg (1991) analyzed the linearized collisionless Boltzmann and Poisson equations and showed that modes also exist in the higher frequency gaps and typically lie near the upper freqency end of the gap. Thus, for the first gap beyond the principal one, the frequency of the mode is less than but close to . That is, the coherent oscillations are near the resonance with particles at the upper edge of the energy distribution.
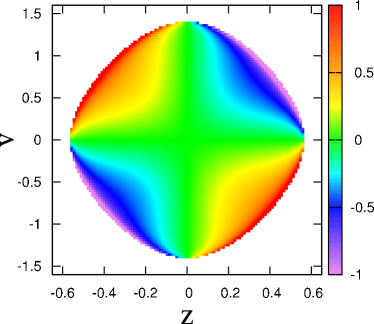
In Weinberg’s analysis, the phase space DF is written as the sum of the zeroth-order (equilibrium) solution and a linear perturbation. Figure 7 shows the phase space perturbation for the breathing model of a model. The perturbation rotates in the clockwise direction with a period given by the orbital period of stars near the energy cut-off, while the pattern is periodic with a frequency of . The phase shown in Figure 7 is consistent with a velocity perturbation similar to what is seen in the data. In the South () there are more stars with negative velocity than positive velocity. The situation is the reverse in the North. Figure 8 shows the bulk velocity perturbation (essentially, the first moment of the DF) for the phase shown in Figure 7 and for two other phases in the perturbation’s cycle. The magnitude of the perturbation has been adjusted to fit the data. We note that the slope of the bulk velocity profile increases as one moves away from the midplane.

As noted above, in the absence of an external potential, the bending mode for this one-dimensional model corresponds to a displacement of the system in position and velocity. In an actual stellar disk, there is a restoring force to a local vertical displacement due to the gravitational field from the rest of the disk. One can model this effect in the one-dimensional model by adding an external potential. The mode then oscillates but, as discussed in Weinberg (1991), its structure is qualitatively similar to a simple displacement.
Observationally, a bending mode manifests itself as a shift in the position and velocity of the midplane across the disk. Indeed, midplane displacements on the order of pc have been found in the analysis of CO observations by Nakanishi & Sofue (2006). On the other hand, if we focus on the vertical structure of the disk in the solar neighborhood, then a bending mode effects our determination of the Sun’s vertical position and velocity but is otherwise unobservable.
3.2 Simulations in one dimension
Widrow et al. (2012) presented one-dimensional N-body simulations to illustrate the evolution of a perturbed isothermal plane. In these simulations the DF is sampled by a set of “particles” each of which represents an infinite plane with surface density . The force acting on the ’th particle is
| (23) |
where () is the number of particles to its right (left). The equilibrium model was the Spitzer solution while the perturbation was chosen to correspond to the velocity and number density perturbations seen in the data. Waves appear to reflect off the low density regions above and below the midplane. The perturbation also appears to decay from the inside out. This result is consistent with the result discussed above (see also Weinberg (1991), namely that coherent excitations of the system are mainly a phenomena of stars with higher vertical energies and also that those high-energy stars are most easily excited by a passing satellite.
We have carried out a new simulation where the initial conditions are that of the truncated isothermal plane (Eq. 22) with (see also Weinberg (1991)). The system is perturbed by a passing satellite whose velocity is and whose surface density is equal to one half the surface density of the system. In Figure 9 we show the change in the DF as a function of and for three epochs. At the first epoch () the satellite is crossing the midplane. The second and third panels show the change in the DF for and where is the period for stars with . A bending-mode perturbation is generated for stars with . As the system evolves, the perturbation is washed out for , presumably by a combination of phase mixing and Landau damping. However, the perturbation persists mainly for stars with energies near the energy cut-off. This result is jibes with the fact that the true modes of the system are most pronounced near the energy cut-off. (See Figure 4 from Weinberg (1991) and our Figure 7)
4 N-BODY SIMULATIONS
4.1 Single satellite perturbations
As discussed above, the coupling between a satellite and the vertical modes of the Galactic disk in the solar neighborhood is governed by the relative in-plane motions of the satellite and the LSR, the match between the satellite’s vertical velocity and the vertical epicyclic motions of solar neighborhood stars, and the mass and concentration of the satellite. Gómez et al. (2013) used numerical simulations to show that the Sagittarius dwarf galaxy could have induced wavelike perturbations as it plunged through the stellar disk. The initial Milky Way model is from Widrow et al. (2008). Gómez et al. (2013) considered two models for the Sagittarius progenitor, a light model, with virial mass , an NFW (Navarro et al., 1996) scale length , and a concentration parameter and a heavy model with , and . The surface densities for these models are and . These values are larger than the disk surface density in the solar neighborhood. However the satellites suffer mass loss due to tidal stripping before the pass through the disk. In any case, it is not surprising that the disk is perturbed by a passing satellite with these parameters and indeed, Gómez et al. (2013) find that there are regions in the disk characteristic of the solar neighborhood (that is, from the Galaxy’s center) where the vertical number density profile of disk stars has wave-like perturbations qualitatively similar to what is seen in the data (Widrow et al., 2012; Yanny & Gardner, 2013).
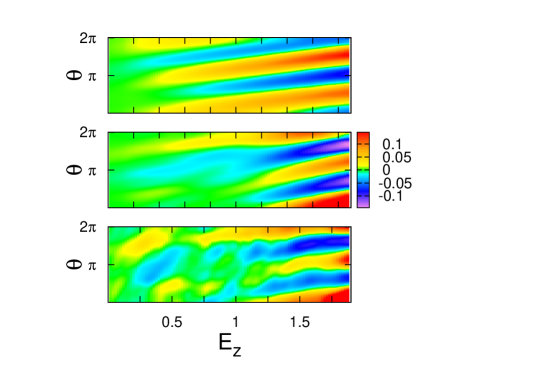
Here we present preliminary results from simulations of satellite-disk interactions with a particular focus on vertical velocity perturbations. We choose the most stable of the Galactic models presented in Widrow et al. (2008) as our model for the parent galaxy. In Figure 10 we present results for a satellite that passes through the midplane of the Milky Way on a prograde orbit at a Galactocentric radius of with a vertical speed of roughly . The satellite has a mass of and is truncated at a radius of . The first column of panels shows the disk as the satellite is passing through the midplane while the second column shows the disk some later. The top panels show a logarithmic map of the surface density across the disk. The strong wake generated by the satellite is clearly visible in the upper left panel. Over time, the disk develops prominent flocculent spiral structure.
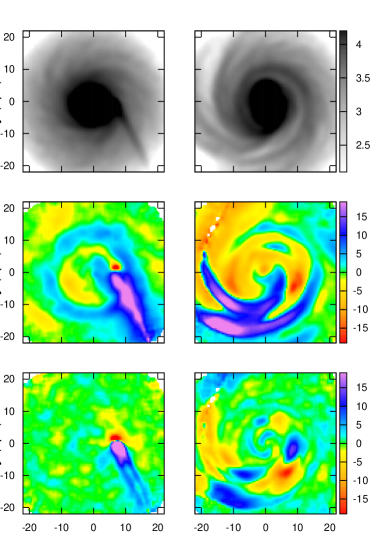
To quantify the bending and breathing modes we model the bulk vertical velocity across the disk plane as
| (24) |
That is, for disk stars within a two-dimensional cylinder centered on the point in the disk plane we fit a to a linear function in . The coeffient is a measure of the bending mode strength and is shown in the two middle panels of Figure 10 while is a measure of the breathing mode strength and is shown in the bottom two panels. We see that the satellite excites both modes as it passes through the disk. These perturbations are sheared by the differential rotation of the disk and continue to oscillate and reverberate for many 100’s of Myr. Both modes have a pattern across the disk that is qualitatively similar to the spiral structure seen in the density map.
4.2 System of satellites
Gauthier et al. (2006) followed the evolution of a disk-bulge-halo galaxy in which the halo comprises a smooth component with an NFW profile (Navarro et al., 1996) and a system of 100 subhalos. For the parent galaxy they used the self-consistent equilibrium model of M31 from Widrow & Dubinski (2005) labelled M31a. This model provides a good match to the observed rotation curve, surface brightness profile, and velocity dispersion profile and is stable against the formation of a bar for so long as the halo mass is assumed to be smoothly distributed. The disk has a mass of and an exponential scale length of . The circular speed curve reaches a peak value of at a radius of . The complete list of model parameters can be found in Table 2 of Widrow & Dubinski (2005) or Table 1 of Gauthier et al. (2006). In principle, the model could be “rescaled” to make better contact with Milky Way observations. Nevertheless, the qualitative features of the simulations should be applicable to the Galaxy. A proper Milky Way version of this numerical experiment will be presented in a forthcoming publication.
The 100 subhalos in the Gauthier et al. (2006) simulation range in mass from with a number density mass function given by (Gao et al., 2004). Initially, each subhalo is modelled as a spherically symmetric truncated NFW system where the truncation radius is given by its tidal radius, as determined by the Jacobi condition, at :
| (25) |
Here is the mean (sub)halo density inside radius . The radius is the mean apocenter for the initial system of subhalos. Each subhalo is characterized by its mass , scale radius , and concentration . In Figure 11, we plot and as a function of the average surface density within a projected radius , for individual subhalos (see Table 2 of Gauthier et al. (2006)). Note that is approximately constant and a factor of larger than .

One of the most striking results from the Gauthier et al. (2006) simulation is the formation of a strong bar at about (see, also Kazantzidis et al. (2008)). In Figure 12, we show the surface density and breathing mode strength at and . The length of the bar is as can be seen in the upper right panel of Figure 12 and Figure 5 of Gauthier et al. (2006). Prominent spiral structure also develops and indeed, appears to be a precursor to the formation of the bar. Though there is some disk heating during the first the most significant heating and thickening occurs after the bar forms (see Dubinski et al. (2008) for a further discussion). By contrast, no bar and only weak spiral structure develops in the control experiment, which assumes a smooth halo. Evidently, satellites and subhalos provoke spiral structure and bar formation (see also Purcell et al. (2011)).
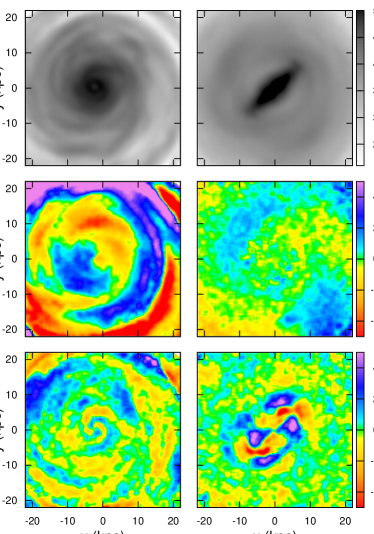
It is not at all surprising that system of subhalos also excites vertical oscillations in the stellar disk. 111See the animation found at the URL http://www.cita.utoronto.ca/d̃ubinski/Rome2007/. Note in particular, the switch half-way through to an edge-on view of the disk. Bending and breathing mode perturbations are found across the disk and throughout the simulation, as can be seen in the middle and lower panels of Figure 12. Prior to bar formation there are strong large-scale bending modes across the disk with amplitudes on the order of . The breathing modes have a somewhat smaller amplitude () and vary on smaller scales. At later times, after the bar has formed, the bending mode perturbations have diminished. Moreover, in the inner parts of the Galaxy, the breathing mode mirrors the bar. Thus, while subhalos may have triggered the formation of the bar, it is the bar that generates and maintains compression and rarefaction motions in the inner Galaxy. Of course, the Sun sits well beyond the region of the bar and it is therefore unlikely that the bar could cause the bulk motions seen in the solar neighborhood.
5 DISCUSSION and CONCLUSIONS
The implications of spatially dependent bulk motions perpendicular to the Galactic disk were highlighted by Oort (1932) in his seminal work on the structure of the Galactic disk. Oort’s aim was to determine the potential from the local stellar density and velocity distribution. He based his analysis on the assumption that the local distribution of stars is in equilibrium. To test the assumption, he computed the mean vertical velocity for stars in four separate bins: and but did not find evidence for systematic motions, a result that he notes “lends some support to the assumption …that in the -direction the stars are thoroughly mixed” (Oort, 1932). Turning Oort’s argument around, the detection of bulk vertical motions by the SDSS/SEGUE, RAVE, and LAMOST surveys suggests that the local Galactic disk is not in equilibrium in the -direction.
In this paper, we considered the hypothesis that the observed bulk vertical motions were generated by a passing satellite or dark matter subhalo. The idea that dark matter, in one form or another, might be responsible for heating and thickening the disk dates back to the 1980’s. Lacey & Ostriker (1985) calculated disk heating by a dark halo of supermassive black holes while Carr & Lacey (1987) considered dark matter in the form of dark clusters. In essence, our hypothesis is that the bulk motions seen in the data represent the early stages of a disk heating event.
Our focus has been to explore the theoretical aspects of disk-satellite interactions. We found that the nature of the perturbations is controlled largely by the satellite’s vertical velocity relative to the disk. In particular, a slow moving (as measured in the LSR) satellite induces a bending mode perturbation. With a higher vertical velocity, higher order modes, such as the breathing mode, are excited. Thus, if a satellite is indeed responsible for the bulk vertical motions seen in the solar neighborhood, this its vertical velocity through the disk would likely have been . Moreover, its surface density would have to be comparable to that of the disk in order to produce an appreciable perturbation. The model satellites considered by Gómez et al. (2013) satisfy these conditions and so it is not surprising that they found vertical perturbations in the disk that were qualitatively similar to what was found in the data.
Single satellite simulations show that after a localized breathing mode perturbation is produced, it is sheared by the differential rotation of the disk. After several orbital periods of the disk, the perturbation assumes on a spiral-like pattern. The situation is more complicated with a population of satellites and it may be difficult to disentangle initial perturbations from the accumulated long-lived perturbations.
Our analysis, and that of Weinberg (1991) suggest that stars on the tail of the energy distribution are most responsive to a breathing mode perturbation. Though our analyses focused on single-component disks, it may well be that the vertical motions is a property more of the thick disk stars, than the thin disk stars. It is well known that the vertical velocity dispersion and scale height are anti-correlated with metallicity (see, for example, Bovy et al. (2012a, b); Minchev et al. (2013, 2014) and references therein). The arguments presented in this paper suggest that bulk motions should be more prominent in the low metallicity/high populations. A related issue is radial migration. Sellwood & Binney (2002) argued that spiral waves can change the angular momenta, and hence Galactocentric radii, of individual stars by 50%. In analysing the cosmological simulations of disk formation by Martig et al. (2012), Minchev et al. (2013) found that satellite interactions can also drive radial migration. Moreover, radial migration can bring high dispersion stars from the inner disk to the solar neighborhood, and, as discussed above, these are the stars most susceptible to a recent satellite interaction.
There are twenty-five known satellites of the Milky Way. Moreover, in a CDM cosmology, the dark halo of a Milky Way-size galaxy is expected to harbour many more nonluminous subhalos (Klypin et al., 1999; Moore et al., 1999). Thus, it is likely that the Galactic disk has been continually perturbed over its lifetime. In principle, observations of bulk motions in the stellar disk could provide a probe of the subhalo distribution. To do so will require a suite of simulations where the slope and amplitude of the subhalo mass function are varied.
Over the next few years, Gaia will provide an unprecedented snapshot of the Galaxy by making astrometric, spectral, and photometric observations of approximately one billion Milky Way stars (See, for example Perryman et al. (2001) and de Bruijne (2012)). This data set will yield a more accurate and complete map of bulk motions in the stellar disk. By bringing together these observations, theoretical analysis, and N-body simulations we hope to better understand Galactic dynamics, and in particular, interactions between the Milky Way’s disk and its satellites and dark matter subhalos.
Acknowledgements
We thank Martin Weinberg and Martin Duncan for useful conversations. We thank Facundo Gómez for providing the structural parameters for their models of the Sagittarius dwarf. LMW acknowledges the Aspen Center of Physics for its hospitality. This work was supported by a Discovery Grant with the Natural Sciences and Engineering Research Council of Canada. MHC also acknowledges the financial support of the Ontario Graduate Scholarship program.
References
- Araki (1985) Araki, S. 1985, Ph.D. Thesis, MIT
- Binney & Tremaine (2008) Binney, J., & Tremaine, S. 2008, Galactic Dynamics: Second Edition, by James Binney and Scott Tremaine. ISBN 978-0-691-13026-2 (HB). Published by Princeton University Press, Princeton, NJ USA, 2008.,
- Bovy et al. (2012a) Bovy, J., Rix, H.-W., Liu, C., et al. 2012, ApJ, 753, 148
- Bovy et al. (2012b) Bovy, J., Rix, H.-W., Hogg, D. W., et al. 2012, ApJ, 755, 115
- Bovy et al. (2012c) Bovy, J., Allende Prieto, C., Beers, T. C., et al. 2012, ApJ, 759, 131
- de Bruijne (2012) de Bruijne, J. H. J. 2012, Ap&SS, 341, 31
- Camm (1950) Camm, G. L. 1950, MNRAS, 110, 305
- Carlin et al. (2013) Carlin, J. L., DeLaunay, J., Newberg, H. J., et al. 2013, arXiv:1309.6314
- Carr & Lacey (1987) Carr, B. J., & Lacey, C. G. 1987, ApJ, 316, 23
- Chakrabarty (2007) Chakrabarty, D. 2007, A&A, 467, 145
- Chandrasekhar (1943) Chandrasekhar, S. 1943, ApJ, 97, 255
- Chereul et al. (1998) Chereul, E., Creze, M., & Bienayme, O. 1998, A&A, 340, 384
- Chereul et al. (1999) Chereul, E., Crézé, M., & Bienaymé, O. 1999, A&AS, 135, 5
- Cui et al. (2012) Cui, X.-Q., Zhao, Y.-H., Chu, Y.-Q., et al. 2012, Research in Astronomy and Astrophysics, 12, 1197
- Dehnen (1998) Dehnen, W. 1998, AJ, 115, 2384
- Dehnen (2000) Dehnen, W. 2000, AJ, 119, 800
- De Simone et al. (2004) De Simone, R., Wu, X., & Tremaine, S. 2004, MNRAS, 350, 627
- Dubinski et al. (2008) Dubinski, J., Gauthier, J.-R., Widrow, L., & Nickerson, S. 2008, Formation and Evolution of Galaxy Disks, 396, 321
- Eggen (1996) Eggen, O. J. 1996, AJ, 112, 1595
- Gao et al. (2004) Gao, L., White, S. D. M., Jenkins, A., Stoehr, F., & Springel, V. 2004, MNRAS, 355, 819
- Gauthier et al. (2006) Gauthier, J.-R., Dubinski, J., & Widrow, L. M. 2006, ApJ, 653, 1180
- Gómez et al. (2013) Gómez, F. A., Minchev, I., O’Shea, B. W., et al. 2013, MNRAS, 429, 159
- Helmi et al. (2006) Helmi, A., Navarro, J. F., Nordström, B., et al. 2006, MNRAS, 365, 1309
- Holmberg & Flynn (2004) Holmberg, J., & Flynn, C. 2004, MNRAS, 352, 440
- Ibata et al. (1994) Ibata, R. A., Gilmore, G., & Irwin, M. J. 1994, Nature, 370, 194
- Ibata et al. (1997) Ibata, R. A., Wyse, R. F. G., Gilmore, G., Irwin, M. J., & Suntzeff, N. B. 1997, AJ, 113, 634
- Kazantzidis et al. (2008) Kazantzidis, S., Bullock, J. S., Zentner, A. R., Kravtsov, A. V., & Moustakas, L. A. 2008, ApJ, 688, 254
- Klypin et al. (1999) Klypin, A., Kravtsov, A. V., Valenzuela, O., & Prada, F. 1999, ApJ, 522, 82
- Kuijken & Gilmore (1989) Kuijken, K., & Gilmore, G. 1989, MNRAS, 239, 571
- Lacey & Ostriker (1985) Lacey, C. G., & Ostriker, J. P. 1985, ApJ, 299, 633
- Landau (1946) Landau, L., 1946, J. Phys. USSR 10 (JETP, 16, 574)
- Lynden-Bell (1962) Lynden-Bell, D. 1962, MNRAS, 124, 279
- Martig et al. (2012) Martig, M., Bournaud, F., Croton, D. J., Dekel, A., & Teyssier, R. 2012, ApJ, 756, 26
- Mathur (1990) Mathur, S. D. 1990, MNRAS, 243, 529
- Minchev et al. (2009) Minchev, I., Quillen, A. C., Williams, M., et al. 2009, MNRAS, 396, L56
- Minchev et al. (2013) Minchev, I., Chiappini, C., & Martig, M. 2013, A&A, 558, A9
- Minchev et al. (2014) Minchev, I., Chiappini, C., Martig, M., et al. 2014, ApJL, 781, L20
- Moore et al. (1999) Moore, B., Ghigna, S., Governato, F., et al. 1999, ApJL, 524, L19
- Nakanishi & Sofue (2006) Nakanishi, H., & Sofue, Y. 2006, PASJ, 58, 847
- Navarro et al. (1996) Navarro, J. F., Frenk, C. S., & White, S. D. M. 1996, ApJ, 462, 563
- Navarro et al. (2004) Navarro, J. F., Helmi, A., & Freeman, K. C. 2004, ApJL, 601, L43
- Nordström et al. (2004) Nordström, B., Mayor, M., Andersen, J., et al. 2004, A&A, 418, 989
- Oort (1932) Oort, J. H. 1932, BAN, 6, 249
- Perryman et al. (2001) Perryman, M. A. C., de Boer, K. S., Gilmore, G., et al. 2001, A&A, 369, 339
- Purcell et al. (2011) Purcell, C. W., Bullock, J. S., Tollerud, E. J., Rocha, M., & Chakrabarti, S. 2011, Nature, 477, 301
- Quillen & Minchev (2005) Quillen, A. C., & Minchev, I. 2005, AJ, 130, 576
- Quinn et al. (1993) Quinn, P. J., Hernquist, L., & Fullagar, D. P. 1993, ApJ, 403, 74
- Quinn & Goodman (1986) Quinn, P. J., & Goodman, J. 1986, ApJ, 309, 472
- Roeser et al. (2010) Roeser, S., Demleitner, M., & Schilbach, E. 2010, AJ, 139, 2440
- Robin et al. (2003) Robin, A. C., Reylé, C., Derrière, S., & Picaud, S. 2003, A&A, 409, 523
- Sellwood et al. (1998) Sellwood, J. A., Nelson, R. W., & Tremaine, S. 1998, ApJ, 506, 590
- Sellwood & Binney (2002) Sellwood, J. A., & Binney, J. J. 2002, MNRAS, 336, 785
- Sellwood (2013) Sellwood, J. A. 2013, Planets, Stars and Stellar Systems. Volume 5: Galactic Structure and Stellar Populations, 923
- Spitzer (1942) Spitzer, L., Jr. 1942, ApJ, 95, 329
- Spitzer (1958) Spitzer, L., Jr. 1958, ApJ, 127, 17
- Steinmetz et al. (2006) Steinmetz, M., Zwitter, T., Siebert, A., et al. 2006, AJ, 132, 1645
- Stix (1992) Stix, T. H. 1992, Waves in plasmas , by Stix, Thomas Howard.; Stix, Thomas Howard. New York : American Institute of Physics, c1992.,
- Toth & Ostriker (1992) Toth, G., & Ostriker, J. P. 1992, ApJ, 389, 5
- Toomre (1966) Toomre, A. 1966, in Geophys. Fluid Dyn. (Notes on the 1966 Summer Study Program at the Woods Hole Oceanographic Institution, Ref. No. 66-46) 111
- Toomre & Toomre (1972) Toomre, A., & Toomre, J. 1972, ApJ, 178, 623
- Velazquez & White (1999) Velazquez, H., & White, S. D. M. 1999, MNRAS, 304, 254
- Walker et al. (1996) Walker, I. R., Mihos, J. C., & Hernquist, L. 1996, ApJ, 460, 121
- Weinberg (1991) Weinberg, M. D. 1991, ApJ, 373, 391
- Widrow & Dubinski (2005) Widrow, L. M., & Dubinski, J. 2005, ApJ, 631, 838
- Widrow et al. (2008) Widrow, L. M., Pym, B., & Dubinski, J. 2008, ApJ, 679, 1239
- Widrow et al. (2012) Widrow, L. M., Gardner, S., Yanny, B., Dodelson, S., & Chen, H.-Y. 2012, ApJL, 750, L41
- Williams et al. (2013) Williams, M. E. K., Steinmetz, M., Binney, J., et al. 2013, arXiv:1302.2468
- Yanny & Gardner (2013) Yanny, B., & Gardner, S. 2013, ApJ, 777, 91
- Yanny et al. (2009) Yanny, B., Rockosi, C., Newberg, H. J., et al. 2009, AJ, 137, 4377
- Zhao et al. (2012) Zhao, G., Zhao, Y.-H., Chu, Y.-Q., Jing, Y.-P., & Deng, L.-C. 2012, Research in Astronomy and Astrophysics, 12, 723