HI-to-H2 Transitions and HI Column Densities in Galaxy Star-Forming Regions
Abstract
We present new analytic theory and radiative transfer computations for the atomic to molecular (HI-to-H2) transitions, and the build-up of atomic-hydrogen (HI) gas columns, in optically thick interstellar clouds, irradiated by far-ultraviolet photodissociating radiation fields. We derive analytic expressions for the total HI column densities for (one-dimensional (1D)) planar slabs, for beamed or isotropic radiation fields, from the weak- to strong-field limits, for gradual or sharp atomic to molecular transitions, and for arbitrary metallicity. Our expressions may be used to evaluate the HI column densities as functions of the radiation field intensity and the H2-dust-limited dissociation flux, the hydrogen gas density, and the metallicity-dependent H2 formation rate-coefficient and far-UV dust-grain absorption cross-section. We make the distinction between “HI-dust” and “H2-dust” opacity, and we present computations for the “universal H2-dust-limited effective dissociation bandwidth”. We validate our analytic formulae with Meudon PDR code computations for the HI-to-H2 density profiles, and total HI column densities. We show that our general 1D formulae predict HI columns and H2 mass fractions that are essentially identical to those found in more complicated (and approximate) spherical (shell/core) models. We apply our theory to compute H2 mass fractions and star-formation thresholds for individual clouds in self-regulated galaxy disks, for a wide range of metallicities. Our formulae for the HI columns and H2 mass fractions may be incorporated into hydrodynamics simulations for galaxy evolution.
Subject headings:
ISM: clouds — ISM: molecules — molecular processes — radiative transfer — stars: formation1. Introduction
The atomic to molecular hydrogen (HI-to-H2) transition is of central importance for the evolution of the interstellar medium (ISM) and for star-formation in galaxies, from local environments in the Milky Way to distant cold gas reservoirs in high-redshift systems. Stars form in molecular gas, plausibly because H2 formation enhances low-temperature cooling and cloud fragmentation, or perhaps simply because the molecular formation rates are elevated in the denser and more shielded components of the gravitationally collapsing regions. The atomic to molecular conversion is also the critical initiating step for the growth of chemical complexity in the ISM from large to small scales, e.g. from diffuse clouds to dense star-forming cores to protoplanetary disks. Globally, the transition to H2 appears to be associated with star-formation thresholds in galaxy-wide Kennicutt-Schmidt relations, and with the observed critical gas mass surface densities above which star-formation becomes probable.
In this paper, we revisit the theory of the HI-to-H2 transition and the build-up of atomic hydrogen gas layers in fully optically thick interstellar clouds irradiated by far-ultraviolet (FUV) radiation fields. Atomic (HI) gas produced by rapid stellar far-ultraviolet “Lyman-Werner” (LW) photodissociation undergoes conversion to H2 as the destructive radiation is absorbed. In steady-state, a mass of HI is maintained in the outer FUV irradiated photon-dominated regions (PDRs) of the dense molecular clouds. Much of the (cold) HI gas in galaxies may reside in such cloud boundary layers and envelopes, interspersed with the recently formed FUV-emitting OB-type stars.
The study of interstellar HI-to-H2 conversion has had a long and venerable history. Early theoretical discussions (e.g., Spitzer 1948; Gould & Salpeter 1963; Field et al. 1966; Stecher & Williams 1967; de Jong 1972; followed by Aaronson et al. 1974; Glassgold & Langer 1974; Jura 1974; Black & Dalgarno 1977; Federman et al. 1979; van Dishoeck & Black 1986) focussed on the competing processes of (grain-surface) molecule formation, photodissociation, and shielding, in predominantly atomic gas - the classical warm and cold neutral medium (WNM and CNM) and diffuse gas - showing that significant concentrations of H2 could be expected in the Galactic ISM, especially in dusty dark clouds with high visual extinctions (Mészáros, 1968; Hollenbach et al., 1971; Solomon & Werner, 1971; de Jong, 1972). This was confirmed observationally with the first direct (far-UV LW absorption line) detections of interstellar molecular hydrogen in diffuse clouds and the correlation of the H2 with color excess and dust extinction (Carruthers, 1970; Spitzer et al., 1973; Savage et al., 1977), and with the discovery of fully molecular clouds via proxy millimeter-wave carbon monoxide (CO) emissions (Wilson et al., 1970; Rank et al., 1971).
Absorption line spectroscopy (Ly for HI, and LW-band for H2) has been carried out for HI-to-H2 along many Milky Way sight-lines, through low-extinction diffuse-to-translucent gas in the disk, and into the infrared cirrus and high-velocity gas in vertical directions (Savage et al., 1977; Bohlin et al., 1978; Richter et al., 2001; Liszt & Lucas, 2002; Rachford et al., 2002, 2009; Gillmon & Shull, 2006; Gillmon et al., 2006; Wakker, 2006; Liszt, 2007; France et al., 2013; Fukui et al., 2014; Röhser et al., 2014). These studies probe systems in which the H2 mass fractions range over many orders of magnitude, from up to in highly reddened systems. Absorption line observations of damped- and sub-damped Ly absorbers (DLAs) at high redshifts also directly reveal the partial conversion of HI to H2 in optically thin media (Levshakov & Varshalovich, 1985; Foltz et al., 1988; Ge & Bechtold, 1997; Cui et al., 2005; Ledoux et al., 2006; Noterdaeme et al., 2010; Crighton et al., 2013; Albornoz Vásquez et al., 2014). In the early Universe, the formation of the first stars (Population III) was enabled by the partial conversion to H2 via negative ion chemistry. The resulting H2 rotational-line gas cooling rates were likely regulated by LW-photodissociation “feedback” from the first stars and FUV sources (Palla et al., 1983; Lepp & Shull, 1984; Haiman et al., 1996, 1997; Abel et al., 1997; Ciardi et al., 2000; Glover & Brand, 2003; Yoshida et al., 2003; Wise & Abel, 2007; Dijkstra et al., 2008; Ahn et al., 2009; Bromm et al., 2009; Miyake et al., 2010; Wolcott-Green et al., 2011; Fialkov et al., 2012; Holzbauer & Furlanetto, 2012; Safranek-Shrader et al., 2012; Visbal et al., 2014).
In optically thick regions, 21 cm observations of very cold ( K) narrow-line self-absorbed HI (the Galactic “HINSA”; Li & Goldsmith 2003) in combination with CO, OH, and dust mapping for locating the H2 clouds, reveal the presence of trace atomic hydrogen inside dark dusty and predominantly molecular clouds (Bok et al., 1955; Heiles, 1969; Knapp, 1974; Burton et al., 1978; McCutcheon et al., 1978; Liszt & Burton, 1979; Mebold et al., 1982; van der Werf et al., 1988; Li & Goldsmith, 2003; Goldsmith & Li, 2005; Krčo & Goldsmith, 2010). Such clouds are fully shielded against externally incident photodissociating FUV radiation, and the conversion to H2 is essentially complete. The residual atomic gas in the cloud cores is likely the product of impact-ionization by penetrating low-energy cosmic rays (Spitzer & Tomasko, 1968; Webber, 1998; Dalgarno, 2006). Somewhat warmer HI ( K, so still “cold”) is also observed in dissociation zones surrounding Galactic HII regions associated with individual OB-type stars or clusters, and/or as HI PDRs in molecular cloud envelopes exposed to ambient interstellar radiation (e.g., Sancisi et al. 1974; Myers et al. 1978; Read 1981; Roger & Pedlar 1981; Wannier et al. 1983; Elmegreen & Elmegreen 1987; van der Werf & Goss 1989; Wannier et al. 1991; Andersson et al. 1992; Gir et al. 1994; Reach et al. 1994; Williams & Maddalena 1996; Gomez et al. 1998; Habart et al. 2003; Matthews et al. 2003; Roger et al. 2004; Lee et al. 2007; Lee et al. 2012; van der Werf et al. 2013). In nearby galaxies, HI has been mapped in spiral arms showing that the atomic gas likely traces outer photodissociated layers in the star-forming giant molecular clouds (Allen et al., 1986; Shaya & Federman, 1987; Rand et al., 1992; Madden et al., 1993; Allen et al., 1997; Smith et al., 2000; Heyer et al., 2004; Knapen et al., 2006; Schuster et al., 2007; Heiner et al., 2009, 2011).
By the 1980’s a conceptual switch had occurred with the recognition that much of the hydrogen in galaxies is fully shielded H2, and that in dense gas in star-forming regions the HI is often a surface photodissociation “product”, rather than being the dominant component within which some shielded H2 may be present, as in the diffuse medium. Over the decades many model computations for the HI-to-H2 transition in optically thick media have been presented, with varying degrees of sophistication in treating the critical roles of FUV dust absorption and scattering, and H2 absorption line self-shielding. These include one-dimensional (1D) plane-parallel (slab) models assuming steady-state conditions with simplified (“isolated line”) treatments of H2 self-shielding (Federman et al. 1979; de Jong et al. 1980; Tielens & Hollenbach 1985; Viala 1986; Black & van Dishoeck 1987; Sternberg 1988; Sternberg & Dalgarno 1989; Burton et al. 1990; Spaans et al. 1994; Sternberg & Neufeld 1999; Kaufman et al. 1999), models incorporating “exact” radiative transfer for the combined effects of multiple H2 absorption-line overlap and dust absorption/scattering (van Dishoeck & Black 1988, 1990; Viala et al. 1988; Abgrall et al. 1992; Draine & Bertoldi 1996; Browning et al. 2003; Shaw et al. 2005; Goicoechea & Le Bourlot 2007; Le Petit et al. 2006), spherically symmetric models (Andersson & Wannier 1993; Diaz-Miller et al. 1998; Neufeld & Spaans 1996; Stoerzer et al. 1996; Spaans & Neufeld 1997; Spaans & van Dishoeck 1997; Krumholz et al. 2008, 2009; McKee & Krumholz 2010; Wolfire et al. 2010), and also time-dependent models for the H2 formation and destruction (London 1978; Roger & Dewdney 1992; Goldshmidt & Sternberg 1995; Hollenbach & Natta 1995; Lee et al. 1996; Goldsmith et al. 2007). More recently, sophisticated multidimensional (2D and 3D) radiative transfer codes have been developed for the atomic to molecular conversion, also incorporating hydrodynamics (Robertson & Kravtsov 2008; Gnedin et al. 2009; Glover et al. 2010; Bisbas et al. 2012; Christensen et al. 2012; Mac Low & Glover 2012; Davé et al. 2013; Offner et al. 2013; Thompson et al. 2014), although the H2 photodissociation rates and the implied HI/H2 density ratios are generally still estimated using 1D shielding prescriptions for the individual hydrodynamic particles or cells.
In recent years interstellar HI-to-H2 conversion has become an important issue in the study of galaxy evolution on large scales, across entire galaxy disks, at both low- and high-redshifts, and for varying metallicities (e.g., Wong & Blitz 2002; Böker et al. 2003; Blitz & Rosolowsky 2004, 2006; Bigiel et al. 2008; Leroy et al. 2008; Tacconi et al. 2010; Bolatto et al. 2011; Schruba et al. 2011; Welty et al. 2012; Genzel et al. 2012, 2013; Tacconi et al. 2013). Galaxy mapping surveys suggest that on global scales the star-formation efficiencies are determined, at least in part, by molecular gas fractions that may be sensitive to the varying mid-plane gas pressures and/or metallicities (e.g., Hirashita & Ferrara 2005; Fumagalli et al. 2010; Fu et al. 2010; Lagos et al. 2011; Feldmann et al. 2012; Kuhlen et al. 2013; Popping et al. 2014). Remarkably, the observations of disk galaxies on large scales (e.g., Leroy et al. 2008), and individual Galactic molecular clouds on small scales (e.g., Lee et al. 2012, 2014), indicate that for solar metallicity the HI-to-H2 conversion occurs for characteristic gas surface densities of M⊙ pc-2 (for “ambient” FUV radiation fields). This surface density corresponds to an FUV dust optical depth , for typical grain properties and dust-to-gas mass ratios, suggesting that dust absorption and hence metallicity is playing an essential role in setting the critical gas surface densities.
An analytic theory for the HI-to-H2 transition was presented by Sternberg (1988) (hereafter S88) who derived a scaling-law for the growth of the HI column density and the associated FUV-excited infrared H2 vibrational emission intensities produced in optically thick irradiated cloud surfaces, for application to Galactic emission-line sources (see also Jura 1974; Hill & Hollenbach 1978, and Elmegreen 1993). S88 included a general-purpose analytic formula for the total HI column density as a function of the FUV radiation intensity, the cloud gas density, and the metallicity-dependent H2 formation rate coefficient and FUV dust attenuation cross section. S88 also identified the fundamental dimensionless parameter that controls the HI-to-H2 transitions and the build-up of the atomic hydrogen columns.
More recently, and motivated by the possible metallicity-dependence of molecular mass fractions in galaxy disks, Krumholz et al., 2008, 2009 and McKee & Krumholz (2010) (hereafter KMT/MK10) presented new models for the HI-to-H2 transition, and for the associated metallicity dependent H2 mass fractions and star-formation surface density thresholds. A novel feature of the KMT/MK10 study is their analytic focus on (idealized) spherical clouds embedded in ambient isotropic fields, as opposed to the (also idealized) planar geometry and beamed fields adopted in much of the earlier PDR literature, including S88.
Our main goal and motivation in this paper is to reintroduce and extend the S88 theory, for applications to global galaxy evolution studies. In §2 we elaborate on S88 and present a detailed overview and discussion of the basic theoretical ingredients and parameters controlling the HI-to-H2 transition in FUV irradiated clouds. We rederive the fundamental S88 equation for the total HI column density produced for beamed radiation into a (one-dimensional) optically thick slab. We then extend the theory and consider irradiation by isotropic fields. This will enable our direct comparison to the more complicated (and more approximate) formalism for spheres. In §3 we present detailed numerical (Meudon PDR-code) radiative transfer computations for the HI-to-H2 transitions and integrated HI columns for a wide range of interstellar conditions. The ratio of the free space FUV field intensity (or dissociation rate) to the gas density (or H2 formation rate) is an essential parameter, as is the metallicity and dust-to-gas mass ratio. We present numerical computations for a verification of our analytic formulae for beamed and isotropic irradiation from the weak- to strong-field limits (gradual to sharp HI-to-H2 transitions) and for low- to high-metallicity gas. In §4 we compare our planar formulae to the KMT/MK10 theory for spheres. This includes a discussion of the dimensionless parameters, a comparison of the expressions for the total HI columns, H2 mass fractions, and star-formation thresholds, as functions of the metallicity. An important application and comparison is for “self-regulated gas” in which the FUV-intensity to gas density ratio is set by the condition of two-phased equilibrium for the HI. We demonstrate that our simpler, more general, and fully analytic 1D formulae, predict HI columns and H2 mass fractions that are essentially identical to results for spheres in the more restricted regime in which the spherical models are applicable (intense fields, sharp transitions, low-metallicity).
This is a lengthy paper, and we develop the theory and present our comparisons, step-by-step, in a pedagogical style. In §5 we summarize and recap our basic analytic results for the HI column densities and molecular mass fractions in FUV irradiated clouds, including for self-regulated star-forming galaxies. A glossary of symbols is in the Appendix.
2. Analytic Overview
In this section we present an analytic discussion and overview of the basic processes and quantities that control the HI-to-H2 transitions and total HI columns in interstellar clouds exposed to photodissociating far-ultraviolet (FUV) radiation fields. Our overview anticipates and also provides analytic representations for the detailed numerical results that we present in §3. We focus on idealized static one-dimensional semi-infinite uniform density isothermal and optically thick plane-parallel clouds that are irradiated by steady fluxes of FUV Lyman-Werner (LW) band photons. We rederive the S88 formula for the steady-state HI column densities produced in slabs irradiated by normally incident uni-directional beamed fields, as appropriate for interstellar clouds exposed to localized FUV sources. We then show that this formula can be generalized to clouds embedded in isotropic radiation fields. Isotropic irradiation may be more representative of global ambient conditions in galaxies.
We begin with our normalizations for the beamed and isotropic ultraviolet radiation fields, and for the associated H2 photodissociation rates (§ 2.1). We then define the dissociation bandwidth and its derivative - the H2 self-shielding function (§ 2.2.1). We then describe our treatment of dust grains (§ 2.2.2). The grains provide FUV continuum opacity and are also the H2 formation sites. The metallicity of the gas then enters as an important parameter because it controls the dust-to-gas mass ratio, and therefore also the associated H2 formation efficiency and the FUV dust optical depth per gas column density. We make the simplifying assumption that the dust-to-gas mass ratio scales linearly with the metallicity. If star-formation requires the conversion from HI to H2, the metallicity will be an essential parameter in controlling the star-formation thresholds.
We put the physical ingredients together and write down the depth-dependent steady-state HI/H2 formation-destruction equation for semi-infinite slabs exposed to beamed fields (§ 2.2.3). Crucially, the differential equation is separable, and this enables our definition of the “universal H2-dust-limited LW dissociation bandwidth” (§ 2.2.4) and the “effective dissociation flux” (§ 2.2.5). The H2-dust-limited dissociation bandwidth is a fundamental quantity in the theory, and we present analytic expressions and numerical computations for it in this paper.
We then integrate the HI/H2 formation-destruction equation to derive our analytic formula for the HI column density for clouds irradiated by beamed fields (§ 2.2.6). Our formula gives the HI column density as a function of the physical variables, including gas density, FUV intensity, effective dissociation flux, H2 formation rate coefficient, FUV dust-absorption cross-section, and metallicity.
As we discuss (in §2.2.6) the HI-to-H2 transition profiles and the total atomic column densities are controlled by a single dimensionless parameter, “”, first introduced by S88. In a nutshell, determines the LW-band optical depth in the cloud due to the dust associated with the HI gas (which we refer to in this paper as “HI-dust”), and whether or not the HI is mixed with the H2. The total HI-dust optical depth is a critical quantity in the theory; for beamed fields our formula for it (as derived in §2.2.6) is
| (1) |
As we show (in § 2.2.7) can be expressed in terms of the physical variables in several ways. Most simply, (also dimensionless) is the ratio of the free-space photodissociation rate to the H2 formation rate, and is a cloud-averaged H2 self-shielding factor. The product is then similar to the ionization parameter “” for HII Strömgren regions, where is proportional to the ratio of the photoionization rate to the HI formation rate via electron-proton recombination. However, is also a measure of the dust-absorption efficiency of the H2-dissociating photons. For the HI/H2 density ratio in an optically thin “free-space” radiation field, is the ratio of the HI-dust to H2-line absorption rates of LW-band photons that are effectively available for H2 dissociation. For sufficiently large metallicities this excludes LW photons “between the lines” that are inevitably absorbed by dust associated with just the H2 (“H2-dust”) in a predominantly molecular and dusty cloud. As we will discuss, the mean shielding factor depends on the competition between H2 line-absorption and H2-dust absorption. Because of this competition, a metallicity dependence is introduced into and therefore also into our fundamental parameter .
An important physical distinction occurs between the limits of small and large (§ 2.2.8). Small is the “weak-field-limit” for which HI-dust opacity is negligible and does not contribute to the absorption of the radiation, although a substantial (observable) atomic column can nevertheless exist in this limit. Large is the “strong-field-limit”, for which the atomic column becomes so large that HI-dust dominates the attenuation of the radiation fields, reducing the fraction of the incident radiation that is absorbed by the H2.
In general, is the dimensionless “free parameter” in the problem, with a value that is determined by local conditions (density, radiation intensity, metallicity, etc.). However, as invoked by KMT/MK10, on global scales in star-forming galaxy disks the gas density and radiation intensity may be correlated or self-regulated to conditions enabling a two-phase equilibrium between cold and warm HI (CNM/WNM multiphase). As we describe (in §2.2.9) this then drives to a narrow range, of order unity, intermediate between the weak- and strong-field limits, and only weakly dependent on the metallicity.
Finally, in § 2.3 we extend our analysis to slabs exposed to isotropic radiation fields. An angular integration over all photodissociating ray directions is then also required in the computation of the HI column densities. Our resulting analytic expressions for the atomic columns and associated HI-dust opacities are similar to those for beamed fields, and with similar behavior in the weak- and strong-field limits. Our analytic results for slabs irradiated by isotropic fields enable a direct comparison to the KMT/MK10 results for spheres, as we discuss in depth in §4. In § 3 we verify our analytic results with detailed numerical model computations.
2.1. Radiation Fields and H2 Photodissociation Rate
We will consider static optically thick plane-parallel clouds (slabs) exposed to either isotropic or corresponding beamed Lyman-Werner (LW) band radiation fields. We define the spectral range of the LW band as 912-1108 Å (11.3-13.6 eV) as appropriate for line absorptions occurring out of low-lying rotational levels in the ground vibrational state.
Let , where is the specific photon intensity (cm-2 s-1 Hz-1 sr-1) of an isotropic optically thin “free-space” LW radiation field. If an optically thick gas slab (or semi-infinite slab) is inserted, the flux density of the isotropic field at a cloud surface is equal to . The corresponding unidirectional beamed field is defined such the LW photons are normally incident on the cloud surface with flux density . The surface flux of the isotropic field is half that of the corresponding beamed field, but the energy densities are equal. The energy densities at the cloud surfaces are half that in the (full ) free-space radiation field.
In this paper we adopt the standard Draine (1978, 2011) expression
| (2) |
for the specific intensity (photons s-1 cm-2 Hz-1 sr-1) of the isotropic free-space far-ultraviolet (5-13.6 eV FUV) radiation field in the Galactic interstellar medium. In Equation (2), is the photon wavelength in Angstroms. For this spectrum, the specific intensity varies by a factor of eight across the LW band. At 1000 Å, photons s-1 cm-2 Hz-1 sr-1, and the energy density erg cm-3 (where is the photon frequency in Hz). The total photon density in the 912-1108 Å LW band is cm-3.
To consider radiation fields with greater or lesser intensities we multiply by an overall field-strength scaling factor , such that corresponds to the unit free-space Draine field given by Equation (2). In this paper we do not consider radiation fields with alternate spectral shapes. For completeness we recall that the Draine energy density is 1.7 times larger than the Habing (1968) estimate for the LW energy density at 1000 Å111We note that in the classical “PDR literature” the FUV field-strength is designated variously as , , or (e.g., Hollenbach et al. 1971; van Dishoeck & Black 1986; Sternberg & Dalgarno 1989; Draine & Bertoldi 1996). In this paper we adopt for the field-strength to avoid confusion with the “-factor” defined below (in §2.2.5) or with the KMT/MK10 “” which, as we discuss (in §4) is equivalent to our in the low metallicity limit. The adopted normalizations can be confusing. For example, in the classic Tielens & Hollenbach (1985) paper, refers to an FUV field for which the energy density at the surface of an optically thick cloud is equal to the energy density in the free-space (all ) Habing (1968) field. That is, for an optically thick slab embedded in a unit (isotropic) Habing field. With our definitions, (not ) for a cloud inserted into a unit isotropic Draine field with , or for a cloud illuminated by a corresponding beamed field with surface flux density . For , the H2 photodissociation rates at the cloud surfaces are equal to half the full- “free-space” rate in a unit Draine field (see also Equation [5]). .
For the free-space fields, we define the LW-band photon flux-integral
| (3) |
where to is the frequency range of the LW band, and where . For the Draine spectrum, photons s-1 cm-2 Hz-1 at 1000 Å, and
| (4) |
At the cloud surfaces, the 1000 Å flux densities are then and photons s-1 cm-2 Hz-1 for the isotropic and corresponding beamed fields. The total LW band surface fluxes are and photons cm-2 s-1. For a given , the energy densities of the isotropic and corresponding beamed fields are equal at the cloud surfaces.
The photodissociation of H2 occurs via line absorption of LW photons in allowed transitions from the ground electronic state to the excited or states. These are followed by rapid decays to either bound ro-vibrational levels or to the continuum of the ground state. Decays to the continuum lead to dissociation (P. M. Solomon, private communication in Field et al. 1966; Stecher & Williams 1967; Stephens & Dalgarno 1972; Abgrall et al. 1992). The - and - bound-bound transitions are mainly to excited vibrational levels followed by a near-infrared quadrupole radiative cascade (Gould & Harwit 1963; Black & Dalgarno 1976; Shull 1978; Black & van Dishoeck 1987; S88; Sternberg & Dalgarno 1989; Draine & Bertoldi 1996; Neufeld & Spaans 1996). Thus, all of the LW-band photons absorbed by the H2 are removed, but only a fraction of these absorptions () lead to photodissociation.
The H2 photodissociation rate in the ISM is a fundamental quantity, and we recompute it in § 3 assuming the Draine spectrum, for a range of assumed gas temperatures, densities, and field intensities. We find that for dissociation out of the 912-1108 Å LW band, the optically thin (full-) free-space photodissociation rate is
| (5) |
At a cloud surface the dissociation rate, , is half the free-space rate and
| (6) |
Because the dissociation rate is proportional to the radiation energy density, the dissociation rates for isotropic and corresponding beamed fields are identical at a cloud surface.
The photodissociation rate diminishes with cloud depth due to the combination of H2-line and dust absorptions. The attenuation of the LW radiation field is crucial in determining the depth dependence of the atomic and molecular densities, the shapes of the HI-to-H2 transition profiles, and the resulting atomic hydrogen column densities. The depth-dependent attenuation depends on the assumed field geometry, and we analyze the behavior for both beamed and isotropic fields, starting with beamed fields which are simpler.
2.2. Beamed Fields
We consider the HI-to-H2 transition and total column density of atomic hydrogen on one side of an optically thick plane-parallel slab of gas (or semi-infinite slab) that is exposed to a steady flux of Lyman-Werner band photons normally incident on the cloud surface as uni-directional beamed radiation.
2.2.1 Dissociation Bandwidth and Self-Shielding Function
Let be the H2 column density (cm-2) at some depth normal to the cloud surface. Then, neglecting dust-absorption of the LW photons, and for beamed radiation, the photodissociation rate (s-1) for a single LW absorption line may be written as
| (7) |
where
| (8) |
In these expressions, is the incident beamed flux-density (photons cm-2 s-1 Hz-1) at the cloud surface, is the cross-section (cm2) for absorptions that lead to molecular dissociation 222 In our notation, the subscript “d” refers to H2 photodissociation. Thus, is the cross-section for line-absorption followed by dissociation. The subscript “g” refers to dust grains. Thus, is the far-UV dust grain absorption cross section (§ 2.2.2)., and is the cross section for all photon absorptions (not just those that are followed by dissociation). The dissociation probabilities, , range from 0 to more than 0.5 for individual LW transitions depending on the rotational quantum number in the excited B or C states. The mean (typical) dissociation probability averaged over all lines is . For a single absorption line,
| (9) |
for a typical LW band oscillator strength , and dissociation probability (and where and are the electron charge and mass, and is the speed-of-light).
In Equation (7), we pull out of the integral because we assume that the flux-density varies very slowly over the narrow line profile (as represented by ). In Equation (8), is defined as the “equivalent bandwidth” (Hz) of radiation absorbed in H2 dissociations via absorption line , up to molecular column . The dissociation rate decreases with the molecular column as the absorption line become optically thick, and the ratio
| (10) |
is the individual H2-line “self-shielding” function. It quantifies the reduction of the line dissociation rate, where is the line dissociation rate at the cloud surface. By definition, the self-shielding function is proportional to the derivative of the dissociation bandwidth (Federman et al. 1979; van Dishoeck & Black 1986; S88; Draine & Bertoldi 1996).
For the full multi-line LW band system, the dissociation rate (again neglecting dust absorption) may be written compactly as
| (11) |
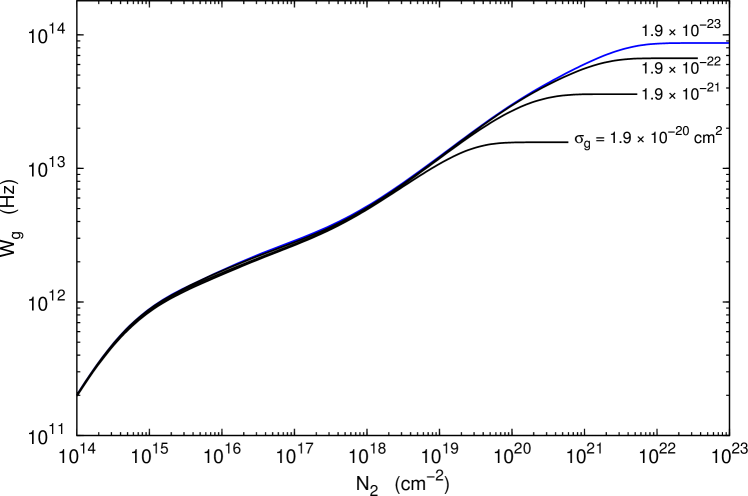
where is the equivalent dissociation bandwidth summed over all of the (possibly overlapping) absorption lines, and is a mean flux density. A plot of versus is the effective “curve-of-growth” for the dissociating LW radiation bandwidth in a dust free cloud. We present computations for in §3 (the blue curve in Figure 3).
The mean flux density in Equation (11) is given by
| (12) |
Here are the fractional populations of H2 molecules in ro-vibrational levels of the ground electronic -state, is the (full ) free-space specific intensity at frequencies of LW band transitions between level and levels in the excited or states, and are the absorption-line dissociation cross sections (cm2 Hz). The mean flux density is weighted by the relative strengths of the dissociation transitions. For the Draine spectrum, photons cm-2 s-1 Hz-1.
The denominator in expression (12), is the total (frequency integrated) H2 dissociation cross-section (cm2 Hz) summed over all absorption lines
| (13) |
Most of the H2 line absorptions occur out of the lowest few rotational levels, and the total effective dissociation cross section is insensitive to the fractional populations . We find that
| (14) |
The ratio, is then the approximate number of strong LW absorption lines involved in the multi-line H2 photodissociation process (see also Figure 2 in § 3).
With these definitions, the free-space photodissociation rate may be expressed as
| (15) |
At a cloud surface the photodissociation rate is . The ratio
| (16) |
is then the complete multi-line H2 “self-shielding” function. It quantifies the reduction of the total dissociation rate due opacity in all of the absorption lines.
For a single line the self-shielding function varies as for large because absorptions can always occur far out on the Lorentzian damping wings 333This can be seen directly from Equation (7). For damped lines, and are proportional to , and the integral over frequency is then proportional to .. Therefore, for a single absorption line, as given by Equation (8) diverges as . For strong lines (with ) this “square-root” part of the curve-of-growth begins when cm-2. For the realistic multi-line system the absorption lines will overlap for sufficiently large ( cm-2) molecular columns, and does not diverge as does . For the multiline system the total dissociation bandwidth
| (17) |
is limited to a finite maximal value (even in the absence of dust). We find that for the Draine spectrum Hz (as computed in § 3.1.2). In §3.1.3 we present our computations for the multi-line self-shielding function (Figure 5). At the cloud surface . As the Doppler cores become optically thick at cm-2, becomes small and the molecules are then said to self-shield against the dissociating radiation. The decline is more gradual at intermediate columns, to cm-2, for which most of the absorption is out of the line-wings. Finally, as line overlap occurs and the dissociating radiation is fully absorbed, becomes vanishingly small.
In the limit of complete-line-overlap, every photon in the (912-1108 Å) LW-band is absorbed in H2-lines. The product is then the LW “dissociation flux” (photons cm-2 s-1) at the cloud surface. In the absence of dust absorption this flux is equal to the H2 dissociation rate per unit area. For complete absorption of the LW-band radiation, the mean dissociation probability is
| (18) |
where is the total incident LW-band flux. For the radiative transfer computations we present in § 3 we find that , and essentially equal to the simple average over the individual line dissociation probabilities for the matrix of -, and - transitions. Our result for is consistent with many previous calculations (e.g. Black & van Dishoeck 1987; Draine & Bertoldi 1996; Browning et al. 2003).
2.2.2 Dust and Metallicity
In addition to the H2 line absorptions, the LW band photons are also absorbed by dust grains, further reducing the photodissociation rate. We assume that the dust is mixed uniformly with the gas with a dust-to-gas mass ratio that depends linearly on the metallicity of the cloud. For the grain-photon interaction we assume pure absorption and no scattering (or equivalently only forward scattering). With the inclusion of dust, the local dissociation rate, , at any cloud depth is then
| (19) |
where is the free-space dissociation rate (Equation [5]). In this expression, is the dust continuum optical depth, where is the column density of hydrogen nuclei, in molecules plus atoms. Here, is the dust-grain LW-photon absorption cross section (cm2) per hydrogen nucleon. With the inclusion of dust attenuation, the dissociation rate given by Equation (19) depends on both and the column density of atomic hydrogen .
For simplicity we also assume that is independent of photon frequency over the narrow LW band. For a standard interstellar extinction curve, with a ratio of total-to-selective extinction , a 1000 Å grain albedo , and a scattering asymmetry factor , the effective absorption cross section per hydrogen nucleus cm2 (Draine, 2003). is for diffuse gas (with densities cm-3). For , mag cm2. In dense regions ( cm-3) can be larger (up to ), but with an extinction curve that is less steep towards the ultraviolet, with cm2 (Cardelli et al., 1989; Fitzpatrick, 1999; Draine & Bertoldi, 1996; Draine, 2011). With the assumption that the dust-to-gas mass ratio is linearly proportional to the metallicity of the gas, we therefore set
| (20) |
where corresponds to the solar photospheric abundances of the heavy-elements (“solar metallicity”) and where of order unity depends on the grain composition and size distribution.
Dust grains are also essential for H2 formation (Hollenbach et al., 1971; Jura, 1974; Barlow & Silk, 1976; Leitch-Devlin & Williams, 1985; Pirronello et al., 1997; Takahashi et al., 1999; Cazaux & Tielens, 2002; Habart et al., 2004). We assume that per hydrogen nucleon the rate-coefficient for H2 formation on grains is given by
| (21) |
where is the gas temperature in ∘K. Our standard value is then cm3 s-1, for K and .
2.2.3 HI/H2 Formation-Destruction Equation
For a steady-state in which molecular photodissociation is balanced everywhere by grain surface H2 formation, the HI/H2 formation-destruction equation may be written as
| (22) |
In this equation, and are the local volume densities (cm-3) of the HI atoms and H2 molecules, and
| (23) |
is the total volume density of hydrogen nuclei. The right-hand-side of Equation (22) is the H2 photodissociation rate per unit volume (s-1 cm-3) at some cloud depth where the rate is reduced by the combined effects of self-shielding and dust attenuation. The left-hand-side is the rate per unit volume of H2 formation on dust grains. We ignore all other formation or destruction processes (such as formation in the gas phase; or destruction by X-ray or cosmic-ray ionization).
Given the free-parameters, , (or equivalently ), , and (or given which determines and ) Equation (22) together with particle conservation Equation (23) can be solved for the local atomic and molecular densities and , and for the integrated atomic and molecular columns and . If it is assumed that the incident LW radiation is fully absorbed, then (as we show below) Equation (22) gives our fundamental formula for the total atomic column that is maintained in the cloud.
The density ratio , and Equation (22) may be written as the separable differential equation (S88; see also Jura 1974; Hill & Hollenbach 1978).
| (24) |
In writing the formation-destruction equation this way, a key insight is that the dust opacities associated with the atomic and molecular columns can be considered separately. We will refer to “H2-dust” or “HI-dust” as the dust opacities associated with either just the H2 or the HI gas respectively, and whether or not the HI gas is mixed with the H2.
Integrating this expression, and assuming that and are constants (i.e., do not vary with cloud depth) gives
| (25) |
which is a functional relationship, , between the atomic and molecular column densities. We note that the independent variable parameterizing the cloud depth is here chosen to be rather than the total gas column density . Choosing as the independent variable is essential for our analysis, even though it is that is proportional to the visual extinction , or to the length scale .
2.2.4 H2-Dust-Limited Dissociation Bandwidth
Most importantly, for a given value of the integral on the right-hand-side of Equation (25),
| (26) |
is a function of the molecular column only. This is because the exponential cut-off factor in the integrand is due to H2-dust opacity only - it excludes HI-dust - and because itself depends only on . Furthermore, is only very weakly dependent on , , or , and is essentially independent of these parameters (see § 3). So, for a given , the effective equivalent width is a quantity that can be calculated in advance as a “universal dust-limited curve-of-growth” for the H2 line absorption of LW radiation, independent of the other parameters, , , and , that together with determine the depth-dependent HI/H2 density ratios and the HI-to-H2 transition profiles.
Thus, (as opposed to ) is the effective bandwidth of dissociating LW radiation in a dusty H2 cloud, where now this bandwidth is limited by H2-dust absorption of LW photons that would otherwise be available for H2 photodissociation in a dust-free cloud. H2-dust opacity is important if it becomes large before the H2 absorption lines can fully overlap. For sufficiently small , the lines do overlap completely, and then . For sufficiently large , the H2-dust provides a cut-off, and then at large .
It is a remarkable physical coincidence that the H2 column density at which the H2 lines begin to overlap - a column that depends on the internal molecular oscillator strengths and energy level spacings - is comparable to the H2 column at which the H2-dust opacity for standard interstellar dust absorption cross sections. Thus, both regimes of “small-” and “large-” for the dissociation bandwidth are relevant for the range of interstellar dust properties and metallicities in galaxies. In §3.1.2, we present computations of for a wide range of encompassing these regimes.
As , the equivalent width converges to a finite limit
| (27) |
either because the exponential H2-dust attenuation factor cuts off the integrand (for large-), or because itself vanishes as the lines overlap (for small-). Thus, is the total H2-dust-limited effective dissociation bandwidth. For large-, , and for small-, . For large- the absorption lines remain separated but are nevertheless highly damped for most of the integration range up to the H2-dust cut-off.
For a single absorption line in the damped regime, and it follows from Equation (27) that scales as . Our numerical computations (§ 3.1.2) show that for large- this scaling behavior is maintained in the full multi-line problem to a good approximation. In § 3, we find that the simple formula
| (28) |
is an excellent fit to our numerical radiative transfer results. The normalized H2-dust limited dissociation bandwidth
| (29) |
where in the last equality we have assumed (Equation[20]). In these expressions, and for small (low metallicity), and decrease as for large (high metallicity). The normalized bandwidth decreases from to for ranging from cm2 (small) to cm2 (large), or for ranging from to 3 (assuming ) which is the relevant range for galaxies.
2.2.5 Effective Dissociation Flux and Dissociation Probability
Given Equation (18) we may now write
| (30) |
and define the effective dissociation probability
| (31) |
The product is the “effective dissociation flux” for dusty clouds in which H2-dust may absorb some of the incident LW radiation. The effective dissociation flux depends on the competition between H2-line and H2-dust absorption as given by the dependence of on . The effective dissociation flux is the H2 photodissociation rate per unit surface area for a dusty and optically thick molecular slab in which HI-dust opacity is negligible.
When H2-dust is negligible, , and . When H2-dust opacity is significant, , and . The effective dissociation probability is the fraction of the total 912-1108 Å LW-band flux that is absorbed in H2 photodissociation events in a dusty optically thick and predominantly molecular slab (with vanishing HI-dust opacity). For low , is a constant. For high-, decreases as .
2.2.6 Formula for the H I Column Density
Returning now to Equation (25), it follows that
| (32) |
or,
| (33) |
Following S88 we now define the dimensionless parameter
| (34) |
where is the free-space dissociation rate 444In S88 was defined with the surface dissociation rate in the numerator. In this paper we adjust the definition and instead use , for a clear comparison of planar and spherical geometries as presented in §4. With this adjustment factors of appear in our formulae. , and we define the dimensionless “-integral”
| (35) |
We can then write
| (36) |
where
| (37) |
Given the “universal” dust-limited curve of growth - which can be computed “in advance” for any - the atomic column is then given by Equation (36) (or Equation [33]) for any surface dissociation rate (or ), rate cofficient , and density .
We refer to Equation (36) as the “semi-analytic integral HI-to-H2 profile”. It shows that the HI column at any depth depends on only two quantities - and . In dimensionless form
| (38) |
where is the dust optical depth associated with the molecular column, and is the HI-dust optical depth at .
As , . The total atomic column density is therefore finite, and is given by
| (39) |
or,
| (40) |
Here, the dimensionless parameter
| (41) |
is the limit of as , so that
| (42) |
We discuss these and additional expressions for in §2.2.6 below.
Equation (40) for the total HI column on one side of an optically thick cloud was first derived by S88 (see Equation [9] of that paper), and it is the fundamental relation in our analysis555The main goal and result of S88 was an analytic formula for the intensity of UV excited (fluorescent) IR H2 emission lines from photon-dominated regions (PDRs). Because the FUV-pumped H2 vibrational excitation rate is proportional to the dissociation rate, the IR intensity is proportional to the HI column density, as expressed in Equation [10] of that paper. . The basic assumption is that all of the dissociating LW-band radiation is absorbed, as in a classical “ionization-bounded” HII region or layer (Strömgren, 1939). However, because of the three-way competition between HI-dust, H2-dust, and H2-lines, the behavior for HI is more complicated than for HII. For a steady (dust-free) photoionized planar Strömgren layer the HII column equals the ratio of the Lyman continuum flux to the recombination rate, independent of the photoionization cross section. Similarly, in our Equations (39) or (40) the H2 line absorption cross section does not appear explicitly (although it is implicit in our definition of the effective dissociation flux). The HI column depends on the ratio of the effective dissociation flux to the H2 formation rate, but this ratio is multiplied by the dust absorption cross section and appears inside a logarithm. We discuss this behavior, and the connection to Strömgren relations, in our description of the weak- and strong-field limits in § 2.2.8.
In dimensionless form, the total HI-dust optical depth associated with the total atomic column is
| (43) |
The total HI-dust optical depth depends on the single dimensionless parameter constructed from the cloud variables , (or , or ) , , and (or which determines and ).
The total gas column . It therefore follows from Equation (36) that the atomic column as a function of the total (atomic plus molecular) column, , also depends on just and . Similarly, for the HI-dust optical depth depends on . Then, since it follows that the shapes of the HI-to-H2 transition profiles are for any invariant for identical .
In § 3.1.4 we present detailed numerical computations for the HI-to-H2 transition profiles. We show that the transitions are “gradual” when , and are “sharp” when . An essential feature of our derivation and analytic expression for the total HI column is that no assumptions need to be made on the shape of the HI-to-H2 transition profile. Our Equations (39) or (40) are universally valid for all profile shapes, gradual or sharp.
2.2.7
It is useful to consider the physical meaning of the dimensionless parameters and , and their product .
First, is the ratio of the unattenuated free-space H2 photodissociation rate to the H2 formation rate, and can be expressed as
| (44) |
Thus, is just the free-space atomic to molecular density ratio , and is the density ratio at the surface of an optically thick slab. For a characteristic interstellar cloud gas density cm-3, and with s-1, the atomic to molecular density ratio at the cloud edge in the absence of shielding, unless is unrealistically small. Conversion to the molecular phase in the ISM generally requires significant attenuation of the ambient and destructive radiation fields.
Now consider the parameter . Defining the H2-dust opacity , (see Equation [35])
| (45) |
Thus, is the average H2 self-shielding factor. The average is over an H2 column for which the H2-dust opacity . Thus, is the characteristic photodissociation rate for self-shielded H2 in a fully molecular cloud, prior to the onset of any H2-dust attenuation. Because is already for , the H2 molecules are very self-shielded for an H2-dust opacity , and is generally very small.
The product is then the atomic to molecular density ratio for the average shielded H2 dissociation rate. This is our first interpretation for (and as adopted in S88). If for the shielded dissociation rate, then HI-dust must also contribute to the attenuation of the LW-radiation since then within the H2-dust attenuation column. If , then HI-dust attenuation is negligible.
Alternatively, (Equation [41]) is the ratio of the UV continuum dust absorption cross section (cm2) to the total H2 line dissociation cross section (cm2 Hz) averaged over the effective dissociation bandwidth (Hz). Again, is generally very small because H2 line absorption is so much more efficient than dust absorption. Given cm2 (Equation [20]), and our expression (28) for , and with cm2 Hz, we have that
| (46) |
For example, for standard values, and , Equation (46) gives , and the shielded H2 dissociation rate s-1. For low-metallicity, small-, it follows that (or ). For high-metallicity, large-, , (or ).
Since is the free-space atomic-to-molecular density ratio we have that
| (47) |
where in the second and third equalities we have used the relations and . This gives our second interpretation for . It is the free-space ratio of the HI-dust to H2-line absorption rates of LW photons in the H2-dust-limited dissociation band.
Third, since (and ) we have that
| (48) |
Thus, is the free-space ratio of the dust absorption rate of the effective dissociation flux - per hydrogen atom - to the molecular formation rate per atom.
When , HI-dust plays no role anywhere in the cloud, since it is negligible even for the free-space field where the atomic density is largest. However, when , HI-dust becomes important and absorbs an increasing fraction of the LW photons that are otherwise available for H2 photodissociation.
Thus, with Equations (44) and (46),
| (49) |
Or, with Equation(48),
| (50) |
With Equations (4) or (5) for or , and Equations (20) and (21) for and we then have
| (51) |
For and varying the same way with there is a cancellation, but a metallicity dependence still remains via the dissociation bandwidth (Equation [29]) and its dependence on the competition between H2-dust and H2-line absorption. For low (complete line overlap limit, ), is independent of the metallicity, but for high , , and .
2.2.8 Weak- and Strong-Field Limits
Expression (51) also shows that the regimes of large and small are both relevant for the widely varying conditions in localized environments of the ISM in galaxies. For example, can range from at “average” locations to near hot stars, whereas can range from cm-3 in diffuse gas to cm-3 in dense molecular clouds. On global scales in star-forming galaxy disks and may be correlated (see § 2.2.9). But on small scales, enhanced radiation fields will not necessarily be offset by higher gas densities, and may span a wide range, from “large” to “small”.
For the absorption of the LW radiation is dominated by the combination of H2-line and H2-dust absorption, and HI-dust is negligible 666This limit is often referred to in the literature as the “self-shielding” limit. However, this is potentially confusing if self-shielding is properly understood to be associated with just H2-line absorption. As we have been emphasizing, H2-dust also absorbs and cannot be ignored for small , unless the metallicity is very low. So the weak-field limit may be referred to as the “H2-line plus H2-dust” shielding limit. . For HI-dust absorption dominates the attenuation of the radiation field. We refer to as the “weak-field-limit” and to as the “strong-field-limit”.
We now consider the behavior of in these two limits.
It follows from Equations (40) and (39) that for ,
| (52) |
So for weak fields, the total HI column density is equal to the ratio of the effective LW dissociation flux to the H2 formation rate (which is the removal rate of for the HI). The atomic column is proportional to the surface dissociation rate , (or to the field-strength ) and inversely proportional to the cloud gas density .
In the weak-field limit the HI-dust opacity associated with the total atomic column . We again see that HI-dust plays no role in attenuating the LW radiation field in this limit. For weak fields, the total HI column depends on only via , through the possible competition between H2-line and H2-dust absorption. For small- where H2-dust is negligible, dust absorption plays no role whatsoever, and is completely independent of . In the small- limit, , and the dust-absorption cross section cancels out completely. For , we then have that , and the metallicity dependence enters entirely via the H2 formation rate coefficient. For large-, H2-dust absorption is non-negligible, (and ) so scales as . Then with and we have that .
Expression (52) can be written as the simple “Strömgren relation” 777 This is analogous to the Strömgren expression, , for the column density, , of ionized hydrogen in a slab that fully absorbs a flux, , of Lyman continuum photons. Here is the electron density, and is the electron-proton recombination coefficient.
| (53) |
The effective dissociation flux on the right-hand-side is the rate per unit area at which dissociating photons (those absorbed in H2 lines but not by H2-dust) penetrate the cloud surface. By definition these photons are fully absorbed by the H2 when HI-dust is negligible, so this is also the photodissociation rate per unit surface area. In steady-state this must equal the total H2 formation rate per unit area, which is the left-hand-side.
For the strong-field limit it follows from Equation (40) that
| (54) |
For strong fields, , and the HI-dust opacity associated with the total atomic column contributes significantly to the attenuation of the incident LW flux. This leads to a saturation, and logarithmic dependence of the atomic column on the cloud parameters. For example, increasing the atomic column by increasing the LW-band flux also leads to more effective absorption of the LW photons by the larger HI-dust column. A decreasing fraction of the LW photons is then absorbed by the H2, and the growth of the atomic column is limited. Similarly, increasing the H2 formation rate reduces the atomic column, but the HI-dust opacity is then also reduced, which increases the LW fraction available for photodissociation, thereby moderating the reduction of the HI column.
If we neglect the logarithmic factor, then up to a factor of order unity, we have that
| (55) |
for intense fields. Indeed, if the attenuation is dominated by HI-dust the atomic column must approach a value such that . Then, if the HI column (neglecting the logarithmic factor). In the strong-field limit the metallicity dependence enters via the grain absorption cross section.
Finally, Equation (54) for the strong-field limit may also be expressed as the Strömgren relation 888To see this, note that when , .
| (56) |
Here
| (57) |
is a reduction factor that accounts for HI-dust attenuation of the effective dissociation flux. The right-hand-side of Equation (56), including the factor , is the H2 photodissociation rate per unit surface area, and this equals the total H2 formation rate per unit area, which is the left-hand side.
2.2.9 for Two-Phase Equilibria
Galaxy disks may be self-regulated such that the thermal pressures in the HI gas enable a cold/warm (CNM/WNM) two-phased mixture, with cold-neutral-HI (CNM) accumulating in the UV illuminated PDRs of the star-forming molecular clouds (Ostriker et al. 2010; Faucher-Giguère et al. 2013; Kim et al. 2013). As invoked by KMT/MK10, the ratio may then be restricted to a narrow range. This then gives rise to a characteristic for self regulated disks, as follows.
For a given heating rate, two-phased equilibrium occurs for a narrow range of thermal pressures and associated CNM and WNM densities, and , as controlled by the combined action of Ly and CII fine-structure emission line cooling, with a metallicity dependence via the abundance of the gas-phase carbon ions (Field et al. (1969),Wolfire et al. 2003). Given the FUV heating rates and the metallicity dependent emission-line cooling rates, the characteristic CNM density for two-phase equilibrium will be close to the minimum gas density for which CNM is possible. Wolfire et al. (2003) developed the analytic formula
| (58) |
for the characteristic CNM density, assuming that FUV grain photoelectric emission is the dominant heating mechanism for the gas. In this expression, is again the FUV intensity (normalized to the Draine field), is the metallicity, and is a factor of order unity. Following KMT/MK10 we set . This gives cm-3 for , at .
Most importantly, is proportional to . If the gas density in the FUV illuminated gas is set equal to , the ratio then depends on the metallicity only, as given by Equation (58). With Equation (51) we then have
| (59) |
for self-regulated systems. In Figure 1 the solid curve is versus as given by Equation (59) (assuming ). The dashed curve excludes the term that accounts for H2-dust reduction of the effective dissociation bandwidth (not considered by KMT/MK10 as discussed in §4). Remarkably, the enhanced associated with reduced cooling efficiency at low metallicity (Equation (58) is offset by the increased dissociation bandwidth at low . Thus, so long as grain photoelectric heating dominates we have that
| (60) |
for self-regulated systems, independent of . The expected HI columns are then midway between the weak- and strong-field limits.

2.3. Isotropic Fields
We now consider clouds illuminated by isotropic radiation fields.
Let be the specific LW photon intensity of an isotropic field, and let , where is the angle of an incident ray relative to the cloud normal. Again, we are assuming plane-parallel clouds. In the absence of dust, the photodissociation rate at a molecular column normal to the cloud surface may be written as
| (61) |
where is the uni-directional self-shielding function defined by Equation (16), and is the same effective “multi-line” curve-of-growth for the (dust-free) dissociating bandwidth that appears in Equation (11) for beamed fields. In Equation (61), the contribution to the angular-integrated dissociation rate is reduced by the self-shielding factor along each ray. Here, is the free-space specific intensity averaged over the dissociating transitions, as given by Equation (12).
With the inclusion of dust absorption along each ray, the HI/H2 formation-destruction equation at a molecular column is
| (62) |
Like Equation (24) for beamed fields, this is a differential equation for . However, because of the angular integration, the exponential term for the HI-dust attenuation along a ray cannot be moved to the left-hand-side as was done in Equation (24). To enable a separation of variables nevertheless, we replace the variable with some constant average in the HI-dust term, and we then move this term to the left-hand-side. For H2-dust attenuation on the right-hand-side we keep as a variable in the exponential term.
Making this approximation and integrating over the atomic and molecular columns gives,
| (63) |
where
| (64) |
For as defined by Equation (64), the integration variable is , and the integration is from 0 to . Thus, the that appears here is the same effective total H2-dust-limited dissociation bandwidth that we defined for beamed radiation in Equation (27) (and represented analytically by Equation [28]). The effective bandwidths are identical for isotropic and beamed fields because the relative fractions of LW photons absorbed by H2-lines versus H2-dust along a ray do not depend on the ray’s orientation. The product is then the effective dissociating flux for the isotropic field.
It follows from Equation (63) that the total HI column is given by
| (65) |
or
| (66) |
where again , and . The total HI-dust optical depth in the normal direction is then
| (67) |
Equations (65), (66), and (67) for isotropic fields are very similar to Equations (39), (40), and (43) for beamed fields. The values of are equal for corresponding beamed and isotropic fields (i.e., fields with the same ). Furthermore, is independent of the field geometry. A geometrical factor of appears for slabs irradiated by isotropic fields (as opposed to for beamed fields).
The average angle appears in Equations (65), (66), and (67) because the radiation fraction absorbed by HI-dust does depend on the field geometry, and is larger for isotropic fields for which the relative HI-dust attenuation is increased along inclined rays. In § 3.1.5 we calculate by fitting these analytic expressions to the results of our numerical computations for the atomic columns for isotropic fields. We find that universally and to an excellent approximation , independent of or , i.e. independent of the cloud parameters , , or .
We again consider the weak- and strong-field limits.
For weak fields (),
| (68) |
and the HI-dust opacity is negligible and plays no role in attenuating the LW flux. The total atomic column depends on only via the dissociation bandwidth , i.e. via the competition between H2-line and H2-dust absorption. As for beamed radiation, Equation (68) is a simple Strömgren relation, and is equal to the ratio of the effective dissociation flux (or dissociation rate per unit surface area) to the H2 formation rate. In the weak-field-limit, and for a given and , i.e., for a given (or , or ), , , and (or ) the atomic column for isotropic radiation is equal to half that produced by a corresponding beamed field. This is simply due to the factor-of-two difference in the LW photon fluxes for corresponding isotropic versus beamed fields for a given field strength .
In the strong-field limit, ,
| (69) |
For strong fields, and the HI-dust opacity is significant, and dominates the attenuation of the radiation. As for beamed fields, the total atomic column saturates, and is insensitive to the cloud parameters except for . Up to the logarithmic factor of order-unity we then have
| (70) |
Because the saturation columns are only slightly smaller for isotropic versus beamed fields for large , and they are not very different.
3. Numerical Model Computations
With our analytic results (§ 2) in mind we now present detailed numerical calculations for the HI-to-H2 transition profiles and the associated build-up of the atomic-hydrogen columns, for planar clouds illuminated by either beamed or isotropic far-ultraviolet LW-band radiation fields. For this purpose we use the Meudon PDR code999Publically available at http://pdr.obspm.fr (Le Petit et al., 2006) for the computation of the UV radiative transfer and depth-dependent photodissociation rates, and for the steady-state atomic and molecular hydrogen gas densities. The code implements the “extended spherical harmonics” method (Flannery et al., 1980; Goicoechea & Le Bourlot, 2007) for an exact numerical solution of the coupled H2-line and dust scattering and absorption radiative transfer. An adaptive frequency grid is employed with sufficient resolution () to capture the contributions of the narrow H2-line Doppler cores and broad wings to the the total ultraviolet opacities. The competition between dust absorption and scattering and H2-line-absorptions and the important effects of H2-line overlap are included in the calculation of the local radiation field intensities and H2 photodissociation rates.
A principal feature of the Meudon PDR code is that the radiative transfer can be calculated for either beamed or isotropic fields. We assume the Draine spectrum (Equation [2]) and we calculate models for beamed and isotropic configurations. As defined in §2.2, for corresponding beamed and isotropic fields the radiation energy densities at the cloud surfaces are identical (§2.1). We compare our numerical results to the analytic formulae discussed above.
One of our main goals is the accurate computation of the effective H2-dust-limited dissociation band-width (Equation [27]) summed over all of the LW-band absorption lines, for a wide range of FUV-absorption dust cross sections (as set by the metallicity ). We also calculate HI-to-H2 transition profiles and the resulting atomic-hydrogen columns from the weak- to strong-field limits (small to large ), for both beamed and isotropic fields, and for a wide range of metallicities.
For computational efficiency in our large parameter-space and for direct comparisons to our analytic formulae, we have made several simplifying assumptions and modifications to the standard Meudon PDR code. First, instead of considering a full range of grain sizes and wavelength dependent absorption/scattering properties we assume a single representative for each metallicity (as given by Equation [20]) independent of photon frequency within the narrow LW-band. We assume pure forward scattering by the grains, and neglect the (small) effects of back-scattering discussed by Goicoechea & Le Bourlot (2007). Thus, our enters as a simple effective absorption cross section. We have verified by spot checks within our parameter-space that our assumption of a constant alters the results for the computed HI columns by no more than 10% for any metallicity compared to computations incorporating a standard grain-size distribution.
Second, we decouple the HI/H2 formation-destruction equation from the complex gas and grain networks that govern the heavy-element chemistry. We assume that the H2 is formed on grain-surfaces only with a rate-coefficient as given by Equation (21), and is destroyed only by (depth-dependent) LW photodissociation. We exclude gas-phase formation, e.g., via the sequence , 101010 With our assumption that the grain surface H2 formation rate coefficient is linearly proportional to the metallicity, the gas phase formation routes become important for , depending on the temperature and fractional ionization, , of the gas. For an estimate of the effective rate coefficient, , for H2 formation via the negative-ion intermediary, see e.g., Eq. A7 of MK10, cm3 s-1. , or destruction by cosmic-ray or X-ray secondary-ionization (and we set the ionization rate equal to zero). Thus, at depths where the LW radiation field is fully absorbed the atomic density vanishes, and the entire HI column is maintained by photodissociation.
Third, we consider isothermal clouds rather than solving a heating-cooling equation for the gas temperature . Our standard is K for which the H2 formation rate-coefficient cm3 s-1 for . And fourth, we assume that the total hydrogen nucleon density, , is a constant independent of cloud depth, so that the local H2 formation rate (s-1) is also constant for any given model.
Fifth, we ignore absorption by neutral atomic carbon (CI) in the H2 photodissociation layers. The carbon (continuum) photoionization band 1100-912 Å coincides almost exactly with the LW-band for H2 photodissociation, and CI, H2, and dust compete for the same photons. The carbon photoionization cross section is cm2 (van Dishoeck et al. 2006), so that the CI opacity , where is the hydrogen gas column, is the gas phase carbon abundance for solar () metallicity, and is the fraction of carbon present in atomic form. For , is competitive with the dust opacity . However, the carbon is primarily C+ and is generally very small, in the dust-limited or H2-line-limited absorption layers in which the HI columns are built up, as follows. In the absence of dust or H2 absorption, and assuming that CI absorbs the entire LW flux in maintaining an outer and optically thick C+ zone, then , where is the ionizing photon flux (Equation [3]), cm3 s-1 is the electron-carbon recombination rate-coefficient (Wolfire et al. 2008), is the volume density of C+ ions, is the length-scale of the optically thick C+ Strömgren layer, and is the hydrogen gas column associated with the C+ layer. We are assuming that the carbon ions are neutralized by recombination with free electrons, and that . However, if the dust opacity associated with this gas column is large, i.e., if , then the C+ layer is limited by dust and CI absorption may be ignored. The condition may be expressed as , or cm3, or . Thus, unless is unusually small, CI absorption is negligible. Using our PDR code, and turning on the effects of additional C+ neutralization processes such as dust-assisted recombination and chemical removal processes, we find that even for the CI absorption is less than a 10% effect for , and is negligible for larger .
Sixth, we ignore HI Lyman-series line absorption of the LW-band photons. These atomic lines (beginning with at 1026 Å) do appear within the molecular LW absorption band (e.g., Draine & Bertoldi 1996), and the Meudon PDR code includes them. However, very large atomic columns are required for the atomic-line equivalent widths to contribute significantly to the absorption. We find that an HI column of cm-2 is required for the summed equivalent widths of the -series lines to equal half the LW bandwidth (most of this absorption is due to just ). Such large HI columns are produced only for very small values of and , even in the strong-field large limit. For example, for it follows from Equation (40) that cm-2 requires cm2, or . Thus, for the relevant range of metallicities, the atomic line absorptions can be ignored, and we exclude them in the radiative transfer.
With the above assumptions, the basic inputs to the code are the intensity, , and spectral shape of the radiation field (we assume the Draine representation, Eq. [2]), in either a beamed or isotropic configuration, the total gas density , the associated H2 formation rate (temperature and metallicity dependent), and the dust-grain absorption cross section (metallicity dependent). The dimensionless parameter is formed from these cloud variables as described in §2.2.5 and 2.2.6.
For any set of parameters the critical numerical computation is for the depth-dependent line-plus-continuum absorptions and the attenuation of the H2 photodissociation rate. For the H2, our code includes all 302 ro-vibrational levels in the ground electronic state, and the entire matrix of Lyman and Werner transitions to discrete levels in the excited and states. We exclude transitions with energies greater than the hydrogen ionization energy of 13.59 eV. (As is standard, we assume that any ionizing photons are always absorbed in adjacent HII regions outside of the PDRs). Our code includes transitions out of excited -levels of the -state. However, for almost all conditions of interest and throughout most of the HI-to-H2 transition zones the dominating line absorptions are from the lowest few rotational levels (=0 to 5) levels of the level 111111Photodissociation out of excited vibrational levels becomes significant when and the UV excitation rates becomes comparable to the quadrupole vibrational decay rates (Shull, 1978). However, even for such intense fields, the excitation rates become small as the lines rapidly become optically thick, and for most of the HI layer absorption out of excited vibrational states is negligible (S88). . Thus, the relevant UV transitions lie between 1108 and 912 Å, and this is the wavelength range of our “standard LW-band”.
The fractional populations, , of the levels in the -state are computed assuming population and depopulation by the upward and downward - and - transitions, quadrupole radiative (cascade) transitions between the -state levels, and excitations and deexcitations in collisions with He, H+, H, and other H2 molecules. We use the Abgrall et al. (1993b) and Abgrall et al. (1993a) Lyman- and Werner-band oscillator strengths and transition wave-numbers, and the Abgrall et al. (2000) probabilities for spontaneous radiative dissociations from the individual ro-vibrational levels in the excited and states. For the radiative quadrupole transitions we use the Einstein-A values computed by Wolniewicz et al. (1998). For the collisional processes we use the ro-vibrational state-to-state rate coefficients reported in Le Bourlot et al. (1999) and Wrathmall et al. (2007) in their study of H2 excitation in astrophysical media.
As an example of our radiative transfer computations we show in Figure 2 the energy density (erg cm-3 Å-1) at a cloud column depth cm-2, or (), for cm2 () for a model computation with (beamed), and cm-3, or . At this depth the cores of the individual absorption line are very optically thick, but the continuum between the lines has not yet been significantly attenuated by overlapping line wings. Around 80 strong lines are visible in Figure 2, consistent with our analytic estimate for the number of lines involved in the photodissociation process, as discussed in § 2.2.1.

3.1. Results
We now present our numerical code results for (a) the unattenuated free-space H2 photodissociation rate; (b) the curves-of-growth for the H2-dust-limited dissociation bandwidth ; (c) the total dissociation bandwidth ; (d) the self-shielding function ; and (e) the mean self-shielding factor . We then present HI-to-H2 transition profiles and total integrated HI columns, for beamed and isotropic fields, for a range of and metallicities .
3.1.1 Free-Space H2 Photodissociation Rate
The optically thin (full ) free-space H2 photodissociation rate, , is a fundamental parameter for ISM and galaxy evolution studies, and we have recalculated it here for the Draine FUV spectrum (Equation [2]). In Table 1, and for , we list the free-space UV-excitation rates, (s-1) out of the 14 lowest-lying H2 ro-vibrational levels. Each rate is summed over all upward LW transitions. We also list the mean dissociation probabilities , averaged over all of the transitions, and the resulting dissociation rates, (s-1) out of each level. Our numbers are consistent with Draine & Bertoldi (1996) (see their Table 2) who used our basic input molecular data sets.
| () | (cm-1) | (s-1) | (s-1) | |
|---|---|---|---|---|
| (0,0) | 0.000 | 4.71(-10) | 0.117 | 5.51(-11) |
| (0,1) | 118.505 | 4.75(-10) | 0.119 | 5.65(-11) |
| (0,2) | 354.363 | 4.83(-10) | 0.123 | 5.94(-11) |
| (0,3) | 705.567 | 4.95(-10) | 0.130 | 6.44(-11) |
| (0,4) | 1168.825 | 5.11(-10) | 0.145 | 7.41(-11) |
| (0,5) | 1740.277 | 5.30(-10) | 0.141 | 7.47(-11) |
| (0,6) | 2414.852 | 5.57(-10) | 0.160 | 8.91(-11) |
| (0,7) | 3187.691 | 5.86(-10) | 0.160 | 9.38(-11) |
| (0,8) | 4051.884 | 6.19(-10) | 0.175 | 1.08(-10) |
| (1,0) | 4161.259 | 7.14(-10) | 0.051 | 3.64(-11) |
| (1,1) | 4273.913 | 7.21(-10) | 0.055 | 3.97(-11) |
| (1,2) | 4497.992 | 7.31(-10) | 0.057 | 4.17(-11) |
| (1,3) | 4831.595 | 7.43(-10) | 0.057 | 4.24(-11) |
| (0,9) | 5002.162 | 6.58(-10) | 0.197 | 1.30(-10) |
The total dissociation rate is weighted by the population fractions , but is insensitive to the gas temperature or density when the excitation is mainly out of the lowest few -levels. For between 10 to K, and for ranging from 10 to cm-3, we find that to within at most a variation s-1 for . The dissociation rate is essentially proportional to the field intensity. For very intense fields the rate is increased by enhanced excitation of the rotational states and photodissociation out of these states by photons longward of 1108 Å, outside our nominal LW band. For K, and cm-3, we find that for from to , s-1, where the “rotational excitation factor” increases from 1 to 1.5 for this range of field intensities. We have also computed the mean flux density in the free-space radiation field, as defined by Equation (12). For the Draine spectrum we find that photons cm-2 s-1 Hz-1, for the same range of , , and . For the analysis we present in § 2, we assume .
3.1.2 and
As discussed in § 2.2.4, the “H2-dust-limited dissociation bandwidth” (Equation [26]) is a fundamental quantity for the HI-to-H2 transitions and the build-up of the HI column densities.
In Figure 3 we plot our curve-of-growth computations for integrated over all of the LW-band absorption lines, for ranging from to cm2, corresponding to metallicities from 0.01 to 10. We set the Doppler- parameters for all of the lines equal to a typical ISM cloud value of km s-1. Our results are insensitive to the precise choice for because the dominant absorption lines are very highly damped. We extract the curves from our numerical radiative transfer computations for the radiation flux absorbed in the lines, self-consistently accounting for the flux reduction due to the presence of H2-dust. For any , the curve-of-growth depends primarily on the internal molecular oscillator strengths, line-profile cross-sections, and dissociation probabilities for the excited states. We have verified by explicit computations that is indeed very insensitive to external cloud parameters such as the field intensity and/or gas density , or temperature . The curves-of-growth are also insensitive to the rotational-level distributions and ortho-to-para H2 ratio. The specific curves displayed in Figure 3 were extracted from model runs with , cm-3, and K, and for a constant ortho-to-para ratio set equal to 3 (with H+–H2 proton exchange reactions turned off).
For cm-2, all of the lines are optically thin, and increases linearly with . Between and cm-2 the growth is logarithmic as the Doppler cores become optically thick. At larger columns, increases more rapidly again as absorptions start occurring out of the line wings. For between and cm-2 we find that grows as , a bit more slowly than for a single damped line (for which it would be ).
saturates at sufficiently large H2 columns. When H2-dust is negligible the entire LW-band is absorbed in fully overlapping lines, and reaches a maximal value of Hz, for cm-2. In Figure 3 the absorption is essentially dust-free for cm2 since the lines overlap before the H2-dust opacity becomes significant, and for that (blue) curve (see § 2.2.1 and 2.2.4). For larger , and for , the asymptotic is limited by H2-dust opacity.
Figure 4 shows our results for the “total dust-limited bandwidth” (Equation[27]) for from to cm2. The points are our numerical results, and the solid curve is our analytic representation
| (71) |
as already introduced in §2. This expression is accurate to within 4% compared to the numerical results. The transition from the line-overlap to H2-dust limited regimes (small- to large-) occurs at cm2. Line overlap is just starting to become important for solar () metallicities. For a fully molecular slab, most of the LW-band radiation is absorbed by H2-dust for . For most of the radiation is absorbed in H2-lines. Our results show that the regimes of small- and large- are both relevant for the realistic range of metallicities in galaxies.

To a good approximation for large as indicated by our numerical results and Equation (28). This is the expected scaling for a single (effective) damped absorption line in competition with H2-dust (see § 2.2.4). We adopt for large for our analytic scaling relations in § 2, although grows somewhat more slowly with than for a single line.
3.1.3 Self-Shielding Function and G(Z’)
By definition, the H2 “self-shielding function” where is the dissociation bandwidth for vanishing (see Equation [16]).
In Figure 5 we plot (solid curve) our numerically computed derivative . We also plot (dashed) the Draine & Bertoldi (1996) fit (their Equation [37]) for the shielding function, given by
| (72) |
where and cm s-1 (we assume ).

It is evident that our computed shielding function is in excellent agreement with this formula.
At low the lines are optically thin and . As the line cores become optically thick for cm-2 the molecules “self-shield” and decreases. By cm-2, . Between and cm-2, the shielding function declines as , as expected given the (integral) behavior of in this range. Finally, at larger columns drops sharply as the lines fully overlap. As found by Draine & Bertoldi (1996) the reduction due to line overlap sets in at a column of cm-2. We again see that attenuation due to line overlap becomes important for . For such metallicities H2-dust opacity becomes significant only at columns cm-2 at which point the lines have already overlapped and the LW photons fully absorbed.
In Figure 6 we plot the “average self-shielding factor”, (Equations [41] or [45]), as a function of the metallicity, assuming cm2 (). The points are our numerical results, and the curve is our analytic fitting formula Equation (46). As expected, for low-metallicity (full overlap) , but for high metallicity due to the H2-dust cutoff. For , 1, 0.1, and 0.01, we find that equals , , , and . For these metallicities the average self-shielded dissociation rates are , , , and s-1. As discussed in §2.2.6 the average is over an H2-dust optical depth . For low-metallicities becomes very small because the LW radiation is fully absorbed in lines at very low H2-dust optical depths.

3.1.4 HI-to-H2 Transition Profiles
We now present illustrative computations for the HI-to-H2 transition profiles for a range of spanning the weak- to strong-field limits, and for metallicities from high to low, for beamed and isotropic fields.
As discussed in § 2.2.5, for a given the profile shapes, i.e. the density ratios and as functions of the total gas column (where ), depend on just the single dimensionless parameter . This includes the locations of the HI-to-H2 transition points. We define the transition point as the cloud depth where . For both beamed and isotropic fields we compute five transition profiles for , 0.1, 1, 10 and 102, for and cm2 (). These sequences illustrate the change in profile shapes, from “gradual” to “sharp”, from the weak-field (HI-dust negligible) to strong-field limits (HI-dust dominant). In these computations as appropriate for , and we set s-1 (), and cm3 s-1 ( K). To alter and we vary from to cm-3.
For each we plot the atomic and molecular fractions, and , as functions of the total (atomic plus molecular) column density, . For fully atomic gas , and for fully molecular gas . For each model we also plot the normalized atomic column, , also as a function of . Thus, at sufficiently large cloud depths where the LW radiation is fully absorbed. The curves for show how and where the atomic column is built up relative to the atomic-to-molecular transition points.
Figure 7, left panels, display the HI-to-H2 transition profiles for the five beamed-field models with varying .
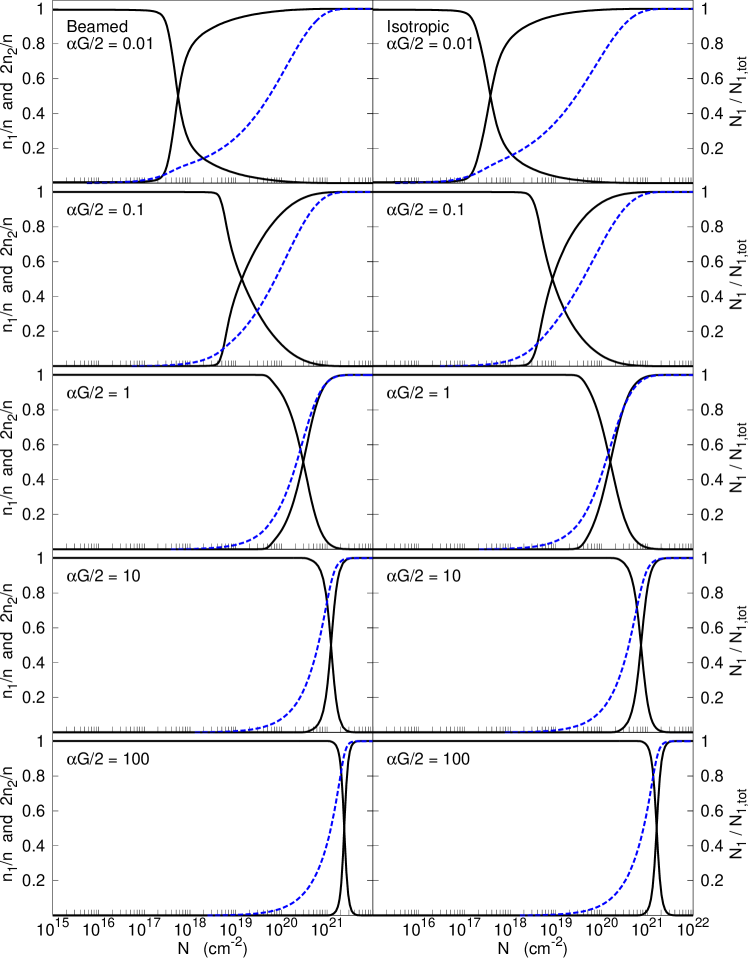
Several important features can be seen in these plots. First, the atomic to molecular transition points move deeper into the cloud with increasing . For , 0.1, 1, 10, and 102, the total gas columns at the transition points equal , , , , and cm-2. For the assumed cm2 these columns correspond to total dust optical depths , , , , and . The HI-dust optical depths at the transition points are , , 0.45, 2.1, and 4.2. In the weak-field limit, the transition depths increase rapidly with . In the strong field limit the UV penetration is moderated by HI-dust absorption and the transition depths increase slowly.
Second, the profile shapes vary with . In the weak-field limit the atomic to molecular conversion is controlled by H2-line self-shielding, but significant HI exists beyond the transition point up to the H2-dust cut-off. In the weak-field limit most of the HI column is built up past the transition point where the gas is predominantly molecular. In the strong-field limit the transition point is controlled by (exponential) HI-dust absorption, and most of the HI is built up in an outer full atomic layer. Thus, in the weak-field limit the transitions are gradual, and in the strong-field limit the transitions are sharp. For example, at the HI-to-H2 transition points the normalized atomic column , , , and , from small to large . For , 92% of the total atomic column is built up past the transition point inside the molecular zone. For , only 8% of the atomic column is produced past the transition point.
Figure 7, right panels, show the transition profiles for isotropic fields for ranging from 0.01 to 100, for and cm2. As for the beamed-field models the shapes of the profiles vary from gradual to sharp from the weak- to strong-field limits. The transition gas columns are , , , , and cm-2, or , , 0.30, 1.4, and 3.0. The normalized atomic columns at the transition points are , 0.23, 0.59, 0.82, and 0.90. The HI-dust opacities are , , 0.24, 1.2, and 2.8.
For fixed but varying and we expect the profile shapes to be weakly dependent on the dust optical depth , and for the UV penetration scale-lengths and transition gas columns, , to vary simply as or . This behavior is illustrated in the upper panel of Figure 8 showing four transition profiles for , 1, 0.1, and 0.01 (again for beamed fields). For clarity we only plot the atomic curves. For these models we set , 1.30, 1.28, and 1.12, as given by Equation (59) for self-regulated multi-phased gas. Because is about the same for these models the profile shapes are indeed very similar, and the transition columns grow inversely with . For these four models, , , , and cm-2, corresponding to dust opacities , 0.70, 0.76, and 0.78. The HI-dust opacities at the transition points are 0.46, 0.56, 0.63, and 0.70. This behavior is in excellent agreement with the analytic theory presented in § 2. For two-phased equilibrium for all metallicities, and is intermediate between the weak- and strong field-limits for which HI-dust opacity is just becoming significant.
Figure 8, lower panel, shows the curves for , 1, 0.1, and 1, for the isotropic-field models, with as for the beamed-field models. Again, because is about the same for all four models the profile shapes are very similar. The transition point columns are , , , and cm-2, or , 0.36, 0.40, and 0.42. The HI-dust optical depths at the transition points are 0.25, 0.29, 0.33, and 0.37.
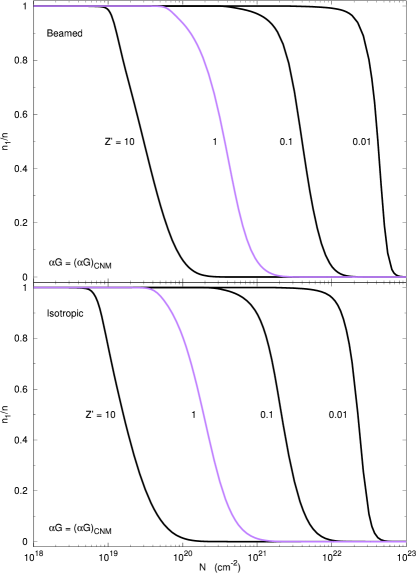
The transition columns and optical depths for all of the isotropic-field models are smaller than for the beamed-field models because of the factor-of-two reductions in the incident fluxes for corresponding isotropic fields with the same .
3.1.5 Total HI Columns
A key goal is the computation of the total atomic column densities, , for beamed and isotropic fields for a comparison to our analytic formulae.
In Figure 9, upper panel, we display for beamed fields, as a function of spanning the range from 0.01 to 100, for , 1, 0.1, and 0.01.
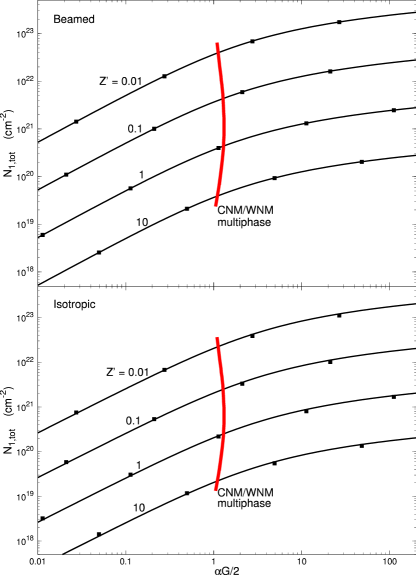
For our numerical models we again set s-1, cm3 s-1 and vary the gas density (to select ) and we set cm2. For the given input parameters , , , and , we compute the total integrated atomic column density, and also calculate and the associated average self-shielding factor . For each model we compute for the corresponding and . The points in Figure 9 are our model results for selected and . Again, for the four metallicities, , , , and . The curves in Figure 9 are as given by our fundamental analytic formula for beamed fields
| (73) |
where cm-2 as for the numerical models.
Our analytic and numerical results are in excellent agreement from the weak- to strong-field regimes. For weak fields (high gas densities) (Equation [52]). In this regime the total atomic column is proportional to the field intensity (dissociation flux) and varies inversely with the gas density. For strong fields (low densities) the dependence is logarithmic and (Equation [54]). In this regime the atomic column is weakly dependent on , and is limited to values close to due to the dominating HI-dust absorption. For example, for and , 0.1, 1, 10, and 100, our model computations give , , , , and cm-2, as also given by our analytic formula.
Expressed as a function of , . However, we recall that for large- () is itself metallicity dependent and (see Equation [51]). Thus, for high metallicities in the weak-field limit . In this regime the column decreases by one power of due to the enhanced H2 formation efficiency, and by an additional factor of due the reduction of the effective dissociation flux by the H2-dust. For low metallicities in the weak-field limit the dissociation flux is maximal and . In the strong field limit the atomic column is only weakly (logarithmically) dependent on , and the metallicity dependence is mainly via the HI-dust opacity, and for all metallicities. These metallicity scalings, discussed in § 2.2.8, are validated by our numerical model results for the atomic column.
In Figure 9 we also plot a (red) curve for as given by Equation (59) for self-regulated multi-phased HI. As is again illustrated in Figure 9, . Given the assumptions underlying Equation (59), the HI columns for self-regulated multi-phased gas are intermediate between the linear (weak-field) and logarithmic (strong-field) regimes for all metallicities.
Our computational results show that our analytic expression for is valid for all transition profile shapes, whether gradual (weak fields) or sharp (strong fields), and no matter where the atomic column is built up, whether in the molecular zone or in the outer fully atomic layer. Indeed, in our analytic derivation we did not make any assumptions on the profile shape. Our expression is universal and valid for all regimes, weak- and strong-fields, high- and low-metallicities, and for all transition profile shapes, gradual and sharp. We emphasize this point again in our alternate derivation via the KMT/MK10 “transfer-dissociation-equation” (§ 4.1.1).
In Figure 9, lower panel, we plot the total atomic columns for our isotropic-field models. For these models we select and , and vary to set , and we compute the total HI column. As discussed in §3.2, the total dust-limited dissociation bandwidth, , and the average self-shielding factor, , are identical for beamed and isotropic fields. In Figure 12 we plot as a function of , where for each we use the computed using beamed fields. Again, ranges from 0.01 to 100, and we present results for from 10 to 0.01. The curve is also displayed. In Figure 9, the points are our numerical results, and the curves are as given by our fundamental analytic formula for isotropic fields (§ 2.3)
| (74) |
where again cm-2. To obtain the match between the numerical results and analytic formula shown in Figure 9 we have fit for the average-angle-factor . We find that
| (75) |
provides an excellent fit for all and for all .
For isotropic fields in the weak-field limit (Equation [68]). As discussed in § 2.3, this is half the column for the corresponding beamed field due to the factor-of-two difference in the incident dissociation fluxes. For weak-fields, is independent of . In the strong-field limit, (Equation [69]) and the column is reduced by the factor compared to beamed-field models (neglecting the small difference in the logarithms). For example, for and 0.1, 1, 10, and 100, our model results for the total atomic column are , , , , and cm-2, smaller in the expected way compared to beamed-field models. The linear and logarithmic behaviors for small and large and the scaling with are identical for isotropic and beamed fields.
Our expression for the total column for isotropic fields is also valid for all profile shapes, from gradual to sharp.
4. Comparison to KMT/MK10
In a series of papers, Krumholz et al. (2008, 2009) and McKee & Krumholz (2010), (hereafter KMT/MK10) considered the interstellar atomic-to-molecular transition in the context of galaxy-wide conditions for star-formation. For this purpose, KMT/MK10 developed analytic models for the HI-to-H2 transitions in spherical clouds irradiated by isotropic radiation fields. They also considered planar models. KMT/MK10 were particularly interested in exploring the role of metallicity in setting star-formation thresholds, and in MK10 they applied their spherical models to compute metallicity-dependent H2 mass fractions in star-forming clouds as functions of the gas-mass surface densities in galaxy disks. The integral H2 mass fraction, , may be a critical parameter in galaxy-wide Kennicutt-Schmidt (KS) relations, especially if conversion to H2 is required for star-formation121212For example, in the expression the molecular fraction enters as a threshold, and the star-formation rate is quenched as becomes small. In this form of the KS relation is the star-formation rate per unit mass surface density, is the total gas mass surface density, is the dynamical time, and is the star-formation efficiency per-dynamical time.. For spheres, , where and are the molecular and total gas masses within the volumes. For slabs where and are the molecular and total gas mass surface densities in the normal directions.
The assumption of spherical versus plane-parallel geometry complicates the analysis and computation of the HI-to-H2 transition because for spheres oblique rays cross through the clouds even when optically thick H2 cores are present. Optically thick slabs are simpler because all rays are absorbed. To proceed, KMT/MK10 made the simplifying assumption that the HI-to-H2 transitions are always sharp, such that any atomic layer has a well-defined length-scale. For the spheres, fully atomic and dusty HI shells are then assumed to surround fully molecular H2 cores. Rays that cross through the HI shells are either unattenuated or are absorbed by dust, or by H2-lines under the assumption that the molecular fractions in the shells are small. Rays that impinge on the H2 cores are fully attenuated. MK10 employ a “variable Eddington factor” formalism to close the angular moments of the radiative transfer equation for the radiation fields in the HI shells. For a given total cloud mass and radiation field intensity a complicated iterative procedure then yields the spherical and nested HI/H2 structures, and associated H2 mass fractions.
KMT/MK10 implicitly assumed that the H2 lines are always in the fully overlapping regime, independent of and , and they did not consider the possible reduction of the effective dissociation bandwidth by H2-dust. KMT/MK10 did not make the distinction between HI-dust and H2-dust that we have been emphasizing.
According to KMT/MK10, the spherical HI/H2 “shell-core” structures depend on two dimensionless parameters, “” and “”. In their definition, “ is the ratio of the number of LW photons absorbed by dust to the number absorbed by H2”, where is the fraction of gas in atomic form. As we clarify below, is actually identical to our - in the low-, small-, () limit where H2-dust absorption is negligible. The second parameter, , is the “dust optical depth associated with the cloud radius ”, where is the hydrogen nucleon density at the cloud surface. For a slab (of finite width) the corresponding second parameter is the total dust optical depth through the slab, where is the linear extent. The parameters and will enter into our discussion of the H2 mass fractions for spheres and slabs (§4.2).
We wish to compare our analytic theory for the HI column densities for planar clouds to the KMT/MK10 formulae for spheres. This will enable us to also compare results for the H2 mass fractions. We will show that any differences between corresponding (i.e., properly normalized) slabs and spheres are very small and that it is therefore advantageous to use our much simpler and fully analytic plane-parallel formalism.
We start (in §4.1) by clarifying the relationship between the KMT/MK10 and our . To do this we reanalyze the “transfer-dissociation equation” presented by Krumholz et al. (2008). This also enables a comparison of our formulae for the HI columns to KMT/MK10’s similar, though not identical, expressions for the atomic columns for planar geometry. In §4.2.1 we develop a simple expression for for optically thick slabs for two-sided irradiation using our analytic expressions for the total HI-dust optical depths for one-sided irradiation of semi-infinite clouds, for isotropic or beamed fields. In §4.2.2 we re-express the MK10 formulae for uniform density (isochoric) spheres and (isobaric) “atomic-molecular complexes”, for (a) the critical HI-dust optical depths required for the formation of H2 cores and (b) the H2 mass fractions as functions of the total cloud optical depths (or gas masses). This will enable a clear comparison to our expressions for slabs.
We find that for corresponding spheres and slabs embedded in isotropic fields the predicted HI columns are very similar. The differences are no greater than 20% for ranging from 0.01 to 100. For two-phased HI equilibria for which , the differences between spheres and slabs are negligible, and the HI columns for spheres and slabs are essentially identical. In fact, we show that switching from a beamed to an isotropic field for a slab is much more significant than switching from a slab to a sphere for a fixed isotropic field. We then show that for proper normalization of the three configurations - uniform sphere, complex, or slab - the predicted H2 mass fractions as functions of total cloud masses or columns are also very similar.
4.1. and .
To clarify the relationship between the KMT/MK10 and our , it is useful to consider the “transfer-dissociation equation” developed by Krumholz et al. (2008), here for beamed radiation into a slab. This discussion will also provide an alternate derivation of our fundamental formula (Equation [40]) for the total HI column density.
4.1.1 Transfer-dissociation Equation
Let be the flux density (photons cm-2 s-1 Hz-1) at frequency of beamed LW radiation at linear depth into a slab. The radiation flux (cm-2 s-1) between frequencies to is then
| (76) |
At the cloud surface , where is the flux-integral (our Equation [3]) for the free-space radiation field.
The transfer equation for is
| (77) |
Here is the total (atomic plus molecular) hydrogen gas volume density, and is the (“complicated”) cross-section for the multi-line H2 absorption process 131313 The product is the total dissociation cross section (Equation[13]), § 2.2.1). . The first term on the right-hand side of Equation (77) is the dust absorption rate of the local radiative flux. The second term is the H2-line absorption rate.
The steady-state H2 formation-destruction equation is
| (78) |
where in this expression, (as defined in §2) is the mean fraction of all H2-line absorptions that lead to photodissociation. Following Krumholz et al. (2008) and our discussion in § 2, we assume that is independent of cloud depth.
The “complicated” integral in Equation (77) may be eliminated to give the transfer-dissociation equation (Krumholz et al., 2008)
| (79) |
In dimensionless form
| (80) |
where , is the normalized depth-dependent flux, is the dust optical depth, and is the depth-dependent fraction of gas in atomic form.
In Equation (80)
| (81) |
This is the KMT/MK10 , here introduced for one-sided irradiation of a slab by a beamed field with incident LW flux 141414When Krumholz et al. (2008) defined their via the transfer-dissociation equation they wrote the surface flux in the numerator, rather than the full- free-space . However, when discussing spherical models, KMT/MK10 redefine their and replace with in the numerator. In this paper we use the free-space throughout, including here in our discussion of the transfer-dissociation equation. With this adjustment a factor of 2 appears in the second term on the right-hand side of Equation (80), not there in Krumholz et al. (2008). . Comparing to our Equation (48) it is already clear that , for .
Because the product is the dust absorption rate per-unit-volume of the surface LW radiation flux, and because is the H2-line absorption rate per-unit-volume, KMT/MK10 interpret as the ratio of the number of LW photons absorbed by dust to the number absorbed by H2-lines at the optically thin cloud surface (with one factor of canceling when doing the division). In this interpretation, the dust absorption being referred to in the numerator is independent of whether the gas is atomic or molecular.
However, as we now show, if the dust absorption term in the transfer-dissociation equation is redefined to refer to HI-dust absorption only, we will recover our fundamental formula for the the HI column density, including a method for “renormalizing” the dissociation flux to account for H2-dust absorption. We demonstrate this by analyzing the transfer-dissociation equation, in three steps as follows.
4.1.2 Step 1: Transition Assumed Sharp
First, we assume - as done by KMT/MK10 - that the atomic-to-molecular transition is always sharp. We impose this assumption even though we know that it is good only if our , i.e., only if and are sufficiently large. Nevertheless, in seeking a solution for Equation (80), we assume that for any the atomic fraction everywhere is non-zero, up to the (unknown) transition point where vanishes. At that point the gas switches suddenly from HI to H2.
Setting , the solution to Equation (80) is
| (82) |
It is evident that the flux vanishes for where
| (83) |
and this is then the solution for the transition point (Krumholz et al., 2008). The total atomic column density up to the transition point is
| (84) |
because by assumption there is no H2 in the photodissociated layer and is the optical depth due to HI-dust only.
We immediately recognize Equations (83) and (84). They are identical to our expressions (40) and (43) for the total HI-dust optical depth and HI column density, except that here the argument is , as given by Equation (81), rather than our as defined by the similar but not quite identical Equation (48). Indeed, it is apparent that , where is the normalized effective dissociation bandwidth as defined by Equation (31). (This identity is clarified in Step 3.)
For , the attenuation of the LW flux is dominated by dust absorption, and . An exponentially attenuating flux is precisely what produces a sharp transition profile. Therefore, for the assumption that the transition is sharp is consistent. Furthermore, the exponential attenuation is due specifically to HI-dust absorption. Sharp profiles occur when HI-dust dominates the attenuation.
For , dust absorption is negligible compared to H2-lines, throughout the atomic layer, and to first-order in . For small , Equation (83) gives , so that
| (85) |
in this limit. However, when H2-lines dominate the attenuation the transition is not sharp, and the assumption that is inconsistent.
Nevertheless, as we now show in Step 2, the above expressions for , , and for large and small are valid for any varying , whether or not the HI/H2 transition is sharp, provided that H2-dust is always negligible compared to HI dust or H2-lines, so that in Equation (80) can be redefined as the optical depth associated with HI-dust absorption only151515 Indeed, we know that our Equations (40) and (43) are valid for all , whether or not the HI-to-H2 transition is sharp. This suggests that although we assumed to derive Equations (83) and (84), they are valid even when is small and the transition is not sharp. .
4.1.3 Step 2: H2-Dust Negligible, and Redefined
With the neglect of H2-dust absorption, Equation (79) is
| (86) |
where now has been replaced by in the first term on the right-hand side. Or,
| (87) |
where is again given by Equation (81), but where now
| (88) |
is defined in advance as the optical depth associated with HI-dust only.
In Equations (86) and (87) a factor does not appear. The solutions are still given by Equations (84) and (85) for large and small , but now with no assumptions on the shapes of the transition profiles.
For large the transition is sharp because the radiation flux is attenuated exponentially by the HI-dust, as shown in Step 1. However, for low , for which is small, the transition need not be sharp. In this limit we again have,
| (89) |
But this is just a Strömgren relation (as also noted by MK10). Therefore, it must hold independent of the shape of the HI/H2 profile provided only that the entire incident dissociation flux, , is fully absorbed by H2-lines, which it indeed will be for small . Again, is the integrated H2 formation rate per unit area, and in steady-state this equals the fully absorbed dissociation flux impinging on the surface, independent of profile shape. In fact, we know that for low (i.e., for small and ) the transition profile is gradual, with most of the HI column built up in the molecular zone, as we have shown and discussed in §3.
4.1.4 Step 3: H2-Dust and Renormalization of the Dissociation Flux
We now include H2-dust. In Equations (79) and (80), the original dust absorption term, , is not necessarily negligible - even when - if the atomic fraction is sufficiently small. This is the regime where H2-dust absorption may be significant, even if HI-dust is negligible.
Due to H2-dust absorption of radiation “between the lines”, not all of the photons in the LW-band are absorbed by the H2, even for a fully molecular slab. The effective dissociation flux is then smaller than . The Strömgren relation then implies that for the total HI-dust optical depth must be smaller than , rather than equal to as given by Equation (89).
If is redefined to refer to HI-dust only as in Step 2, the effect of H2-dust absorption can be included in the transfer-dissociation equation by a simple “renormalization” of the effective dissociation flux. We replace with a suitably reduced equal to the flux of LW photons absorbed in H2-lines in a dusty molecular slab, excluding in advance photons that are inevitably absorbed by H2-dust. The renormalization factor can be computed in advance for any given , and we immediately recognize as the (normalized) effective dissociation bandwidth that we defined and computed in § 2 and § 3.
The transfer-dissociation equation for the renormalized LW flux is
| (90) |
where again the dust term on the right-hand-side refers to HI-dust absorption only. Photons absorbed by H2-dust anywhere in the slab are excluded from consideration “in advance”.
In dimensionless form
| (91) |
where , , and
| (92) |
We see that is just our , (Equation [48]) Thus,
| (93) |
as already indicated in Step 1.
Most importantly, in Equations (90) and (91) a factor “” does not appear at all. The solution is
| (94) |
where is the HI-dust optical depth, and with no assumptions on the shape of the HI-to-H2 transition profile. The flux vanishes for =, where
| (95) |
and the expression for the total atomic column is then
| (96) |
We have thus recovered our original expressions (39) and (40) for the total atomic column and HI-dust opacity for beamed radiation into a slab. It is again clear that these expressions are general. They are valid for large or small , (strong- or weak-fields), for the regimes of significant HI-dust and/or H2-dust absorption, and are independent of the profile shapes, gradual or sharp. We also have in Equation (94) a closed-form expression for the depth-dependent LW-band flux as a function of the HI-dust optical depth.
We again see that is the fundamental dimensionless parameter. Physically, is the ratio of the HI-dust to H2-line absorption rates of the effective dissociation flux, excluding any LW photons that are absorbed by H2-dust. The relationship between and our is now clear. Specifically, , where, crucially, our factor accounts for H2-dust absorption, and the resulting reduction of the effective dissociation flux. In the low-, small- limit, H2-dust is negligible, , and . For high- and large-, (decreasing as or as ), and then . KMT/MK10 did not make the distinction between HI-dust and H2-dust, and ignored the effects of H2-dust entirely in their definition of . As we have discussed in § 2 and 3, H2-dust can reduce the effective dissociation bandwidth by a factor for the (realistic) range of metallicities in galaxies.
In Figure 10 we again schematically summarize the four regimes that are incorporated by our formula for the total HI column density. In each quadrant, large or small , for large or small , we indicate the shape of the HI-to-H2 transition (sharp or gradual), the dominant source of opacity (HI-dust, H2-lines, or H2-lines plus H2-dust), and the expression for the HI-dust opacity in terms of the parameters , , , and .
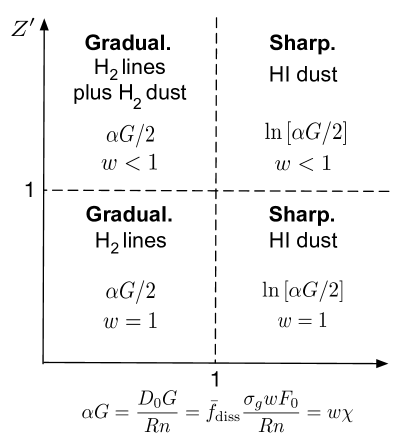
4.2. Critical HI-dust Opacities and H2 Mass Fractions: Slabs Versus Spheres
4.2.1 Slabs
Given our expressions (Equations [40] or [65]) for the total HI-dust optical depths in semi-infinite slabs we can write down a simple formula for the integrated H2 mass fraction, , for planar geometry, for a comparison to the KMT/MK10 results for spheres. Our main focus is a comparison of slabs and spheres irradiated by isotropic fields, but we also consider beamed radiation for slabs.
For an isotropic field with a given a uniformly illuminated sphere corresponds to two-sided irradiation of a slab of finite width, with properly normalized total optical depths for the sphere and slab. For a slab with total dust thickness (where is the total gas column density in the normal direction) the H2 mass fraction is simply
| (97) |
where , and is the HI-dust depth summed over both sides of the slab (the superscript “p” indicates plane-parallel slab). By definition, . We plot versus in Figure 11.

For optically thick slabs in which the radiation incident on both sides is fully absorbed, and for illumination by isotropic fields, where
| (98) |
This is twice the optical depth given by our Equation (66) for one-sided illumination of a semi-infinite slab. (We have set , as found in § 3.) For beamed radiation where
| (99) |
given our Equation (39) for one-sided illumination (the superscript “b” is for beamed radiation). We plot and versus in Figure 12.
For two-sided illumination of optically thick slabs, Equation (97) for together with Equations (98) or (99) for the total HI-dust optical depths may be used to compute the integral H2 mass fractions whether the HI-to-H2 transitions are gradual or sharp. For , an optically thick slab consists of a simple HI-H2-HI sandwich structure, with two fully atomic layers outside an inner H2 zone, with sharp transitions between the atomic and molecular layers. For sharp transitions a “critical” optically thick slab occurs for for which an H2 layer just appears at the midplane, and or are then the critical HI-dust optical depths. The planar sandwich for sharp transitions corresponds to the spherical core-shell structures considered by KMT/MK10, as illustrated in Figure 13.

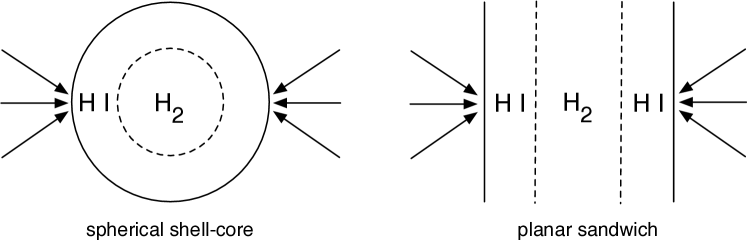
4.2.2 Spheres
MK10 carried out their iterative radiative transfer procedure to compute spherical HI-shell H2-core structures for two types of systems. First, they considered “uniform density” spheres for which the density of hydrogen nuclei, , is constant through the spheres as in our slabs. Second, they considered “atomic-molecular complexes” in which the H2 gas density, , is ten times the atomic density, , for approximate pressure equilibrium between the shells and the cores. MK10 then presented fitting formulae (their Equations [82] and [93]) for in uniform density spheres and complexes, as functions of their cloud parameters and .
We can re-express the MK10 formulae for as simple functions of , similar to our Equation (97) for slabs. For spheres , where is the area-averaged total dust column density of the sphere, where is the average gas column density, is the cloud radius, and is the mean particle mass per hydrogen nucleon. For a uniform density sphere, the total optical depth . For a complex, , where is the gas density in the atomic shell. The parameter is defined such that the total optical depth is normalized relative to the critical (area-averaged) dust depth required for the appearance of an H2 core at . The critical depths are auxiliary quantities also computed by MK10 for the uniform density spheres and complexes, assuming irradiation by isotropic radiation fields. The for spheres correspond to our for two-sided illumination of slabs by isotropic fields. In our terminology, these are the (total) HI-dust optical depths in spheres and slabs. For sharp transitions these are critical optical depths.
The MK10 fitting formula (their Eq. [82]) for the H2 mass fraction in uniform density spheres may be rewritten as161616 This follows from MK10 Eq. (82) for , where is the scaled radius of the H2 core in a uniform density cloud. For a critical cloud , and this occurs when their , where . This gives our expression (101) for the critical depth where we have replaced with our . Our expression (100) is then MK10 Eq. (82), where .
| (100) |
(where the superscript “s” is for spheres). Their critical HI-dust optical depth is
| (101) |
Again, in Equation (100) . In Figures 11 and 12 we plot versus , and versus , for comparisons to our expressions for slabs.
For complexes, the MK10 fit formula for the H2 mass fraction (their Eq. [93]) may be rewritten as171717 For MK10 Eq. (93) for the complexes their just vanishes for the critical value , where and is the total area-averaged dust optical depth of the complex (MK10, Eq. [91]). This again gives our expression (101) for the critical depth . Our expression (102) is then MK10 Eq. (93), where their .
| (102) |
(The superscript “c” is for complexes.) Fully atomic complexes and uniform density spheres are identical, so the critical HI-dust depth for complexes is also given by Equation (101). Due to the compression of the molecular gas the functional form for is altered compared to uniform density spheres, and the factor in the denominator of Equation (100) is replaced by unity in Equation (102). We also plot for the complexes in Figure 11.
Figure 12 shows the similarity in the critical HI-dust optical depths for slabs and spheres. For isotropic fields, and for ranging from 0.01 to 100, the differences are no greater than 25%. Furthermore, Figure 12 shows that switching from isotropic to corresponding beamed radiation for a slab is in fact much more significant than switching from a slab to a sphere for an isotropic field.
For isotropic fields, the HI-dust optical depths for slabs and complexes are equal for , so for two-phased HI equilibrium () the differences between the HI-dust optical depths for spheres and slabs are negligible. Any further differences between spheres and slabs arise only because of remaining small differences in the functional forms for .
Figure 11 shows the similarity and small differences in for slabs, uniform-density spheres, and complexes, as given by Equations (97), (100), and (102). For slabs, our formula (97) for is unaltered if the molecular gas is assumed to be denser than the atomic gas, and there is no distinction between uniform-density and isobaric conditions. The differences are all small. For example, for a spherical complex compared to a slab, the percentage difference in is at most 40% at .
4.2.3 H2 Mass Fractions and Star-Formation Thresholds in Self-Regulated Gas
If H2 is a requirement for star-formation we may define the cloud gas column at which as the “star-formation threshold”. This is a plausible definition for sharp HI-to-H2 transitions for which a “sterile” atomic layer is well defined. As given by Equations (97), (100), and (102), for , 2.93, and 2.5, for slabs, uniform density spheres, and complexes. We define as the threshold gas mass surface density for which .
For estimates of metallicity-dependent H2 mass fractions and star-formation thresholds in Kennicutt-Schmidt relations for galaxy disks we adopt the KMT/MK10 “self-regulation” ansatz that the HI in star-forming clouds is typically driven to the CNM densities/pressures required for two-phase equilibria as set by the stellar FUV radiation fields. Thus, for any we assume that (Equation [59]). Because to 2 for all the HI-to-H2 transitions are sharp to a good approximation (as argued by KMT/MK10). For our slabs we therefore assume HI-H2-HI sandwich structures, for which critical optically thick slabs occur at (as discussed in §4.2.1).
We present four sets of computations to compare results for spheres versus slabs.
First, in Figure 14, panel (a), we use Equations (102) and (101) to reproduce the MK10 results for for spherical atomic-molecular-complexes (Fig. 5 in MK10). Here, is the area-averaged gas mass surface density where is the mean particle mass per hydrogen nucleus and is the area-averaged dust opacity. Thus, in Equation (102) where , and where is given by Equation (101) for each . We set g as appropriate for a cosmic hydrogen-helium mixture. KMT/MK10 assume that the dust cross section scales with metallicity as cm2, so we set our (see Equation [20]). MK10 also implicitly assume that H2-dust absorption is negligible for all so we exclude our H2-dust term, , in the denominator of Equation (59). The resulting curves for as functions of (M⊙ pc-2) are displayed in Figure 14 for ranging from 0.01 to 10. They are a precise reproduction of the MK10 results (their Fig. 5). For example, with the above assumptions, gives so that , and a molecular core appears () for pc-2. The star-formation threshold () is then pc-2. For smaller (larger) the curves shift to the right (left) exactly as in Fig. 5 of MK10.
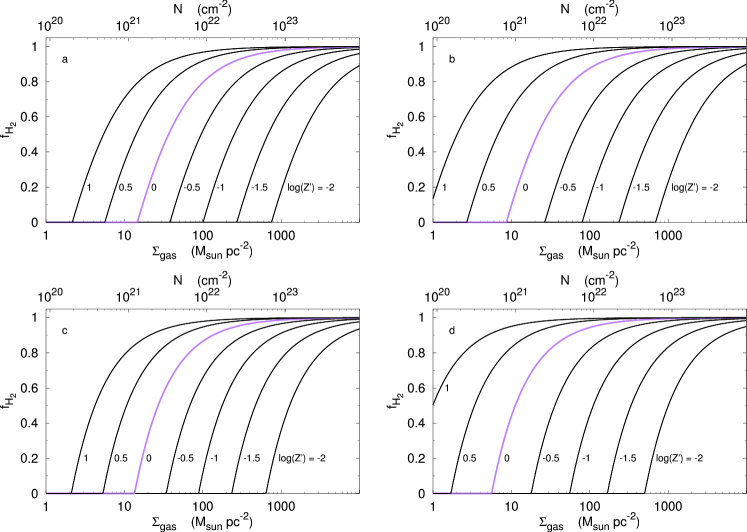
Second, in Figure 14, panel (b), we show results for spherical complexes, again with , but now with the H2-dust term included in the estimate for . As expected, for very low the curves and the corresponding star-formation thresholds are unaltered, since this is the complete line-overlap regime for which H2-dust is negligible. However, for the curves start to shift to the left and the thresholds are reduced to smaller gas mass surface densities. These shifts are due to the reductions of the effective dissociation fluxes by the non-negligible H2 dust opacities. For example, when H2-dust is included for we have that (for ) so that , and the H2 core appears at pc-2, and pc-2. The inclusion of H2-dust in the estimate for modifies the MK10 results for solar and super-solar metallicities.
Third, in Figure 14, panel (c), we again adopt the MK10 assumptions, and negligible H2-dust for any , but for slabs instead of spheres, and we use Equation (97) to compute . Here, where is the total dust depth of the slab, so that where , and the critical HI-dust optical depth is given by Equation (98) for each . We have already seen that the functional forms for the mass fractions are very similar for complexes and slabs (with at most a difference at ) and that the critical HI-dust columns are essentially equal for (as for self-regulated gas). It is therefore not surprising that the curves for slabs are almost identical to the MK10 results in Figure 14. For , we again have that so that , so that H2 appears for M⊙ pc-2 and the star-formation threshold () is at M⊙ pc-2. For metallicities , the neglect of H2-dust in setting is more significant than switching from spherical to plane-parallel cloud geometry.
In Figure 14, panel (d), we again present results for slabs, but now with our preferred and somewhat larger cm2 (), and with the inclusion of H2-dust absorption in setting . The curves and thresholds are shifted to lower gas mass surface densities compared to Figure 14. For , we now have given that , so that H2 appears at M⊙ pc-2 and the star-formation threshold surface gas mass density is M⊙ pc-2.
Finally, in Figure 15 we plot for the above four model sets. At any the star-formation thresholds vary by factors of 2 to 3 for the four model assumptions, for between 0.01 and . Again, we are assuming that for which the critical HI-dust optical depths are all of order unity. The threshold gas mass surface densities therefore scale as , and we have that
| (103) |
For , the star-formation thresholds are of order 10 M⊙ pc-2.
The predicted HI columns and star-formation thresholds appear consistent with observations, at least for solar metallicity systems. For example, in a recent GALFA-HI study of the HI-to-H2 transition on sub-parsec scales in the Perseus giant molecular cloud, Lee et al. (2012) find an almost constant HI surface density, of M⊙ pc-2, in each of the mapped sub-regions. For , this is consistent with the HI columns expected for of order unity, including conditions appropriate for two-phased equilibrium. Thus, Perseus is in the HI-dust limited and strong-field regime. On larger scales, Leroy et al. (2008) find a mean total gas column of 14 M⊙ pc-2 at the HI-to-H2 transition radii (see their Table 5) in their analysis of the HI and CO distributions in the THINGS and HERACLES galaxy surveys. The observed threshold column density of 14 M⊙ pc-2 is in harmony with our 1D predictions or the spherical KMT/MK10 models (see Figure 15). However, in this interpretation there must be typically one primary UV absorbing cloud (GMC) per line of sight in the galaxy surveys, with negligible additional diffuse H I, since our predicted thresholds are for single cold clouds.
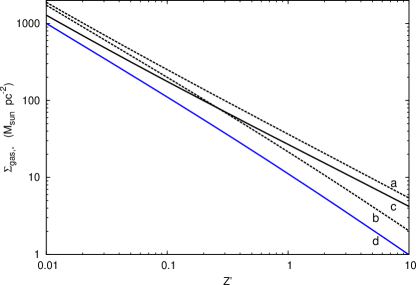
5. Recap and Summary
In this paper we have presented analytic theory and numerical computations for the atomic-to-molecular (HI-to-H2) transitions, and the build-up of atomic hydrogen (HI) gas columns, in the PDRs of optically thick interstellar clouds illuminated by photodissociating far-ultraviolet Lyman-Werner (LW) radiation fields. We have focussed on simple idealized uniform density (1D) planar slabs that fully absorb the incident radiation. This enables a Strömgren type analysis (Sternberg 1988, “S88”) for the total steady-state column density of HI that is maintained by the incident photodissociating flux. The behavior is more complicated than for classical (dust-free) photoionized HII regions, (a) because H2 photodissociation is a (multi)-line absorption process, and (b) because of the generally inevitable competition between H2-line, H2-dust, and HI-dust absorption of the LW photons.
As discussed in § 1, the HI-to-H2 transition in interstellar gas has been investigated by numerous authors over many years with varying levels of analytic and numerical sophistication. In this paper we extend the analytic theory developed in S88, and consider 1D slabs irradiated by either beamed or isotropic fields. The beamed configuration is appropriate for clouds near a localized radiation source. Isotropic irradiation may be more appropriate for ambient or “global” conditions in galaxies. In our theoretical development we make the important distinction between HI-dust and H2-dust absorption, not previously discussed in the literature. The three-way competition between HI-dust, H2-dust and H2-line absorption determines the behavior and dependence of the atomic column density on the environmental parameters.
Our analytic formulae and results are developed in § 2, and verified in § 3 with detailed numerical radiative transfer computations, including for the H2-dust limited dissociation bandwidth. In § 4 we compare our results to models that assume spherical symmetry.
To conclude this paper we recap our basic results:
The fundamental dimensionless parameter in the problem is
(See also expressions [49] and [50]). Here, is the free-space FUV intensity (relative to the Draine field), is the free-space (optically thin) H2 photodissociation rate (s-1), is the total hydrogen gas volume density (cm-3), is the H2 formation rate coefficient (cm3 s-1), (dimensionless) is the mean self-shielding factor, is the far-UV continuum dust absorption cross section (cm2), is the mean photon flux density (cm-2 s-1 Hz-1) in the (912-1108 Å) LW band, is the total LW photon flux (cm-2 s-1), is the mean dissociation probability, is the metallicity relative to solar, is the total H2-dust limited dissociation bandwidth (Hz), (dimensionless) is the normalized bandwidth, and is a factor of order unity depending on the dust-grain absorption properties. The final dependence of on is via the metallicity-dependent dissociation bandwidth (see Equation [29]).
For two-sided illumination of an optically thick slab by beamed radiation, our analytic expression for the total atomic (HI) column density is (see Equation [40]),
or as a mass surface density (including a factor of 1.4 for helium)
For two-sided irradiation by an isotropic field (see Equation [66]),
(where ), or
These expressions are generally valid for all regimes, from the weak- to strong-field limits (small and large ), for all HI-to-H2 transition profile shapes (gradual or sharp), and for arbitrary metallicity (small or large).
For an optically thick cloud with total gas mass surface density , the integral molecular (H2) gas fraction is
with as given above for either beamed or isotropic fields. In Figure 14 (panel [a] versus [c]) we compare our results for 1D slabs to the H2 mass fractions for spheres. The differences are very small.
Our formulae for the HI columns and H2 mass fractions may be incorporated easily into hydrodynamics simulations for galaxy evolution.
For the HI-to-H2 transitions are gradual, and the atomic columns are built up in the predominantly molecular portions of the cloud. For the transitions are sharp, and the HI is built up in outer fully atomic layers. For sharp transitions, the HI-H2-HI sandwich structure for slabs corresponds to HI-shell/H2-core structures for spheres. If star-formation requires the conversion to H2, then a threshold surface density, , may be defined at which the molecular fraction . For and sharp transitions we then have that .
For self-regulated galaxy disks (ala KMT/MK10) in which the HI is driven to two-phased thermal equilibrium (and heated by FUV photoelectric emission from dust-grains) the dimensionless parameter is restricted to a narrow range close to , where
independent of the metallicity . For such self-regulated systems, our theory then predicts a metallicity dependent HI-to-H2 star-formation threshold for individual clouds
This appears consistent with Galactic and extragalactic observations, at least for solar metallicity systems.
Appendix A Glossary of Symbols
Table 2 is a glossary of symbols we have used in this paper. In this listing we also refer to the Equations in which the various symbols appear and/or are defined.
| Symbol | Definition | Units |
| far-UV specific photon intensity. | photons cm-2 s-1 Hz-1 sr-1 | |
| free space far-UV specific intensity (Eq. [2]). | photons cm-2 s-1 Hz-1 sr-1 | |
| intensity scaling factor relative to the unit free-space Draine field. | … | |
| flux density, . | photons cm-2 s-1 Hz-1 | |
| mean flux density in LW band (Eq. [12]). | photons cm-2 s-1 Hz-1 | |
| free-space LW band photon flux integral (Eqns. [3] and [4]). | photons cm-2 s-1 | |
| beamed photon flux density at linear depth in a slab. | photons cm-2 s-1 Hz-1 | |
| beamed photon flux at linear depth in a slab (Eq. [76]). | photons cm-2 s-1 | |
| H2 photodissociation cross section at frequency (Eqns. [7] and [77]). | cm2 | |
| individual H2 line photodissociation cross section (Eq. [9]). | cm2 Hz | |
| H2 photodissociation cross section summed over all lines (Eq. [13]). | cm2 Hz | |
| depth-dependent H2 photodissociation rate. | s-1 | |
| free-space H2 photodissociation rate (Eq. [5] and [15]). | s-1 | |
| H2 photodissociation rate at the surface of a optically thick slab (Eq [6]). | s-1 | |
| LW photon H2 pumping rate out of ro-vibrational level (Table 1). | s-1 | |
| mean dissociation probability out of level (Table 1). | … | |
| mean dissociation fraction per absorbed LW photon (Eq. [18]). | … | |
| far-UV grain absorption cross section per hydrogen nucleon (Eq. [20]). | cm2 | |
| order-unity grain composition factor. | … | |
| metallicity relative to solar abundances. | … | |
| grain-surface H2 formation rate coefficient (Eq. [21]). | cm3 s-1 | |
| gas temperature. | K | |
| atomic hydrogen (HI) volume density. | cm-3 | |
| molecular hydrogen (H2) volume density. | cm-3 | |
| total hydrogen gas volume density, . | cm-3 | |
| HI column density. | cm-2 | |
| H2 column density. | cm-2 | |
| hydrogen gas column density, . | cm-2 | |
| dust opacity in normal direction. | … | |
| total HI column density on one side of an optically thick slab. | cm-2 | |
| HI-dust opacity in normal direction. | … | |
| H2-line-overlap-limited dissociation bandwidth. | Hz | |
| H2-dust-limited dissociation bandwidth. | Hz | |
| total H2-dust-limited dissociation bandwidth. | Hz | |
| normalized H2-dust-limited dissociation bandwidth (Eq. [29]). | … | |
| H2 self-shielding function (Eqns. [16] and [72]). | … | |
| mean ray-angle factor for HI-dust opacity (Eqns. [63] and [75]). | … | |
| free-space atomic-to-molecular density ratio (Eqns. [34] and [44]). | … | |
| mean self-shielding factor (Eqns. [41], [45]-[48]). | … | |
| fundamental dimensionless parameter for the HI-to-H2 transition (Eqns. [49]-[51]). | … | |
| CNM gas density for multi-phased HI equilibrium (Eq. [58]). | cm-3 | |
| for two-phase HI equilibrium (Eq. [59]). | … | |
| H2 mass surface density in plane-parallel slab. | M⊙ pc-2 | |
| total gas mass surface density in plane-parallel slab. | M⊙ pc-2 | |
| H2 gas mass within sphere. | M⊙ | |
| total gas mass within sphere. | M⊙ | |
| total dust optical depth through slab of finite linear width z. | … | |
| dust optical depth along radius of a sphere. | … | |
| total dust optical depth normalized to the HI-dust optical depth (Eq. [97]). | … | |
| HI-dust optical depth, finite slab, two-sided-irradiation, isotropic (Eq. [98]). | … | |
| HI-dust optical depth, finite slab, two-sided-radiation, beamed (Eq. [99]). | … | |
| mean HI-dust optical depth, sphere, isotropic irradiation (Eq. [101]). | … | |
| H2 mass-fraction for slab (Eq. [97]). | … | |
| H2 mass fraction for uniform density sphere (Eq. [100]). | … | |
| H2 mass fraction for spherical atomic-molecular complex (Eq. [102]). | … | |
| Star-formation threshold gas surface density at which . | M⊙ pc-2 |
References
- Aaronson et al. (1974) Aaronson, M., Black, J. H., & McKee, C. F. 1974, ApJ, 191, L53
- Abel et al. (1997) Abel, T., Anninos, P., Zhang, Y., & Norman, M. L. 1997, Nature, 2, 181
- Abgrall et al. (1992) Abgrall, H., Le Bourlot, J., Pineau Des Forets, G., et al. 1992, A&A, 253, 525
- Abgrall et al. (2000) Abgrall, H., Roueff, E., & Drira, I. 2000, A&AS, 141, 297
- Abgrall et al. (1993a) Abgrall, H., Roueff, E., Launay, F., Roncin, J. Y., & Subtil, J. L. 1993a, A&AS, 101, 273
- Abgrall et al. (1993b) Abgrall, H., Roueff, E., Launay, F., Roncin, J. Y., & Subtil, J. L. 1993b, A&AS, 101, 323
- Ahn et al. (2009) Ahn, K., Shapiro, P. R., Iliev, I. T., Mellema, G., & Pen, U.-L. 2009, ApJ, 695, 1430
- Albornoz Vásquez et al. (2014) Albornoz Vásquez, D., Rahmani, H., Noterdaeme, P., et al. 2014, A&A, 562, A88
- Allen et al. (1986) Allen, R. J., Atherton, P. D., & Tilanus, R. P. J. 1986, Nature, 319, 296
- Allen et al. (1997) Allen, R. J., Knapen, J. H., Bohlin, R., & Stecher, T. P. 1997, ApJ, 487, 171
- Andersson et al. (1992) Andersson, B.-G., Roger, R. S., & Wannier, P. G. 1992, A&A, 260, 355
- Andersson & Wannier (1993) Andersson, B.-G. & Wannier, P. G. 1993, ApJ, 402, 585
- Barlow & Silk (1976) Barlow, M. J. & Silk, J. 1976, ApJ, 207, 131
- Bigiel et al. (2008) Bigiel, F., Leroy, A., Walter, F., et al. 2008, AJ, 136, 2846
- Bisbas et al. (2012) Bisbas, T. G., Bell, T. A., Viti, S., Yates, J., & Barlow, M. J. 2012, MNRAS, 427, 2100
- Black & Dalgarno (1976) Black, J. H. & Dalgarno, A. 1976, ApJ, 203, 132
- Black & Dalgarno (1977) Black, J. H. & Dalgarno, A. 1977, ApJS, 34, 405
- Black & van Dishoeck (1987) Black, J. H. & van Dishoeck, E. F. 1987, ApJ, 322, 412
- Blitz & Rosolowsky (2004) Blitz, L. & Rosolowsky, E. 2004, ApJ, 612, L29
- Blitz & Rosolowsky (2006) Blitz, L. & Rosolowsky, E. 2006, ApJ, 650, 933
- Bohlin et al. (1978) Bohlin, R. C., Savage, B. D., & Drake, J. F. 1978, ApJ, 224, 132
- Bok et al. (1955) Bok, B. J., Lawrence, R. S., & Menon, T. K. 1955, PASP, 67, 108
- Böker et al. (2003) Böker, T., Lisenfeld, U., & Schinnerer, E. 2003, A&A, 406, 87
- Bolatto et al. (2011) Bolatto, A. D., Leroy, A. K., Jameson, K., et al. 2011, ApJ, 741, 12
- Bromm et al. (2009) Bromm, V., Yoshida, N., Hernquist, L., & McKee, C. F. 2009, Nature, 459, 49
- Browning et al. (2003) Browning, M. K., Tumlinson, J., & Shull, J. M. 2003, ApJ, 582, 810
- Burton et al. (1990) Burton, M. G., Hollenbach, D. J., & Tielens, A. G. G. M. 1990, ApJ, 365, 620
- Burton et al. (1978) Burton, W. B., Liszt, H. S., & Baker, P. L. 1978, ApJ, 219, L67
- Cardelli et al. (1989) Cardelli, J. A., Clayton, G. C., & Mathis, J. S. 1989, ApJ, 345, 245
- Carruthers (1970) Carruthers, G. R. 1970, ApJ, 161, L81
- Cazaux & Tielens (2002) Cazaux, S. & Tielens, A. G. G. M. 2002, ApJ, 575, L29
- Christensen et al. (2012) Christensen, C., Quinn, T., Governato, F., et al. 2012, MNRAS, 425, 3058
- Ciardi et al. (2000) Ciardi, B., Ferrara, A., & Abel, T. 2000, ApJ, 533, 594
- Crighton et al. (2013) Crighton, N. H. M., Bechtold, J., Carswell, R. F., et al. 2013, MNRAS, 433, 178
- Cui et al. (2005) Cui, J., Bechtold, J., Ge, J., & Meyer, D. M. 2005, ApJ, 633, 649
- Dalgarno (2006) Dalgarno, A. 2006, Proceedings of the National Academy of Science, 103, 12269
- Davé et al. (2013) Davé, R., Katz, N., Oppenheimer, B. D., Kollmeier, J. A., & Weinberg, D. H. 2013, MNRAS, 434, 2645
- de Jong (1972) de Jong, T. 1972, A&A, 20, 263
- de Jong et al. (1980) de Jong, T., Boland, W., & Dalgarno, A. 1980, A&A, 91, 68
- Diaz-Miller et al. (1998) Diaz-Miller, R. I., Franco, J., & Shore, S. N. 1998, ApJ, 501, 192
- Dijkstra et al. (2008) Dijkstra, M., Haiman, Z., Mesinger, A., & Wyithe, J. S. B. 2008, MNRAS, 391, 1961
- Draine (1978) Draine, B. T. 1978, ApJS, 36, 595
- Draine (2003) Draine, B. T. 2003, ARA&A, 41, 241
- Draine (2011) Draine, B. T. 2011, Physics of the Interstellar and Intergalactic medium (Princeton University Press)
- Draine & Bertoldi (1996) Draine, B. T. & Bertoldi, F. 1996, ApJ, 468, 269
- Elmegreen (1993) Elmegreen, B. G. 1993, ApJ, 411, 170
- Elmegreen & Elmegreen (1987) Elmegreen, B. G. & Elmegreen, D. M. 1987, ApJ, 320, 182
- Faucher-Giguère et al. (2013) Faucher-Giguère, C.-A., Quataert, E., & Hopkins, P. F. 2013, MNRAS, 433, 1970
- Federman et al. (1979) Federman, S. R., Glassgold, A. E., & Kwan, J. 1979, ApJ, 227, 466
- Feldmann et al. (2012) Feldmann, R., Hernandez, J., & Gnedin, N. Y. 2012, ApJ, 761, 167
- Fialkov et al. (2012) Fialkov, A., Barkana, R., Tseliakhovich, D., & Hirata, C. M. 2012, MNRAS, 424, 1335
- Field et al. (1969) Field, G. B., Goldsmith, D. W., & Habing, H. J. 1969, ApJ, 155, L149
- Field et al. (1966) Field, G. B., Somerville, W. B., & Dressler, K. 1966, ARA&A, 4, 207
- Fitzpatrick (1999) Fitzpatrick, E. L. 1999, PASP, 111, 63
- Flannery et al. (1980) Flannery, B. P., Roberge, W., & Rybicki, G. B. 1980, ApJ, 236, 598
- Foltz et al. (1988) Foltz, C. B., Chaffee, Jr., F. H., & Black, J. H. 1988, ApJ, 324, 267
- France et al. (2013) France, K., Nell, N., Kane, R., et al. 2013, ApJ, 772, L9
- Fu et al. (2010) Fu, J., Guo, Q., Kauffmann, G., & Krumholz, M. R. 2010, MNRAS, 409, 515
- Fukui et al. (2014) Fukui, Y., Okamoto, R., Kaji, R., et al. 2014, ApJ, 796, 59
- Fumagalli et al. (2010) Fumagalli, M., Krumholz, M. R., & Hunt, L. K. 2010, ApJ, 722, 919
- Ge & Bechtold (1997) Ge, J. & Bechtold, J. 1997, ApJ, 477, L73
- Genzel et al. (2012) Genzel, R., Tacconi, L. J., Combes, F., et al. 2012, ApJ, 746, 69
- Genzel et al. (2013) Genzel, R., Tacconi, L. J., Kurk, J., et al. 2013, ApJ, 773, 68
- Gillmon & Shull (2006) Gillmon, K. & Shull, J. M. 2006, ApJ, 636, 908
- Gillmon et al. (2006) Gillmon, K., Shull, J. M., Tumlinson, J., & Danforth, C. 2006, ApJ, 636, 891
- Gir et al. (1994) Gir, B.-Y., Blitz, L., & Magnani, L. 1994, ApJ, 434, 162
- Glassgold & Langer (1974) Glassgold, A. E. & Langer, W. D. 1974, ApJ, 193, 73
- Glover & Brand (2003) Glover, S. C. O. & Brand, P. W. J. L. 2003, MNRAS, 340, 210
- Glover et al. (2010) Glover, S. C. O., Federrath, C., Mac Low, M.-M., & Klessen, R. S. 2010, MNRAS, 404, 2
- Gnedin et al. (2009) Gnedin, N. Y., Tassis, K., & Kravtsov, A. V. 2009, ApJ, 697, 55
- Goicoechea & Le Bourlot (2007) Goicoechea, J. R. & Le Bourlot, J. 2007, A&A, 467, 1
- Goldshmidt & Sternberg (1995) Goldshmidt, O. & Sternberg, A. 1995, ApJ, 439, 256
- Goldsmith & Li (2005) Goldsmith, P. F. & Li, D. 2005, ApJ, 622, 938
- Goldsmith et al. (2007) Goldsmith, P. F., Li, D., & Krčo, M. 2007, ApJ, 654, 273
- Gomez et al. (1998) Gomez, Y., Lebron, M., Rodriguez, L. F., et al. 1998, ApJ, 503, 297
- Gould & Harwit (1963) Gould, R. J. & Harwit, M. 1963, ApJ, 137, 694
- Gould & Salpeter (1963) Gould, R. J. & Salpeter, E. E. 1963, ApJ, 138, 393
- Habart et al. (2003) Habart, E., Boulanger, F., Verstraete, L., et al. 2003, A&A, 397, 623
- Habart et al. (2004) Habart, E., Boulanger, F., Verstraete, L., Walmsley, C. M., & Pineau des Forêts, G. 2004, A&A, 414, 531
- Habing (1968) Habing, H. J. 1968, Bull. Astron. Inst. Netherlands, 19, 421
- Haiman et al. (1996) Haiman, Z., Rees, M. J., & Loeb, A. 1996, ApJ, 467, 522
- Haiman et al. (1997) Haiman, Z., Rees, M. J., & Loeb, A. 1997, ApJ, 476, 458
- Heiles (1969) Heiles, C. 1969, ApJ, 156, 493
- Heiner et al. (2009) Heiner, J. S., Allen, R. J., & van der Kruit, P. C. 2009, ApJ, 700, 545
- Heiner et al. (2011) Heiner, J. S., Allen, R. J., & van der Kruit, P. C. 2011, MNRAS, 416, 2
- Heyer et al. (2004) Heyer, M. H., Corbelli, E., Schneider, S. E., & Young, J. S. 2004, ApJ, 602, 723
- Hill & Hollenbach (1978) Hill, J. K. & Hollenbach, D. J. 1978, ApJ, 225, 390
- Hirashita & Ferrara (2005) Hirashita, H. & Ferrara, A. 2005, MNRAS, 356, 1529
- Hollenbach & Natta (1995) Hollenbach, D. & Natta, A. 1995, ApJ, 455, 133
- Hollenbach et al. (1971) Hollenbach, D. J., Werner, M. W., & Salpeter, E. E. 1971, ApJ, 163, 165
- Holzbauer & Furlanetto (2012) Holzbauer, L. N. & Furlanetto, S. R. 2012, MNRAS, 419, 718
- Jura (1974) Jura, M. 1974, ApJ, 191, 375
- Kaufman et al. (1999) Kaufman, M. J., Wolfire, M. G., Hollenbach, D. J., & Luhman, M. L. 1999, ApJ, 527, 795
- Kim et al. (2013) Kim, J.-h., Krumholz, M. R., Wise, J. H., et al. 2013, ApJ, 775, 109
- Knapen et al. (2006) Knapen, J. H., Allen, R. J., Heaton, H. I., Kuno, N., & Nakai, N. 2006, A&A, 455, 897
- Knapp (1974) Knapp, G. R. 1974, AJ, 79, 527
- Krumholz et al. (2008) Krumholz, M. R., McKee, C. F., & Tumlinson, J. 2008, ApJ, 689, 865
- Krumholz et al. (2009) Krumholz, M. R., McKee, C. F., & Tumlinson, J. 2009, ApJ, 693, 216
- Krčo & Goldsmith (2010) Krčo, M. & Goldsmith, P. F. 2010, ApJ, 724, 1402
- Kuhlen et al. (2013) Kuhlen, M., Madau, P., & Krumholz, M. R. 2013, ApJ, 776, 34
- Lagos et al. (2011) Lagos, C. D. P., Baugh, C. M., Lacey, C. G., et al. 2011, MNRAS, 418, 1649
- Le Bourlot et al. (1999) Le Bourlot, J., Pineau des Forêts, G., & Flower, D. R. 1999, MNRAS, 305, 802
- Le Petit et al. (2006) Le Petit, F., Nehmé, C., Le Bourlot, J., & Roueff, E. 2006, ApJS, 164, 506
- Ledoux et al. (2006) Ledoux, C., Petitjean, P., & Srianand, R. 2006, ApJ, 640, L25
- Lee et al. (2007) Lee, D.-H., Pak, S., Dixon, W. V. D., & van Dishoeck, E. F. 2007, ApJ, 655, 940
- Lee et al. (1996) Lee, H.-H., Herbst, E., Pineau des Forets, G., Roueff, E., & Le Bourlot, J. 1996, A&A, 311, 690
- Lee et al. (2012) Lee, M.-Y., Stanimirović, S., Douglas, K. A., et al. 2012, ApJ, 748, 75
- Lee et al. (2014) Lee, M.-Y., Stanimirović, S., Wolfire, M. G., et al. 2014, ApJ, 784, 80
- Leitch-Devlin & Williams (1985) Leitch-Devlin, M. A. & Williams, D. A. 1985, MNRAS, 213, 295
- Lepp & Shull (1984) Lepp, S. & Shull, J. M. 1984, ApJ, 280, 465
- Leroy et al. (2008) Leroy, A. K., Walter, F., Brinks, E., et al. 2008, AJ, 136, 2782
- Levshakov & Varshalovich (1985) Levshakov, S. A. & Varshalovich, D. A. 1985, MNRAS, 212, 517
- Li & Goldsmith (2003) Li, D. & Goldsmith, P. F. 2003, ApJ, 585, 823
- Liszt & Lucas (2002) Liszt, H. & Lucas, R. 2002, A&A, 391, 693
- Liszt (2007) Liszt, H. S. 2007, A&A, 461, 205
- Liszt & Burton (1979) Liszt, H. S. & Burton, W. B. 1979, ApJ, 228, 105
- London (1978) London, R. 1978, ApJ, 225, 405
- Mac Low & Glover (2012) Mac Low, M.-M. & Glover, S. C. O. 2012, ApJ, 746, 135
- Madden et al. (1993) Madden, S. C., Geis, N., Genzel, R., et al. 1993, ApJ, 407, 579
- Matthews et al. (2003) Matthews, H. E., Purton, C. R., Roger, R. S., Dewdney, P. E., & Mitchell, G. F. 2003, ApJ, 592, 176
- McCutcheon et al. (1978) McCutcheon, W. H., Shuter, W. L. H., & Booth, R. S. 1978, MNRAS, 185, 755
- McKee & Krumholz (2010) McKee, C. F. & Krumholz, M. R. 2010, ApJ, 709, 308
- Mebold et al. (1982) Mebold, U., Winnberg, A., Kalberla, P. M. W., & Goss, W. M. 1982, A&A, 115, 223
- Mészáros (1968) Mészáros, P. 1968, Ap&SS, 2, 510
- Miyake et al. (2010) Miyake, S., Stancil, P. C., Sadeghpour, H. R., et al. 2010, ApJ, 709, L168
- Myers et al. (1978) Myers, P. C., Ho, P. T. P., Schneps, M. H., et al. 1978, ApJ, 220, 864
- Neufeld & Spaans (1996) Neufeld, D. A. & Spaans, M. 1996, ApJ, 473, 894
- Noterdaeme et al. (2010) Noterdaeme, P., Petitjean, P., Ledoux, C., et al. 2010, A&A, 523, A80
- Offner et al. (2013) Offner, S. S. R., Bisbas, T. G., Viti, S., & Bell, T. A. 2013, ApJ, 770, 49
- Ostriker et al. (2010) Ostriker, E. C., McKee, C. F., & Leroy, A. K. 2010, ApJ, 721, 975
- Palla et al. (1983) Palla, F., Salpeter, E. E., & Stahler, S. W. 1983, ApJ, 271, 632
- Pirronello et al. (1997) Pirronello, V., Liu, C., Shen, L., & Vidali, G. 1997, ApJ, 475, L69
- Popping et al. (2014) Popping, G., Somerville, R. S., & Trager, S. C. 2014, MNRAS, 442, 2398
- Rachford et al. (2009) Rachford, B. L., Snow, T. P., Destree, J. D., et al. 2009, ApJS, 180, 125
- Rachford et al. (2002) Rachford, B. L., Snow, T. P., Tumlinson, J., et al. 2002, ApJ, 577, 221
- Rand et al. (1992) Rand, R. J., Kulkarni, S. R., & Rice, W. 1992, ApJ, 390, 66
- Rank et al. (1971) Rank, D. M., Townes, C. H., & Welch, W. J. 1971, Science, 174, 1083
- Reach et al. (1994) Reach, W. T., Koo, B.-C., & Heiles, C. 1994, ApJ, 429, 672
- Read (1981) Read, P. L. 1981, MNRAS, 194, 863
- Richter et al. (2001) Richter, P., Sembach, K. R., Wakker, B. P., & Savage, B. D. 2001, ApJ, 562, L181
- Robertson & Kravtsov (2008) Robertson, B. E. & Kravtsov, A. V. 2008, ApJ, 680, 1083
- Roger & Dewdney (1992) Roger, R. S. & Dewdney, P. E. 1992, ApJ, 385, 536
- Roger et al. (2004) Roger, R. S., McCutcheon, W. H., Purton, C. R., & Dewdney, P. E. 2004, A&A, 425, 553
- Roger & Pedlar (1981) Roger, R. S. & Pedlar, A. 1981, A&A, 94, 238
- Röhser et al. (2014) Röhser, T., Kerp, J., Winkel, B., Boulanger, F., & Lagache, G. 2014, A&A, 564, A71
- Safranek-Shrader et al. (2012) Safranek-Shrader, C., Agarwal, M., Federrath, C., et al. 2012, MNRAS, 426, 1159
- Sancisi et al. (1974) Sancisi, R., Goss, W. M., Anderson, C., Johansson, L. E. B., & Winnberg, A. 1974, A&A, 35, 445
- Savage et al. (1977) Savage, B. D., Bohlin, R. C., Drake, J. F., & Budich, W. 1977, ApJ, 216, 291
- Schruba et al. (2011) Schruba, A., Leroy, A. K., Walter, F., et al. 2011, AJ, 142, 37
- Schuster et al. (2007) Schuster, K. F., Kramer, C., Hitschfeld, M., Garcia-Burillo, S., & Mookerjea, B. 2007, A&A, 461, 143
- Shaw et al. (2005) Shaw, G., Ferland, G. J., Abel, N. P., Stancil, P. C., & van Hoof, P. A. M. 2005, ApJ, 624, 794
- Shaya & Federman (1987) Shaya, E. J. & Federman, S. R. 1987, ApJ, 319, 76
- Shull (1978) Shull, J. M. 1978, ApJ, 219, 877
- Smith et al. (2000) Smith, D. A., Allen, R. J., Bohlin, R. C., Nicholson, N., & Stecher, T. P. 2000, ApJ, 538, 608
- Solomon & Werner (1971) Solomon, P. M. & Werner, M. W. 1971, ApJ, 165, 41
- Spaans & Neufeld (1997) Spaans, M. & Neufeld, D. A. 1997, ApJ, 484, 785
- Spaans et al. (1994) Spaans, M., Tielens, A. G. G. M., van Dishoeck, E. F., & Bakes, E. L. O. 1994, ApJ, 437, 270
- Spaans & van Dishoeck (1997) Spaans, M. & van Dishoeck, E. F. 1997, A&A, 323, 953
- Spitzer et al. (1973) Spitzer, L., Drake, J. F., Jenkins, E. B., et al. 1973, ApJ, 181, L116
- Spitzer (1948) Spitzer, Jr., L. 1948, ApJ, 107, 6
- Spitzer & Tomasko (1968) Spitzer, Jr., L. & Tomasko, M. G. 1968, ApJ, 152, 971
- Stecher & Williams (1967) Stecher, T. P. & Williams, D. A. 1967, ApJ, 149, L29
- Stephens & Dalgarno (1972) Stephens, T. L. & Dalgarno, A. 1972, J. Quant. Spec. Radiat. Transf., 12, 569
- Sternberg (1988) Sternberg, A. 1988, ApJ, 332, 400
- Sternberg & Dalgarno (1989) Sternberg, A. & Dalgarno, A. 1989, ApJ, 338, 197
- Sternberg & Neufeld (1999) Sternberg, A. & Neufeld, D. A. 1999, ApJ, 516, 371
- Stoerzer et al. (1996) Stoerzer, H., Stutzki, J., & Sternberg, A. 1996, A&A, 310, 592
- Strömgren (1939) Strömgren, B. 1939, ApJ, 89, 526
- Tacconi et al. (2010) Tacconi, L. J., Genzel, R., Neri, R., et al. 2010, Nature, 463, 781
- Tacconi et al. (2013) Tacconi, L. J., Neri, R., Genzel, R., et al. 2013, ApJ, 768, 74
- Takahashi et al. (1999) Takahashi, J., Masuda, K., & Nagaoka, M. 1999, MNRAS, 306, 22
- Thompson et al. (2014) Thompson, R., Nagamine, K., Jaacks, J., & Choi, J.-H. 2014, ApJ, 780, 145
- Tielens & Hollenbach (1985) Tielens, A. G. G. M. & Hollenbach, D. 1985, ApJ, 291, 722
- van der Werf & Goss (1989) van der Werf, P. P. & Goss, W. M. 1989, A&A, 224, 209
- van der Werf et al. (2013) van der Werf, P. P., Goss, W. M., & O’Dell, C. R. 2013, ApJ, 762, 101
- van der Werf et al. (1988) van der Werf, P. P., Goss, W. M., & Vanden Bout, P. A. 1988, A&A, 201, 311
- van Dishoeck & Black (1986) van Dishoeck, E. F. & Black, J. H. 1986, ApJS, 62, 109
- van Dishoeck & Black (1988) van Dishoeck, E. F. & Black, J. H. 1988, ApJ, 334, 771
- van Dishoeck & Black (1990) van Dishoeck, E. F. & Black, J. H. 1990, ApJ, 360, 313
- van Dishoeck et al. (2006) van Dishoeck, E. F., Jonkheid, B., & van Hemert, M. C. 2006, Faraday Discussions, 133, 231
- Viala (1986) Viala, Y. P. 1986, A&AS, 64, 391
- Viala et al. (1988) Viala, Y. P., Roueff, E., & Abgrall, H. 1988, A&A, 190, 215
- Visbal et al. (2014) Visbal, E., Haiman, Z., Terrazas, B., Bryan, G. L., & Barkana, R. 2014, MNRAS, 445, 107
- Wakker (2006) Wakker, B. P. 2006, ApJS, 163, 282
- Wannier et al. (1991) Wannier, P. G., Lichten, S. M., Andersson, B.-G., & Morris, M. 1991, ApJS, 75, 987
- Wannier et al. (1983) Wannier, P. G., Lichten, S. M., & Morris, M. 1983, ApJ, 268, 727
- Webber (1998) Webber, W. R. 1998, ApJ, 506, 329
- Welty et al. (2012) Welty, D. E., Xue, R., & Wong, T. 2012, ApJ, 745, 173
- Williams & Maddalena (1996) Williams, J. P. & Maddalena, R. J. 1996, ApJ, 464, 247
- Wilson et al. (1970) Wilson, R. W., Jefferts, K. B., & Penzias, A. A. 1970, ApJ, 161, L43
- Wise & Abel (2007) Wise, J. H. & Abel, T. 2007, ApJ, 671, 1559
- Wolcott-Green et al. (2011) Wolcott-Green, J., Haiman, Z., & Bryan, G. L. 2011, MNRAS, 418, 838
- Wolfire et al. (2010) Wolfire, M. G., Hollenbach, D., & McKee, C. F. 2010, ApJ, 716, 1191
- Wolfire et al. (2003) Wolfire, M. G., McKee, C. F., Hollenbach, D., & Tielens, A. G. G. M. 2003, ApJ, 587, 278
- Wolfire et al. (2008) Wolfire, M. G., Tielens, A. G. G. M., Hollenbach, D., & Kaufman, M. J. 2008, ApJ, 680, 384
- Wolniewicz et al. (1998) Wolniewicz, L., Simbotin, I., & Dalgarno, A. 1998, ApJS, 115, 293
- Wong & Blitz (2002) Wong, T. & Blitz, L. 2002, ApJ, 569, 157
- Wrathmall et al. (2007) Wrathmall, S. A., Gusdorf, A., & Flower, D. R. 2007, MNRAS, 382, 133
- Yoshida et al. (2003) Yoshida, N., Abel, T., Hernquist, L., & Sugiyama, N. 2003, ApJ, 592, 645