Concise comparative summaries (CCS) of large text corpora with a human experiment
Abstract
In this paper we propose a general framework for topic-specific summarization of large text corpora and illustrate how it can be used for the analysis of news databases. Our framework, concise comparative summarization (CCS), is built on sparse classification methods. CCS is a lightweight and flexible tool that offers a compromise between simple word frequency based methods currently in wide use and more heavyweight, model-intensive methods such as latent Dirichlet allocation (LDA). We argue that sparse methods have much to offer for text analysis and hope CCS opens the door for a new branch of research in this important field.
For a particular topic of interest (e.g., China or energy), CSS automatically labels documents as being either on- or off-topic (usually via keyword search), and then uses sparse classification methods to predict these labels with the high-dimensional counts of all the other words and phrases in the documents. The resulting small set of phrases found as predictive are then harvested as the summary.
To validate our tool, we, using news articles from the New York Times international section, designed and conducted a human survey to compare the different summarizers with human understanding. We demonstrate our approach with two case studies, a media analysis of the framing of “Egypt” in the New York Times throughout the Arab Spring and an informal comparison of the New York Times’ and Wall Street Journal’s coverage of “energy.” Overall, we find that the Lasso with normalization can be effectively and usefully used to summarize large corpora, regardless of document size.
doi:
10.1214/13-AOAS698keywords:
, , , , , and
T1Supported in part by NSF Grant SES-0835531 under the “Cyber-Enabled Discovery and Innovation (CDI),” NSF Grant DMS-09-07632, ARO Grant W911NF-11-1-0114, NSF Grant CCF-0939370, NSF-CMMI Grant 30148, NSFC-11101005 and DPHEC-20110001120113.
t2J. Jia and L. Miratrix are co-first authors and are listed in alphabetical order.
1 Introduction
Stuart Hall333Quoted in James Watson’s 2007 article, “Representing Realities: An Overview of News Framing.” wrote, “the media are part of the dominant means of ideological production. What they produce is precisely representations of the social world, images, descriptions, explanations and frames for understanding how the world is and why it works as it is said and shown to work.” Given this, in order to understand how the public constructs its view of the world, we need to be able to generate concise, comprehensible summaries of these representations. Automatic, concise summaries thus become quite useful for comparing themes across corpora or screening corpora for further readings.
Our approach to obtain such summaries is by first identifying a corpus that we believe contains substantial information on prespecified topics of interest and then using automated methods to extract summaries of those topics. These summaries ideally show the connections between our topics and other concepts and ideas. The two corpora we investigate in this paper are all the articles in the international section of the New York Times from 2009 to just after 2011, and all the headlines from both the New York Times and the Wall Street Journal from 2008 to 2011. Our approach, however, could be applied to other corpora, such as the writings of Shakespeare, books published in statistics in 2012 or Facebook wall writings of some community. Since such corpora are large, only a very tiny fraction of them could ever be summarized or read by humans.
There are many ways one might study a corpus. One common and effective method for text study is comparison. For example, a media analyst interested in investigating how the topic of “China” is framed or covered by NYT’s international section in 2009 could form an opinion by comparing articles about China to those not about China. A Shakespeare scholar could gain understanding on Shakespeare’s view on romance by comparing the author’s romantic plays with his nonromantic plays.
In this paper, we propose and validate by human survey a topic-driven concise comparative summarization (CCS) tool for large text corpora. Our CCS tool executes the comparison idea through statistical sparse “classification” methods. We first automatically label blocks of text in a corpus as “positive” examples about a topic or “negative” (“control”) examples. We then use a machine learning predictive framework and sparse regression methods such as the Lasso [Tibshirani (1996)] to form a concise summary of the positive examples out of those phrases selected as being predictive of this labeling.
A novel advantage of our tool is the flexible nature of its labeling process. It allows different ways of forming “positive” and “negative” examples to provide “snapshot” summaries of a corpus from various angles. For instance, we could label articles that mention China as “positive” examples and the rest as “negative examples;” we could also take the same positive examples and use only those articles that contain other Asian countries (but not China) as the negative examples. Because the summaries are concise, it is possible for researchers to quickly and effectively examine and compare multiple snapshots. Therefore, changes in coverage across time or between sources can be presented and understood even when the changes are multidimensional and complex.
Even though our tool takes a classification framework as its foundation, our interest is in understanding text rather than classifying it. Therefore, we validated our tool through a systematic randomized human survey, described in Section 4, where human subjects evaluated our summaries based on their reading of samples from the original text. This provided some best practices for generating summaries with the highest overall quality as measured by, essentially, relevance and clarity.
Our CCS tool can be used to provide confirmatory evidence to support pre-existing theories. Extending the work of Clavier et al. (2010), in Section 5 media analyst co-authors of this paper use this tool and framing theory (an analytical framework from media studies, described later) to compare the evolution of news media representations of countries across different distinct periods defined by significant events such as revolutionary upheaval or elections with existing international relations theory. Our tool can also be used to explore text in a generative manner, helping researchers better understand and theorize about possible representations or framing mechanisms of a topic in a body of text. In our second case study we utilize CCS to compare the headlines of the New York Times to the Wall Street Journal, in particular, for the topic of “energy.”
The rest of the paper is organized as follows. Before presenting our proposed approach, concise comparative summary (CCS), we briefly review related work in Section 2. Section 3 describes the CCS framework, which consists of three steps: {longlist}[1.]
the labeling scheme: what rule to use to automatically label a document unit as “positive” or “negative;”
preprocessing: when building and expanding on a bag of words representation of a corpus, we must decide which document unit to use (article vs. paragraph) and how to rescale counts of phrases appropriately; and
feature selection: how to select the summary phrases. For preprocessing, we describe tf-idf and rescaling. For feature selection, we discuss the Lasso, -penalized logistic regression (L1LR), correlation and co-occurrence. Note that the former two fall into the predictive framework, while the last do not but are included because of their wide use. The human validation experiment to compare different combinations in the CCS framework over labeling, rescaling, unit choice and feature selection choice is described in Section 4 with results in Section 4.2. Section 5 presents the two case studies introduced above, using the Lasso with normalization, the method found to be the most robust in the human validation experiment. Section 6 concludes with a discussion.
2 Related works
Automated tools aimed at understanding text, especially newspaper text, are becoming more and more important with the increased accumulation of text documents in all fields of human activities. In the last decade we have seen the emergence of computational social science, a field connecting statistics and machine learning to anthropology, sociology, public policy and more [Lazer et al. (2009)]. Automatic summarization is in wide use: Google news trends, Twitter’s trending topics [Zubiaga et al. (2011)] and Crimson Hexagon’s brand analysis all use text summaries to attempt to make sense of the vast volumes of text generated in public discourse. These all illustrate the great potential of statistical methods for text analysis, including news media analysis. We hope our proposed CCS framework will help advance this new and exciting field.
Most text summarization approaches to date (aside from natural language- and grammar-based approaches) use word or phrase (including sentence) counts or frequencies. They can be considered along two axes. The first axis is whether an approach generates topics on its own or summarizes without regard to topic (unsupervised) or is supplied a topic of interest (supervised). The second axis is whether the word and phrase rates of appearance are modeled or simply reweighted.
2.1 Unsupervised model-based approaches
Topic modeling, where documents in a corpus are described as mixtures of latent topics that are in turn described by words and phrases, is a rapidly growing area of text analysis. These methods take text information as input and produce a (usually generative) model fit to the data. The model itself captures structure in the data, and this structure can be viewed as a summary. The set of topics generated can serve as a summary of the corpus overall, and individual documents can be summarized by presenting those topics most associated with them.
A popular example is the latent Dirichlet allocation (LDA) model [Blei, Ng and Jordan (2003)], which posits that each word observed in the text stands in for a hidden, latent “topic” variable. These models are complex and dense: all words play a role in all the topics. However, one can still present the most prominent words in a topic as the summary, which produces cogent and reasonable topics; see Chang et al. (2009), where humans evaluate the internal cohesion of learned topics by identifying “impostor” words inserted into such lists. Grimmer et al. (2011) combine such a model with clustering to organize documents by their topics. They also extensively evaluate different models under their framework with human survey experiments.
Summarizing or presenting the generated topics with this method can be problematic. For example, taking the most probable words of a topic to represent it can lead to overly general representations. Bischof and Airoldi (2012) propose focusing on how words discriminate between topics as well as overall frequency—essentially a comparative approach—to better identify overall topics. These issues notwithstanding, LDA-style approaches are quite powerful and can be used comparatively. For example, Paul, Zhai and Girju (2010) use LDA to score sentences from opposite viewpoints to summarize differences between two ideologies.
2.2 Unsupervised simple weighting approaches
Google Trends charts are calculated by comparing the number of times a prespecified word of interest appears to the overall volume of news for a specified time period (within the news outlets that Google compiles). Even this simple approach can show how topics enter and leave public discourse across time. Twitter’s trending topics appear to operate similarly, although it selects the hottest topics by those which are gaining in frequency most quickly. These approaches are similar in spirit to the normalized simpler methods (co-occur and correlation screen) that we compare with CCS in this paper.
Hopkins and King (2010) extrapolate from a potentially nonrandom sample of hand-coded documents to estimate the proportion of documents in several predefined categories. This can be used for sentiment analysis (e.g., estimating the proportion of blogs showing approval for some specified public figure). Their work drives Crimson Hexagon, a company currently offering brand analysis to several companies. Our approach instead identifies key phrases most associated with a given topic or subject.
There is a wide literature on text summarization (as compared to topic modeling, above) by key-phrase extraction [Rose et al. (2010), Senellart and Blondel (2008), Frank et al. (1999)] and sentence extraction Hennig (2009), Goldstein et al. (2000), Neto, Freitas and Kaestner (2002). These approaches score potential key phrases or sentences using metrics such as position in a paragraph, sentence length or frequency of occurrence, and then select the highest scorers as the summary. While typically used for individual documents, Goldstein et al. (2000) did extend this approach to multiple documents by scoring and selecting sentences sequentially, with future sentences penalized by similarity to previously selected sentences.
In Monroe, Colaresi and Quinn (2008), the authors take a comparative approach as we do. They merge all text into two super-documents (the positive and negative examples) and then score individual words based on their rates of appearance normalized by their overall frequency. We analyze the corpus through individual document units.
2.3 Supervised approaches
Supervised versions of LDA that incorporate a given topic labeling in the hierarchical Bayesian model [Blei and McAuliffe (2008)] do exist. Although these methods are computationally expensive and produce dense models requiring truncation for interpretability, they are powerful indications of the capabilities of computer-assisted topic-based summarization. Hennig (2009) applies a latent topic model similar to LDA for topic-specific summarization of documents. Here the topic is represented as a set of documents and a short narrative of the desired content and sentences are then extracted by a scoring procedure that compares the similarity of latent sentence representations to the provided topic of interest.
Classification of text documents using the phrases in those documents as features (and a given, prespecified labeling of those documents) is familiar and well studied [Genkin, Lewis and Madigan (2007), Zhang and Oles (2001)]. However, while we extensively build on this work, our focus is not on the ability to classify documents but rather on the interpretable features that enable classification. Interpreting these features allows for investigation of the quality of the text in relation to other variables of interest. For example, Eisenstein, Smith and Xing (2011) use similar approaches to examine the relationship between characteristics of different authors and their patterns of lexical frequencies.
3 Our approach: Concise comparative summarization (CCS) via sparse predictive classification
In science and engineering applications, statistical models often lend themselves to believable generative stories. For social science applications such as text analysis, however, models are more likely to be descriptive than generative. As simple methods are more transparent, they are arguably more appealing for such descriptive purposes. Our overall goal is to develop computationally light as well as transparent tools for text analysis and, by doing so, to explore the limits of methods that are not extensively model-based.
| Iraq | Russia | Germany | Mexico |
|---|---|---|---|
| american | a medvedev | angela merkel | and border protection |
| and afghanistan | caucasus | berlin | antonio betancourt |
| baghdad | europe | chancellor angela | cancn |
| brigade | gas | european | chihuahua |
| combat | georgia | france and | denise grady |
| gen | interfax news agency | frankfurt | drug cartels |
| in afghanistan | iran | group of mostly | guadalajara |
| invasion | moscow | hamburg | influenza |
| nuri | nuclear | marwa alsherbini | oaxaca |
| pentagon | president dmitri | matchfixing | outbreak |
| saddam | republics | minister karltheodor zu | president felipe |
| sergeant | sergei | munich | sinaloa |
| sunni | soviet | nazi | swine |
| troops | vladimir | world war | texas |
| war and who | tijuana |
Our CCS framework is composed of three main steps: {longlist}[1.]
automatically label the text units for a given topic (label),
preprocess the possible summarizing phrases and phrase counts (weight), and
sparsely select a comparative phrase list of interest using classification methods on the automatic labels (summarize).
For a given topic or subject (e.g., “Egypt”) in a given context (e.g., the NYT international section in 2009), CCS produces summaries in the form of a list of key phrases. To illustrate, Table 1 contains four sample summaries. Here we labeled an article as a “positive” example if it contains the word of the country under various forms at least twice. As we can see in this table, sometimes fragments are selected as stand-ins for complete phrases, for example, the phrase “president felipe” appears in the Mexico column, signifying President Felipe [Calderòn]. These summaries are suggestive of the aspects of these countries that are most covered in the New York Times in 2009, relative to other topics: even now, “nazis” and the “world wars” were tied to Germany; “iraq” and “afghanistan” were also tied closely; “gen” (as in the military title General) and “combat” were the major focus in Iraq. The coverage of Mexico revolved around the “swine flu,” “drug cartels” and concerns about the “border.” Russia had a run-in with Europe about “gas,” and “nuclear” involvement with “iran.”
We use sparse classification tools such as the Lasso or -penalized logistic regression (L1LR) in step 3; these are fast and different from the modeling methods described earlier. Our approach is fundamentally about contrasting sets of documents and using found differences as the relevant summary, which allows for a more directed process of summarization than unsupervised methods. This also allows for multiple snapshots of the same topic in the same document corpus using different contrasting sets, which gives a more nuanced understanding of how the topic is portrayed.
To situate concise comparative summarization of a given topic in a binary classification framework, we now introduce some notation. A predictive framework consists of units, each with a class label and a collection of possible features that can be used to predict this class label. Each unit is attributed a value for each feature . These form an matrix . The units are blocks of text taken from the corpus (e.g., entire articles or individual paragraphs), the class labels (generally built automatically with keyword searches) indicate whether document unit contains content on a subject of interest, and the features are all the possible key phrases that could be used to summarize the subject or topic.
is built from , where is a representation of text often called the bag-of-phrases model: each document is represented as a vector with the th element being the total number of times that the specific phrase appears in the document. Stack these row vectors to make the document-term matrix of counts. From , we build by rescaling the elements of to account for different rates of appearance between the phrases. and have one row for each document and one column for each phrase, and they tend to be highly sparse: most matrix elements are 0.
Given the processed text and , we can construct summarizers by labeling, weighting and selecting phrases. We can make different choices for each step. We now present several such choices, and then discuss a human validation experiment that identifies the best combination of these elements.
3.1 Automatic and flexible labeling of text units
To start, based on subject knowledge, the user of our tool (e.g., the media analyst) translates a topic or subject of interest into a set of topic phrases. For instance, he/she might translate the topic of “China” into a topic list: China, Chinas, Chinese. Energy might be oil, gas, electricity, coal, solar. Arab Spring might be arab spring, arab revolution, arab uprising.444These topics can be refined and expanded if initially generated summaries return other phrases that are essentially the same. For example, in one of our case studies, we ran CCS using the above energy list as a query. When we saw the term “natural” surface as a summary word, we realized our query set could be improved with the addition of the query natural gas—CCS helped us discover a useful addition to the query set, leading to a broader, more useful summarization from a second pass using the expanded query set. Topic modeling and keyword expansion methods could also be of use here.
Given a topic list, the user can apply different rules to generate the labeling . For example, label a text unit as a “positive,” example for the topic of “China” if the text unit contains any of the phrases in the topic set, or, alternatively, if a more stringent criterion is desired, label it as “positive” if it contains more than two topic set phrases.
The general rules for labeling-by-query-count we used are as follows: {longlist}[ ]
: A document is given a label if a query term appears or more times in the document. Documents with or fewer query hits receive a label of .
or hcount-: As above, but drop all documents with between 1 and hits from the analysis, as their relationship to the query may be ambiguous.
In other cases labeling is straightforward. For directly comparing the NYT to the WSJ, the labeling was for NYT headlines and for WSJ headlines. For comparing a period of time to the rest, labeling would be built from the dates of publication.
The labeling step identifies a set of documents to be summarized in the context of another set. Generally, we summarize compared to the overall background of all remaining documents, but one could drop “uncertain” documents, for example, those with only one topic phrase but not more than one, or “irrelevant” ones, for example, those not relating to any Asian country at all. Different choices here can unveil different aspects of the corpus; see Section 5.2 for a case study that illustrates this.
3.2 Preprocessing: Weighting and stop-word removal
It is well known that baseline word frequencies impact information retrieval methods and so raw counts are often adjusted to account for commonality and rarity of terms [e.g., Monroe, Colaresi and Quinn (2008), Salton and Buckley (1988)]. In the predictive framework, this adjustment is done with the construction of the feature matrix . We consider three constructions of , all built on the bag-of-phrases representation . Regardless of the weighting approach, we also remove any columns corresponding to any phrases used to generate the labeling to prevent the summary from being trivial and circular. Salton and Buckley (1988) examine a variety of weighting approaches for document retrieval in a multi-factor experiment and found choice of approach to be quite important; we compare the efficacy of different choices in our human validation survey (see Section 4).
Each of the following methods (stop word removal, rescaling and tf-idf weighting) transform a base bag of words matrix into a feature matrix .
Stop words removal. Stop words are high frequency but low information words such as “and,” or “the.” High-frequency words have higher variance and effective weight in many methods, often causing them to be erroneously selected as features due to sample noise. To deal with these nuisance words, many text-processing methods use a fixed, hand-built stop-word list and preemptively remove all features on that list from consideration [e.g., Zhang and Oles (2001), Ifrim, Bakir and Weikum (2008), Genkin, Lewis and Madigan (2007)]. For our framework, this method generates from by “dropping” the columns of which correspond to a stop-word feature (while letting take on ’s values exactly in the retained, nonstop-word feature columns).
This somewhat ad hoc method does not adapt automatically to the individual character of a given corpus and this presents many difficulties. Stop words may be context dependent. For example, in US international news “united states” or “country” seem to be high frequency and low information. Switching to a corpus of a different language would require new stop-word lists. More importantly, when considering phrases instead of single words, the stop-word list is not naturally or easily extended.
-rescaled. As an alternative, appropriately adjusting the document vectors can act in lieu of a stop-word list by reducing the variance and weight of high-frequency features. We use the corpus to estimate baseline appearance rates for each feature and then adjust the matrix by a function of these rates; see Mosteller and Wallace (1984) and Monroe, Colaresi and Quinn (2008).
We say is a -rescaled version of if each column of is rescaled to have unit length under the norm, that is,
Under this rescaling, the more frequent a phrase, the lower its weight.
tf-idf weighting. An alternative rescaling comes from the popular tf-idf heuristic [Salton and Buckley (1988), Salton (1991)], which attempts to de-emphasize commonly occurring terms while also accounting for each document’s length. is a tf-idf weighted version of if
where is the sum of the counts of all key phrases in document and is the number of documents in which term appears at least once.
3.3 Feature selection methods
Many prediction approaches yield models that give each feature a nonzero weight. We, however, want to ensure that the number of phrases selected is small so the researcher can easily read and evaluate the entire summary and compare it to others. These summaries can even be automatically translated to other languages to more easily compare foreign language news sources [Dai et al. (2011)].
Given the feature matrix and document labels for a topic, we extract phrases corresponding to columns of to constitute the final summary. We seek a subset of phrases with cardinality as close as possible to, but no larger than, a target , the desired summary length. We typically use phrases, but 30 or 50 might also be desirable depending on the context. We require selected phrases to be distinct, meaning that we do not count sub-phrases. For example, “united states” and “united” are both selected, we drop “united.”
The constraint of short summaries renders the summarization problem a sparse feature selection problem, as studied in, for example, Forman (2003), Lee and Chen (2006), Yang and Pendersen (1997). In other domains, -regularized methods are useful for sparse model selection; they can identify relevant features associated with some outcome within a large set of mostly irrelevant features. In our domain, however, there is no reasonable expectation of an underlying “true” model that is sparse; we expect different phrases to be at least somewhat relevant. Our pursuit of a sparse model is motivated instead by a need for results which can be described concisely—a constraint that crowds out consideration of complicated dense or nonlinear classification models. We nonetheless employ the sparse methods, hoping that they will select only the most important features.
We examine four methods for extraction or selection, detailed below. Two of them, Co-occurrence and Correlation Screening, are scoring schemes where each feature is scored independently and top-scoring features are taken as a summary. This is similar to traditional key-phrase extraction techniques and to other methods currently used to generate word clouds and other text visualizations. The other two are -regularized least squares linear regression (the Lasso) and logistic regression (L1LR). Table 2 displays four summaries for China in 2009, one from each feature selector: choice matters greatly. We systematically evaluate this differing quality with a human validation experiment in Section 4.
| Co-occurrence | Correlation | L1LR | Lasso | |
|---|---|---|---|---|
| 1 | and | beijing and | asian | asian |
| 2 | by | beijings | beijing | beijing |
| 3 | contributed | contributed | contributed | contributed |
| research | research | research | research | |
| 4 | for | from beijing | euna lee | exports |
| 5 | global | global | global | global |
| 6 | has | in beijing | hong kong | hong kong |
| 7 | hu jintao | li | jintao | jintao |
| 8 | in beijing | minister wen jiabao | north korea | north korea |
| 9 | its | president hu jintao | shanghai | shanghai |
| 10 | of | prime minister wen | staterun | tibet |
| 11 | that | shanghai | uighurs | uighurs |
| 12 | the | the beijing | wen jiabao | wen jiabao |
| 13 | to | tibet | xinhua | xinhua |
| 14 | xinhua | xinhua the | ||
| 15 | year | zhang |
3.3.1 Co-occurrence and correlation screening
Co-occurrence is a simple method included in our experiments as a useful baseline. The idea is to take phrases that appear most often (or have greatest weight) in the positively marked text as the summary. This method is often used in tools such as newspaper charts showing the trends of major words over a year (such as Google News Trends555http://www.google.com/trends.) or word or tag clouds (created at sites such as Wordle666http://www.wordle.net/.). Correlation Screening selects features with the largest absolute Pearson correlation with the topic labeling .
Both methods give each phrase a relevance score , rank the phrases by these , and then take the top phrases, dropping any sub-phrases, as the summary. For Co-occurrence, the relevance score of feature for all is
where , that is, is the average weight of phrase in the positively marked examples. If , that is, it is not weighted, then is the average number of times feature appears in and this method selects those phrases that appear most frequently in the positive examples. The weighting step, however, reduces the Co-occurrence score for common words that appear frequently in both the positive and negative examples.
For Correlation Screening, score each feature as
where and are the mean values of feature and the labels, respectively, across the considered documents.
3.3.2 -penalized methods: Lasso and L1LR
The Lasso [Tibshirani (1996)] is an -penalized version of linear regression and is the first of two feature selection methods examined in this paper that address our model-sparsity-for-interpretability constraint explicitly, rather than via thresholding. Imposing an penalty on a least-squares problem regularizes the vector of coefficients, allowing for optimal model fit in high-dimensional () regression settings. Furthermore, penalties typically result in sparse feature-vectors, which is desirable in our context. The Lasso also takes advantage of the correlation structure of the features to, to a certain extent, avoid selecting highly correlated terms.
The Lasso can be defined as an optimization problem:
| (1) |
We solve this convex optimization problem with a modified version of the BBR algorithm [Genkin, Lewis and Madigan (2007)]. The phrases corresponding to the nonzero elements of comprise our summary. The penalty term governs the number of nonzero elements of and would traditionally be chosen via cross-validation to optimize some reasonable metric for prediction. We, however, select to achieve a desired prespecified summary length, that is, a desired number of nonzero ’s. We find by a line search.
Not tuning for prediction raises concerns of serious over- or under-fitting. Generally, in order to have short summaries, we indeed under-fit. Additionally, since our labeling is not very accurate in general, prediction performance might even be misleading. The main question is whether a human-readable signal survives imperfect labeling and over-regularized summaries, both of which allow for easier exploration of text. These concerns motivate the human validation study we discuss in Section 4.
Similar to the Lasso, -penalized logistic regression (L1LR) is typically used to obtain a sparse feature set for predicting the log-odds of an outcome variable being either or . It is widely studied in the classification literature, including text classification [see Genkin, Lewis and Madigan (2007), Ifrim, Bakir and Weikum (2008), Zhang and Oles (2001)]. For an overview of the Lasso, -penalized logistic regression and other sparse methods see, for example, Hastie, Tibshirani and Friedman (2011). For details of our implementation along with further discussion, see Jia et al. (2011).
Co-occurrence, correlation screening and the Lasso are all related. The Co-occurrence score can be seen as the average count (or weighted count for a reweighted feature matrix) of phrase in the positively marked examples, denoted as . Correlation Screening is related but slightly different; calculations show that is proportional to , and hence is the difference between the positive and negative examples [see Jia et al. (2011) for details]. Both Co-occurrence and Correlation Screening methods are greedy procedures. Since the Lasso can be solved via -L2boosting [Zhao and Yu (2007)], the Lasso procedure can also be interpreted as greedy. It is an iterative correlation search procedure—the first step is to get the word/phrase with the highest correlation; then we modify the labels to remove the influence of this word/phrase and then get the highest correlated word/phrase with this modified label vector and so on and so forth.
The primary advantages of Co-occurrence and Correlation Screening are that they are fast, scalable and easily distributed across multiple cores for parallel processing. Unfortunately, as they score each feature independently from the others, they cannot take advantage of any dependence between features to aid summarization. The Lasso and L1LR can, to a certain extent. The down side is that the sparse methods are more computationally intensive than Co-occurence and Correlation Screening. However, this could be mitigated by, for example, moving to a parallel computing environment or doing clever preprocessing such as safe feature elimination [El Ghaoui, Viallon and Rabbani (2010)]. For our current implementation (which is our modified form of the BBR algorithm [Genkin, Lewis and Madigan (2007)]), we timed the Lasso as being currently about 9 times and L1LR more than 100 times slower than the baseline Co-occurrence. See Table 3.
| Phrase selection (sec) | Total time (sec) | Percent increase | |
|---|---|---|---|
| Co-occurrence | 1.0 | 20.3 | |
| Correlation screen | 1.0 | 20.3 | 0% |
| The Lasso | 9.3 | 28.7 | 41% |
| L1LR | 104.9 | 124.2 | 511% |
4 The human validation survey
Consider the four sample summaries on Table 2. These particular summaries came from a specific combination of choices for the reweighting (-rescaling), labeling (count-2) and feature selection steps (co-occurrence, correlation, L1LR and the Lasso). But are these summaries better or worse than the summaries from a different summarizer with another specific combination?
Comparing the efficacy of different summarizers requires systematic evaluation. To do this, many researchers use corpora with existing summaries, such as human-encoded key phrases in academic journals such as in Frank et al. (1999) or baseline human-generated summaries such as the TIPSTER data set used in Neto, Freitas and Kaestner (2002). We, however, give a single summary for many documents, and so we cannot use an annotated evaluation corpus or summaries of individual documents.
Alternatively, numerical measures such as prediction accuracy or model fit might be used to compare different methods. However, the major purpose of text summarization is to help humans gather information, so the quality of summarization should be compared to human understanding based on the same text. While we hypothesize that prediction accuracy or model fit should correlate with summary quality as measured by human evaluation to a certain extent, there are no results to demonstrate this. Indeed, some research indicates that the correlation between good model fit and good summary quality may be absent, or even negative, in some experiments [Gawalt et al. (2010), Chang et al. (2009)].
In this section, therefore, we design and conduct a study where humans assess summary quality. We compare our four feature selection methods under different text-segmenting, labeling and weighting choices in a crossed and randomized experiment. Nonexperts read both original documents and our summaries in the experiment and judge the quality and relevance of the output. Even though we expect individuals’ judgements to vary, we can average the responses across a collection of respondents and thus get a measure of overall, generally shared opinion.
4.1 Human survey through a multiple-choice questionnaire
We carried out our survey in conjunction with the XLab, a UC Berkeley lab dedicated to helping researchers conduct human experiments. We recruited 36 respondents (undergraduates at a major university) from the lab’s respondent pool via a generic, nonspecific message stating that there was a study that would take up to one hour of time. For our investigation we used the International Section of the New York Times for 2009. See our first case study in Section 5 for details on this data set.
We evaluated 96 different summarizers built from different combinations along the following four dimensions: {longlist}[ ]
When building , the document units corresponding to the matrix rows may be either (1) full articles or (2) the individual paragraphs in those articles.
Documents can be labeled according to the rules (described in the preceding section) (1) count-1, (2) count-2, (3) count-3, (4) hcount-2 or (5) hcount-3.
Matrix can be built from via (1) stop-word removal, (2) rescaling or (3) tf-idf weighting.
Data can be reduced to a summary using (1) Co-occurrence, (2) Correlation Screening, (3) the Lasso or (4) L1LR. Together, for any given query, there exist CCS summary methods available. We dropped count-3 and Hcount-3 for paragraphs giving 96 tested.
We applied each summarizer to the set of all articles in the New York Times International Section from 2009 for 15 different countries of interest. These countries are China, Iran, Iraq, Afghanistan, Israel, Pakistan, Russia, France, India, Germany, Japan, Mexico, South Korea, Egypt and Turkey. The frequency of appearance in our data for these countries can be found in Table 6 of Jia et al. (2011). We then compared the efficacy of these combinations by having respondents assess (through answering multiple-choice questions) the quality of the summaries generated by each summarizer.
For our survey, paid respondents were convened in a large room of kiosks where they assessed a series of summaries and articles presented in 6 blocks of 8 questions each. Each block considered a single (randomly selected) topic from our list of 15. Within a block, respondents were first asked to read four articles and rate their relevance to the specified topic. Respondents were then asked to read and rate four summaries of that topic randomly chosen from the subject’s library of 96. Respondents could not go back to previous questions.
Only the first 120 words of each article were shown. Consultation with journalists suggests this would not have a detrimental impact on content presented, as a traditional newspaper article’s “inverted pyramid” structure moves from the most important information to more minute details as it progresses [Pottker (2003)]. All respondents finished their full survey, and fewer than 1% of the questions were skipped. Time to completion ranged from 14 to 41 minutes, with a mean completion time of 27 minutes. See Jia et al. (2011) for further details and for the wording of the survey.
4.2 Human survey results
We primarily examined an aggregate “quality” score, taken as the mean of the assessed Content, Relevance and Redundancy of the summaries. Figure 1 shows the raw mean aggregate outcomes for the article-unit and paragraph-unit data. The rightmost plot suggests that the Lasso and L1LR performed better overall than Co-Occurrence and Correlation Screen.
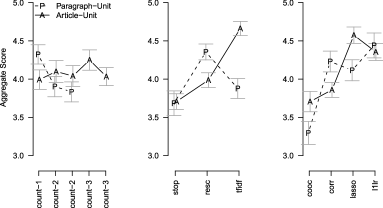
We analyze the data by fitting the respondents’ responses to the summarizer characteristics using linear regression, although all plots here show raw, unadjusted data. The adjusted plots show similar trends. The full model includes terms for respondent, subject, unit type, rescaling used, labeling used and feature selector used, as well as all interaction terms for the latter four factors.
In all models, there are large respondent and topic effects. Some topics were more easily summarized than others, and some respondents more critical than others. Interactions between the four summarization method factors are (unsurprisingly) present (, , under ANOVA). There are significant three-way interactions between unit, feature-selector and rescaling () and labeling, feature-selector and rescaling (). Interaction plots (Figure 1) suggest that the sizes of these interactions are large, making interpretation of the marginal differences for each factor potentially misleading. Table 4 shows all significant two-way interactions and main effects for the full model, as well as for models run on the article-unit and paragraph-unit data separately.
As the unit of analysis heavily interacts with the other three factors, we conduct further analysis of the article-unit and paragraph-unit data separately. The article-unit analysis is below. The paragraph-unit analysis, not shown, is summarized in Section 5’s discussion on overall findings.
| All data | Article-unit | Paragraph-unit | ||||||||
|---|---|---|---|---|---|---|---|---|---|---|
| Factor | Unit | Feat. | Lab. | Resc. | Feat. | Lab. | Resc. | Feat. | Lab. | Resc. |
| Unit | . | . | ||||||||
| Feat. select | 17 | . | 10 | . | 7 | . | ||||
| Labeling | . | . | . | . | 2 | . | ||||
| Rescaling | 14 | 15 | 3 | |||||||
| Data included | Order (article) | Order (paragraph) |
|---|---|---|
| All | cooc, corr L1LR, Lasso | cooc corr, Lasso, L1LR |
| stop resc tf-idf | tfidf, stop resc | |
| tf-idf only | no differences | no differences |
| only | cooc L1LR, Lasso; corr Lasso | no differences |
| stop only | cooc corr, L1LR, Lasso; corr Lasso | cooc Lasso, L1LR |
| cooc only | stop resc tf-idf | stop resc |
| corr only | stop tf-idf | no differences |
| Lasso only | no differences | no differences |
| L1LR only | no differences | tf-idf resc |
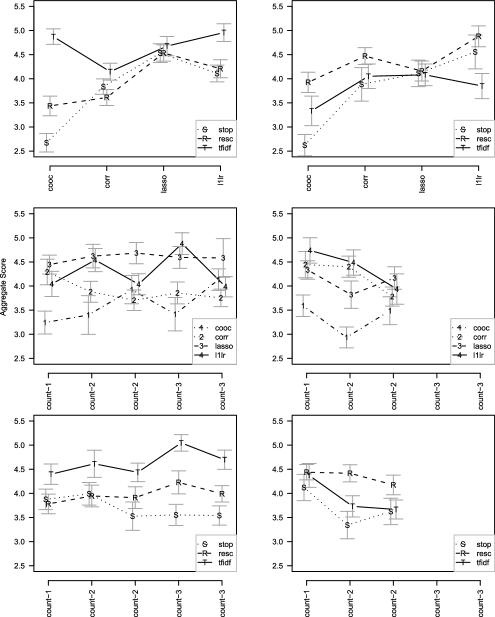
Article-unit analysis. The left column of Figure 2 shows, for the article-unit data, plots of the three two-way interactions between feature selector, labeling scheme and rescaling method. There is a strong interaction between the rescaling and feature-selection method (, , , top-left plot), and no evidence of a labeling by feature-selection interaction or a labeling by rescaling interaction. Model-adjusted plots (not shown) akin to Figure 2 do not differ substantially in character. Table 4 shows all significant () main effects and pairwise interactions.
The Lasso is the most consistent method, maintaining high scores under almost all combinations of the other two factors. In Figure 2, note how the Lasso has a tight cluster of means regardless of the rescaling method used in the top-left plot and how the Lasso’s outcomes are high and consistent across all labeling in the middle-left plot. Though L1LR or Co-occurrence may be slightly superior to the Lasso when coupled with tf-idf, they are not greatly so, and, regardless, both these methods seem fragile, varying a great deal in their outcomes based on the text preprocessing choices.
Validating its long history of use, tf-idf seems to be the best overall rescaling technique, consistently coming out ahead regardless of choice of labeling or feature-selection method. Note how its curve is higher than the rescaling and stop-word curves in both the top- and bottom-left plots in Figure 2. Weighting by tf-idf brings otherwise poor feature selectors up to the level of the better selectors.
We partially ordered the levels of each factor by overall (marginal) impact on summary quality. For each factor, we fit a model with no interaction terms for the factor of interest to get its marginal performance and, within this model, performed pairwise testing for all levels of the factor, adjusting the resulting -values to control familywise error rate with Tukey’s honest significant difference to address the multiple-testing problem within each factor. These calculations showed which choices are overall good performers (ignoring interactions). See Table 5 for the resulting rankings. Co-occurrence and Correlation Screening performed significantly worse than L1LR and the Lasso (correlation vs. L1LR gives , ). The labeling method options are indistinguishable. The rescaling method options are ordered with tf-idf significantly better than rescaling (, ), which in turn is better than stop-word removal (, ).
Discussion. Comparing the performance of the feature selectors is difficult due to the different nature of interactions for paragraph and article units. That said, the Lasso consistently performed well. When building at the article-unit level, Lasso was a top performer. For the paragraph-unit it did better than most but was not as definitively superior. L1LR, if appropriately staged, also performs well.
Simple methods such as Co-occurrence are sensitive to the choice of weighting method and, generally speaking, it is hard to know what weighting is best for a given corpus. This sensitivity is shared by L1LR. Under the Lasso, however, these decisions seem unimportant regardless of unit size. We therefore recommend using the Lasso, as it is far less sensitive to the choice of weights.
A note on tf-idf and rescaling. The main difference between the paragraph-unit and article-unit data is that tf-idf is a poor choice of rescaling and -rescaling is the best choice for paragraph-unit. We conducted a further investigation to understand why this was the case and found that any given stop word will appear in most articles, due to the articles’ lengths, which under tf-idf will result in very small weights. Low weight words are hard to select and, thus, those terms are dropped. For the paragraph-unit level, however, the weights are not shrunk by nearly as much since many paragraphs will not have any particular low-content word. (For example, prepositions like “among” or “with.”)
The recalling, however, maintains the low weights, as the weight basically depends on total counts across the corpus. If one makes histograms of these weights (not shown), this shift is readily apparent. For short units of text, rescaling is a stronger choice since it is not sensitive to document length. Of course, the Lasso makes these decisions less relevant.
5 Case studies
Here we illustrate our CCS tool by conducting two example analyses that demonstrate how researchers can explore corpora, collect evidence for existing theories and generate new theories. That is, we here attempt to meaningfully connect our methodology to actual practice, an orientation to research argued for in, for example, Wagstaff (2012).
Given the validation of the human reader survey, we restrict CCS to use the Lasso with regularization over full articles with a “count-1” rule, a combination determined most effective overall by the human experiment. In the first study, we conduct an analysis of how Egypt was covered by the international section of the New York Times throughout the Arab Spring. In the second, we compare the headlines of the New York Times to those of the Wall Street Journal on the topics of “energy.”
5.1 Egypt as covered by the international section of the New York Times
We here investigate how Egypt was framed across time in the International Section of the New York Times from the beginning of 2009 through July, 2012.777Clavier and Barnesmoore are conducting a larger study on the topic. Through this analysis, we hope to illuminate both consistent and changing trends in the coverage of Egypt as well as the impact of different stages of the Arab Spring on how Egypt was editorially framed. Though of course there are a myriad of frames and narratives, we selected a few of the most influential, recognizable and contextually established narratives to remain within the scope of this paper and to provide a basic overview of possible applications for these tools in the analysis of media representation.
This study demonstrates how CCS can be used to examine how the framing of countries and political entities can evolve throughout the progression of political situations such as revolutions and elections. We show that our tool can also help determine the more macro frames of narration that structure coverage of a region. We argue the findings from our tool allow an analyst to better understand the basic logic of reporting for a region and how events such as uprisings and key elections impact that coverage.
Articles were scraped from the New York Times’ RSS feed,888feed://feeds.nytimes.com/nyt/rss/World. and the HTML markup was stripped from the text. We obtained 35,444 articles. The New York Times, upon occasion, will edit an article and repost it under a different headline and link; these multiple versions of the articles remain in the data set. By looking for similar articles, as measured by a small angle between their feature vectors in the document-term matrix , we estimate that around 4–5% have near-duplicates.
The number of paragraphs in an article ranges from 1 to 38. Typical articles999See, for example, http://www.nytimes.com/2011/03/04/world/americas/04mexico. html. have about 16 paragraphs [with an Inter-Quartile Range (IQR) of 11 to 20 paragraphs]. However, about 15% of the articles, the “World Briefing” articles, are a special variety that contain only one long paragraph.101010See, for example, http://www.nytimes.com/2011/03/03/world/americas/03briefs- cuba.html. Among the more typical, non-“World Briefing” articles, the distribution of article length as number of paragraphs is bell-shaped and unimodal. Longer articles, with a median length of 664 words, have much shorter paragraphs (median of 38 words), generally, than the “Word Briefing” single-paragraph articles (median of 87 words).
In the early 1990s, Entman posited that our learning of the world is built on frames which he defines as “information-processing schemata” that “operate by selecting and highlighting some features of reality while omitting others” [Entman (1993), page 53]. Media studies incorporate these definitions by showing the role of the media in creating these frames, stating, for example, that “through choice and language and repetition of certain story schemas,” the media “organizes and frames reality in distinctive ways” [McLeod, Kosicki and Pan (1991)]. Following Goffman (1974), we agree that the analysts’ task therefore is to identify frames in media discourse within the understanding that media framing, under the guise of informing, can deliberately influence public opinion. Indeed, most of the literature on framing and subsequent agenda-setting literature argues that frames are purposely created. According to Entman, “to frame is to select some aspects of a perceived reality and make them more salient in a communicating text, in such a way as to promote a particular problem, moral evaluation, and/or treatment recommendation” [Entman (2004)].
In terms of portrayal of other countries, frames tend to be easy to observe, as popular news media tend to establish simplified dichotomies of “we” versus “other” and they classify data under those two categories, often outlined as mirror images of positive attributes versus negative ones [Kiousis and Wu (2008), Kunczik (2000)]. Given that frames in the media center around repeated, and often simplified, elements, our tools seem to naturally lend themselves to the extraction of a frame’s “fingerprint.” At core, our methods extract relevant phrases that are often repeated in conjunction with a topic of interest. These phrases, when read as news, arguably build links in readers’ minds to the topic and thus contribute to the formation and solidification of how the topic is framed.
| Period | Start | Stop | #Art. | #Egypt | Eg./Wk | %Egypt |
|---|---|---|---|---|---|---|
| 2009 | 01-Jan-09 | 31-Dec-09 | 9560 | 485 | 9.3 | 5.1 |
| 2010 | 01-Jan-10 | 31-Oct-10 | 8519 | 312 | 7.2 | 3.7 |
| Before uprisings | 01-Nov-10 | 16-Dec-10 | 1272 | 62 | 9.6 | 4.9 |
| Revolution | 17-Dec-10 | 01-Mar-11 | 2098 | 428 | 40.5 | 20.4 |
| Post Mumbarak | 01-Mar-11 | 31-Oct-11 | 6896 | 767 | 22.0 | 11.1 |
| Parl elections | 01-Nov-11 | 30-Jan-12 | 2476 | 219 | 17.0 | 8.8 |
| Post elections | 01-Feb-12 | 01-Jul-12 | 3585 | 249 | 11.5 | 6.9 |
| Whole corpus | 01-Jan-09 | 01-Jul-12 | 34,406 | 2522 | 13.8 | 7.3 |
To capture the evolving frames of Egypt and elections across time, we generated several sequences of summaries. We summarized within specific windows of time with boundaries determined by major political events such as the beginning of the uprisings in Tunisia (December 16th, 2010) or Egyptian parliamentary elections (February 1st, 2012). See Table 6. We present summaries of different periods of time; an alternate approach would be to attempt to link articles and present a graph of relationships. See, for example, Shahaf, Guestrin and Horvitz (2012) or El Ghaoui et al. (2011).
We first generated CCS summaries (using the Lasso with rescaling over full-article document units) comparing all articles mentioning Egypt to all other articles. We subsequently compared Egypt vs. the other articles within only those articles that also contained variants of “election” and examined other Arab countries (e.g., Tunisia) as well as phrases such as “arab” and “arab spring.” This process generated several graphical displays of summaries, all examining different facets of news coverage from the NYT.
For an example see Figure 3, which shows the overall framing of Egypt across time. We identified articles as Egypt-related if they contained any of egypt, egypts, egyptian, egyptians, cairo, mubarak (the count-1 rule). We analyzed at the article level and used the Lasso with tf-idf regularization. After looking at the first list, we removed “arab” and “hosni” as uninformative and re-ran our summarizer to focus the summary on more content-relevant phrases. Such an iterative process is, we argued, a more natural and principled way of discovering and eliminating low-content features; in this case “Hosni” is Mubarak’s first name, and “arab” tends to show up in articles in this region as compared to other regions. Neither of these words would be found on any typical stop-word list.
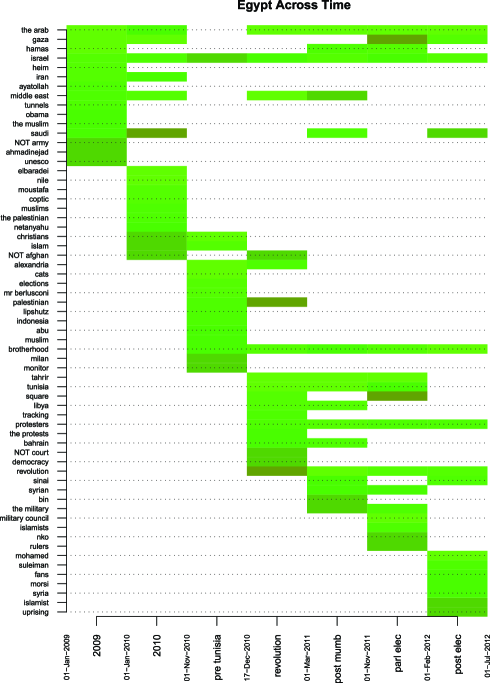
From Figure 3, and others similar to it, we can consider consistent and changing trends in the coverage of Egypt as well as the impact of different stages of the Arab Spring on how Egypt was framed. We then sampled text fragments and sentences containing these phrases from the corpus to ensure we were interpreting them correctly. For example, “the arab” in 2009 typically (but not always) appears before “world,” as in, for example, “mostly from THE ARAB world.” We now give an overview of the resulting analysis.
Pre-Arab spring (columns 1, 2 and 3). The summaries, shown as the first three columns of Figure 3, are for 2009, most of 2010 and for the time just prior to the uprisings in Tunisia. Coverage of the Arab world prior to the Arab Spring is dominated by concern for Israel and narratives concerning the “War on Terror.” Note the appearance of “Israel,” “Hamas,” “Gaza” and “Palestinian.” There are two probable reasons for the appearance of these words. First, Israel bombed Egypt in 2009. Second, following the Camp David accords of 1979, the United State’s political, economic and military strategies within the MENA region became reliant on sustaining these accords. And, indeed, the Mubarak regime sustained this treaty in the face of mass opposition by the Egyptian people. Overall, we see Egypt as being covered in the context of its connection of Israel and the Israeli-Palestinian conflict.
We also see, for the period just prior to the uprisings, “cats” and “milan.” These phrases are overall rare words that happened to appear at disproportionate rates in the positively marked articles and are thus selected as indicative. This can happen when there are few positive examples (only 62 in this time span) in an analysis.
Arab spring (columns 4, 5 and 6). We divided the Arab Spring into three rough periods: the initial revolution during the late months of 2010 (column 4), the time just after the fall of President Mumbarak through 2011 (column 5), and the time leading up to the parliamentary election at the end of 2011 into 2012 (column 6), at which point a nominal government had been established.
Throughout this time we see a shift in coverage, most obviously indicated by the appearance of the words “protests,” “protesters” and “revolution.” “The arab,” which indicated either “the arab world” or “the arab league” before, now indicates “the arab world” or “the arab spring” (as found by examining text snippets containing the found summary phrases). We see that US foreign policy imperatives retain their importance as shown by the continued appearance of “Israel,” “Hamas” and “Gaza.”
Note the entrance of discussion concerning the military and military councils (e.g., “the military” and “military council”) in Egyptian coverage as elections approach. The heightened appearance comes at a time when much discussion concerning the elections is dominated by the Islamist nature of the major parties running for office (see, e.g., “islamists” and “[muslim] brotherhood” in column 6 for the time just prior to the parliamentary elections). As the military regime in Egypt could be perceived by many in western circles as a keystone for regional peace with Israel, this frame of narration arguably lends a sense of stability concerning the status quo.
After the parliamentary elections (Column 7). Following the initial elections in Egypt, the frame of Israel, Gaza and Hamas remain, but we also see “islamist,” “morsi” and “brotherhood,” suggesting a developing frame of an Islamic threat to the western domestic sphere posed by groups like the Muslim Brotherhood. The shift comes as the western media begins to cover the elections in Egypt. As the U.S. has supported the elections as being legitimate, the western media is now faced with the assumption that the will of the Egyptian public might be more fully actualized in an open democracy. Existing American and Israeli fears of Islamic extremism mixed with the prevalence of Islamist parties in the elections combine to form a new frame of coverage. This frame, however, is in many cases still dominated by the relationship of the Islamist parties to the U.S. and its close ally Israel.
5.2 Comparing the New York Times to the Wall Street Journal
In our second case study, we, as readers of the Wall Street Journal (WSJ) and the New York Times (NYT), use CCS to understand the differences and similarities of these two major newspapers across time. We focus on headlines. As headlines are quite short, we, based on the human experiment results, used the Lasso with -rescaling and no stop-word removal. Our data set consists of 289,497 headlines from the New York Times and 284,042 headlines from the Wall Street Journal, scraped from their RSS feeds for four years, from Jan 1, 2008 through the end of 2011.
As a first exploratory step, we labeled NYT headlines as positive examples and WSJ headlines as negative examples and applied CCS. The initial results gave phrases such as “sports,” “review” and “arts” as indicating a headline being from the NYT. Exploration of the raw data revealed that the NYT precedes many headlines with a department name, for example, “arts briefly,” giving this result. However, other phrases, for example, “for” and “of,” also repeatedly appear in the summaries as being indicative of the NYT. This, coupled with the fact that very few phrases indicated the WSJ, suggests that the NYT has a more identifiable “signal” for classification, that is, a more distinctive headline style. For further content-focused investigations we then dropped these department-related words and phrases (e.g., sports, review, etc.) as potential features.
We then conducted a content-focused analysis to compare the NYT and WSJ with respect to how they cover energy, as represented by headlines containing general words such as oil, solar, gas, energy and electricity. 6605 (2.3%) of the WSJ had headlines containing these words, while 2462 (0.9%) of the NYT’s headlines contained these terms. See Table 7. We actually investigated differently broad interpretations of this topic. One version included energy only, and another included words such as oil, natural gas, solar. Also, with an iterative process we can conduct an informal “keyword expansion” to refine the representation of their topic of interest in the context of the corpus being examined by updating the labeling process. For example, we here included “natural” as a keyword after seeing it prominently in connection with “energy” as a first pass.
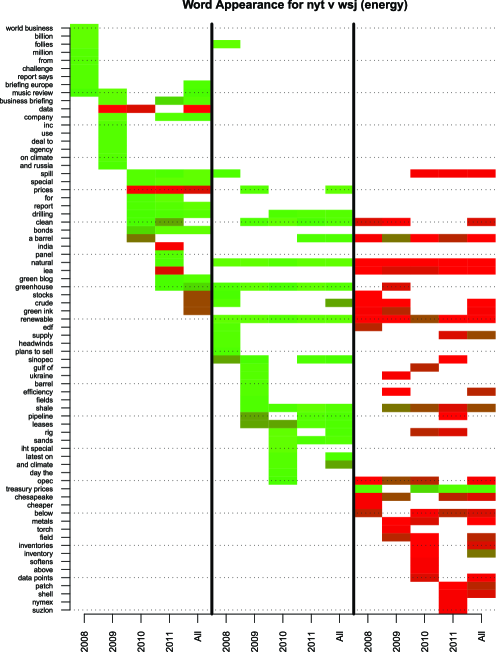
For a first summary, we did a head-to-head (or “between-source”) comparison as follows: we first dropped all headlines that did not mention any of the energy-related terms. We then labeled NYT energy-related headlines as and WSJ energy-related headlines as and applied CCS. This gave data, prices, stocks, green ink and crude as being in the WSJ’s frame and spill, greenhouse, world business and music review as being the NYT’s. See Figure 4. These latter two phrases are after several similar terms had already been removed. “World business” is a department label for articles about international affairs, and its appearance connects coverage of energy with international news. “Music review” is due to 17 music review articles using “energy” in headlines such as “energy abounds released by a flurry of beats” or “molding sound to behave like a solar eclipse.” A head-to-head comparison will capture stylistic differences between the corpora as well as differences in what content is covered.
| # Headlines | # Energy headlines | % Energy headlines | |||||||
|---|---|---|---|---|---|---|---|---|---|
| Year | NYT | WSJ | Total | NYT | WSJ | Total | NYT | WSJ | Total |
| 2008 | 58,951 | 70,905 | 129,856 | 555 | 1869 | 2424 | 0.9 | 2.6 | 1.9 |
| 2009 | 47,817 | 78,538 | 126,355 | 287 | 1670 | 1957 | 0.6 | 2.1 | 1.5 |
| 2010 | 69,680 | 61,122 | 130,802 | 661 | 1451 | 2112 | 0.9 | 2.4 | 1.6 |
| 2011 | 112,595 | 73,417 | 186,012 | 959 | 1615 | 2574 | 0.9 | 2.2 | 1.4 |
| All | 289,293 | 284,031 | 573,324 | 2462 | 6605 | 9067 | 0.9 | 2.3 | 1.6 |
To effectively remove differences in style, we can select different baselines for comparison. In particular, we conduct a “difference of differences” approach by (1) comparing NYT energy headlines to NYT nonenergy headlines to “subtract out” general trends in NYT style, (2) doing the same for the WSJ, and (3) comparing the two resulting summaries to each other. In particular, to do this second-phase “within-source” analysis, we, within the NYT headlines only, labeled energy-related headlines as , left the rest as baseline (), and applied CCS. We then did the same for the WSJ.
This gives two summaries for each year, and two for the overall comparison. We then directly read and compared these lists. We see some of the same words in the resulting lists as our head-to-head analysis, but generally have other, more content-specific words that give a richer picture. Note, for the NYT, “renewable,” “greenhouse,” “shale” and “pipeline.” The style-based words do not tend to appear. The within-WSJ comparison produces an overlapping set of words to the NYT comparison, indicating similar coverage between the two sources: see “renewable” there as well. The differences are, however, suggestive: “greenhouse” is indicated for the NYT each year, and the WSJ in 2009 only. OPEC appears in 2008–2010 for the WSJ, and only in 2010 for the NYT.
By shifting what the baseline is (in this case comparing the energy headlines of the NYT to the nonenergy headlines of the NYT instead of the energy headlines of the WSJ), different aspects of the topic, and different aspects of the corpus, are foregrounded. In the “within-source” comparison, we come to understand in general what energy headlines are for the respective sources. In the “between-source” comparison we focus specifically on what differentiates the two outlets, which foregrounds style of writing as well as differential coverage of content. Looking at both seems important for beginning to understand how these themes play out in the media.
6 Conclusions
News media significantly impacts our day-to-day lives, public knowledge and the direction of public policy. Analyzing the news, however, is a complicated task. The labor intensity of hand coding and the amount of news available strongly motivate automated methods.
We proposed a sparse predictive framework for extracting meaningful summaries of specific subjects or topics from document corpora. These summaries are contrast-based, built by comparing two collections of documents to each other and identifying how a primary set differs from a baseline set. This concise and comparative summarization (CCS) framework expands the horizon of possible approaches to text data mining. We offer it as an example of a simpler method that is potentially more manipulable, flexible and interpretable than those based on generative models. In general, we believe that there is a rich area between similar naive methods, such as simple counts and more heavyweight methods such as LDA. Sparse regression, at the heart of CCS, lies in this area and has much to offer.
To better understand the performance of our approach, and to appropriately tune it to maximize the quality and usability of the summaries produced, we conducted a human validation experiment to evaluate different summarizers based on human understanding. Based on the human experiment, we conclude that features selected using a sparse prediction framework can generate informative key-phrase summaries for subjects of interest.
We also found these summaries to be superior to those from simpler methods currently in wide use such as Co-occurrence. In particular, the Lasso is a good overall feature selector, quite robust to how the data is preprocessed and computationally scalable. When not using the Lasso, proper data preparation is quite important. In this case, tf-idf is a good overall choice for article-length documents, but not when the document units are small (e.g., paragraphs and, presumably, headlines, online comments and tweets), in which case an scaling should be used.
We illustrated the use of our summarizers by evaluating two media framing questions. The summarizers indeed allowed for insight and evidence collection. One of the key aspects of our tool is its interactive capacity; a researcher can easily work with resulting summary phrases, using them as topics in their own right, adding them to the concept of the original topic or dropping them altogether. Overall, we argue that CCS allows researchers to easily explore large corpora of documents with an eye to obtaining concise portrayals of any subject they desire. A shortcoming of the tool is that both generating the labeling and interpreting resulting phrases can depend on fairly detailed knowledge of the topic being explored. To help with this, we are currently extending the tool to allow for sentence selection so researchers can contextualize the phrases more rapidly.
Acknowledgments
We are indebted to the staff of the XLab at UC Berkeley for their help in planning and conducting the human validation study. We are also grateful to Hoxie Ackerman and Saheli Datta for help assembling this publication. Luke Miratrix is grateful for the support of a Graduate Research Fellowship from the National Science Foundation. Jinzhu Jia’s work was done when he was a postdoc at UC Berkeley, supplemented by NSF SES-0835531.
References
- Bischof and Airoldi (2012) {bmisc}[author] \bauthor\bsnmBischof, \bfnmJonathan M.\binitsJ. M. and \bauthor\bsnmAiroldi, \bfnmEdoardo M.\binitsE. M. (\byear2012). \bhowpublishedSummarizing topical content with word frequency and exclusivity. In Proceedings of the 29th International Conference on Machine Learning (ICML-12) 201–208. Edinburgh, Scotland. \bptokimsref\endbibitem
- Blei and McAuliffe (2008) {bincollection}[author] \bauthor\bsnmBlei, \bfnmDavid\binitsD. and \bauthor\bsnmMcAuliffe, \bfnmJon\binitsJ. (\byear2008). \btitleSupervised topic models. In \bbooktitleAdvances in Neural Information Processing Systems 20 (\beditor\bfnmJ. C.\binitsJ. C. \bsnmPlatt, \beditor\bfnmD.\binitsD. \bsnmKoller, \beditor\bfnmY.\binitsY. \bsnmSinger and \beditor\bfnmS.\binitsS. \bsnmRoweis, eds.) \bpages121–128. \bpublisherMIT Press, \blocationCambridge, MA. \bptokimsref\endbibitem
- Blei, Ng and Jordan (2003) {barticle}[author] \bauthor\bsnmBlei, \bfnmDavid M.\binitsD. M., \bauthor\bsnmNg, \bfnmAndrew Y.\binitsA. Y. and \bauthor\bsnmJordan, \bfnmMichael I.\binitsM. I. (\byear2003). \btitleLatent Dirichlet allocation. \bjournalJ. Mach. Learn. Res. \bvolume3 \bpages993–1022. \bptokimsref\endbibitem
- Chang et al. (2009) {binproceedings}[author] \bauthor\bsnmChang, \bfnmJonathan\binitsJ., \bauthor\bsnmBoyd-Graber, \bfnmJordan\binitsJ., \bauthor\bsnmGerrish, \bfnmSean\binitsS., \bauthor\bsnmWang, \bfnmChong\binitsC. and \bauthor\bsnmBlei, \bfnmDavid\binitsD. (\byear2009). \btitleReading tea leaves: How humans interpret topic models. In \bbooktitleAdvances in Neural Information Processing Systems 22 (\beditor\bfnmY.\binitsY. \bsnmBengio, \beditor\bfnmD.\binitsD. \bsnmSchuurmans, \beditor\bfnmJ.\binitsJ. \bsnmLafferty, \beditor\bfnmC. K. I.\binitsC. K. I. \bsnmWilliams and \beditor\bfnmA.\binitsA. \bsnmCulotta, eds.) \bpages288–296. \blocationVancouver, BC, Canada. \bptokimsref\endbibitem
- Clavier et al. (2010) {bmisc}[author] \bauthor\bsnmClavier, \bfnmSophia\binitsS., \bauthor\bsnmEl Ghaoui, \bfnmLaurent\binitsL., \bauthor\bsnmBarnesmoore, \bfnmLuke\binitsL. and \bauthor\bsnmLi, \bfnmGuan-Cheng\binitsG.-C. (\byear2010). \bhowpublishedAll the news that’s fit to compare: Comparing Chinese representations in the American Press and US representations in the Chinese press. \bptokimsref\endbibitem
- Dai et al. (2011) {binproceedings}[author] \bauthor\bsnmDai, \bfnmXinyu\binitsX., \bauthor\bsnmJia, \bfnmJinzhu\binitsJ., \bauthor\bsnmEl Ghaoui, \bfnmLaurent\binitsL. and \bauthor\bsnmYu., \bfnmBin\binitsB. (\byear2011). \btitleSBA-term: Sparse bilingual association for terms. In \bbooktitleFifth IEEE International Conference on Semantic Computing (ICSC) \bpages189–192. \bpublisherStanford Univ., \blocationPalo Alto, CA. \bptokimsref\endbibitem
- Eisenstein, Smith and Xing (2011) {binproceedings}[author] \bauthor\bsnmEisenstein, \bfnmJacob\binitsJ., \bauthor\bsnmSmith, \bfnmNoah A.\binitsN. A. and \bauthor\bsnmXing, \bfnmEric P.\binitsE. P. (\byear2011). \btitleDiscovering sociolinguistic associations with structured sparsity. In \bbooktitleProceedings of the 49th Annual Meeting of the Association for Computational Linguistics: Human Language Technologies \bvolume1 \bpages1365–1374. \bpublisherAssociation for Computational Linguistics, \blocationPortland, OR. \bptokimsref\endbibitem
- El Ghaoui, Viallon and Rabbani (2010) {bmisc}[author] \bauthor\bsnmEl Ghaoui, \bfnmLaurent\binitsL., \bauthor\bsnmViallon, \bfnmVivian\binitsV. and \bauthor\bsnmRabbani, \bfnmTarek\binitsT. (\byear2010). \bhowpublishedSafe feature elimination in sparse supervised learning. Technical Report No. UC/EECS-2010-126. EECS Dept., Univ. California, Berkeley. \bptokimsref\endbibitem
- El Ghaoui et al. (2011) {binproceedings}[author] \bauthor\bsnmEl Ghaoui, \bfnmLaurent\binitsL., \bauthor\bsnmLi, \bfnmGuan-Cheng\binitsG.-C., \bauthor\bsnmDuong, \bfnmViet-An\binitsV.-A., \bauthor\bsnmPham, \bfnmVu\binitsV., \bauthor\bsnmSrivastava, \bfnmAshok\binitsA. and \bauthor\bsnmBhaduri, \bfnmKanishka\binitsK. (\byear2011). \btitleSparse machine learning methods for understanding large text corpora: Application to flight reports. In \bbooktitleConference on Intelligent Data Understanding \bpages159–173. \blocationMountain View, CA. \bptokimsref\endbibitem
- Entman (1993) {barticle}[author] \bauthor\bsnmEntman, \bfnmR. M.\binitsR. M. (\byear1993). \btitleFraming: Toward clarification of a fractured paradigm. \bjournalJournal of Communication \bvolume43 \bpages52–57. \bptokimsref\endbibitem
- Entman (2004) {bbook}[author] \bauthor\bsnmEntman, \bfnmR. M.\binitsR. M. (\byear2004). \btitleProjections of power framing news, public opinion, and U.S. foreign policy. \bpublisherUniv. Chicago, \blocationChicago, IL. \bptokimsref\endbibitem
- Forman (2003) {barticle}[author] \bauthor\bsnmForman, \bfnmGeorge\binitsG. (\byear2003). \btitleAn extensive empirical study of feature selection metrics for text classification. \bjournalJ. Mach. Learn. Res. \bvolume3 \bpages1289–1305. \bptokimsref\endbibitem
- Frank et al. (1999) {binproceedings}[author] \bauthor\bsnmFrank, \bfnmEibe\binitsE., \bauthor\bsnmPaynter, \bfnmGordon W.\binitsG. W., \bauthor\bsnmWitten, \bfnmIan H.\binitsI. H., \bauthor\bsnmGutwin, \bfnmCarl\binitsC. and \bauthor\bsnmNevill-Manning, \bfnmCraig G.\binitsC. G. (\byear1999). \btitleDomain-specific keyphrase extraction. In \bbooktitleProceedings of the Sixteenth International Joint Conference on Artificial Intelligence (IJCAI-99) \bpages668–673. \bpublisherMorgan Kaufmann, \blocationSan Francisco, CA. \bptokimsref\endbibitem
- Gawalt et al. (2010) {binproceedings}[author] \bauthor\bsnmGawalt, \bfnmBrian\binitsB., \bauthor\bsnmJia, \bfnmJinzhu\binitsJ., \bauthor\bsnmMiratrix, \bfnmLuke W.\binitsL. W., \bauthor\bsnmGhaoui, \bfnmLaurent\binitsL., \bauthor\bsnmYu, \bfnmBin\binitsB. and \bauthor\bsnmClavier, \bfnmSophia\binitsS. (\byear2010). \btitleDiscovering word associations in news media via feature selection and sparse classification. In \bbooktitleProceedings of the International Conference on Multimedia Information Retrieval (MIR’10) \bpages211–220. \blocationPhiladelphia, PA. \bptokimsref\endbibitem
- Genkin, Lewis and Madigan (2007) {barticle}[mr] \bauthor\bsnmGenkin, \bfnmAlexander\binitsA., \bauthor\bsnmLewis, \bfnmDavid D.\binitsD. D. and \bauthor\bsnmMadigan, \bfnmDavid\binitsD. (\byear2007). \btitleLarge-scale Bayesian logistic regression for text categorization. \bjournalTechnometrics \bvolume49 \bpages291–304. \biddoi=10.1198/004017007000000245, issn=0040-1706, mr=2408634 \bptokimsref\endbibitem
- Goffman (1974) {bbook}[author] \bauthor\bsnmGoffman, \bfnmE.\binitsE. (\byear1974). \btitleFrame Analysis: An Essay on the Organization of Experience. \bpublisherHarvard Univ. Press, \blocationCambridge, MA. \bptokimsref\endbibitem
- Goldstein et al. (2000) {binproceedings}[author] \bauthor\bsnmGoldstein, \bfnmJade\binitsJ., \bauthor\bsnmMittal, \bfnmVibhu\binitsV., \bauthor\bsnmCarbonell, \bfnmJaime\binitsJ. and \bauthor\bsnmKantrowitz, \bfnmMark\binitsM. (\byear2000). \btitleMulti-document summarization by sentence extraction. In \bbooktitleNAACL-ANLP 2000 Workshop on Automatic Summarization \bpages40–48. \blocationSeattle, WA. \bptokimsref\endbibitem
- Grimmer et al. (2011) {bmisc}[author] \bauthor\bsnmGrimmer, \bfnmJustin\binitsJ., \bauthor\bsnmShorey, \bfnmRachel\binitsR., \bauthor\bsnmWallach, \bfnmHanna\binitsH. and \bauthor\bsnmZlotnick, \bfnmFrances\binitsF. (\byear2011). \bhowpublishedA class of Bayesian semiparametric cluster-topic models for political texts. \bptokimsref\endbibitem
- Hastie, Tibshirani and Friedman (2011) {bbook}[author] \bauthor\bsnmHastie, \bfnmT.\binitsT., \bauthor\bsnmTibshirani, \bfnmR.\binitsR. and \bauthor\bsnmFriedman, \bfnmJ. H.\binitsJ. H. (\byear2011). \btitleThe Elements of Statistical Learning, Vol. 1. \bpublisherSpringer, \blocationNew York. \bptokimsref\endbibitem
- Hennig (2009) {binproceedings}[author] \bauthor\bsnmHennig, \bfnmLeonhard\binitsL. (\byear2009). \btitleTopic-based multi-document summarization with probabilistic latent semantic analysis. In \bbooktitleRecent Advances in Natural Language Processing (RANLP) \bpages144–149. \bpublisherAssociation for Computational Linguistics, \blocationBorovets, Bulgaria. \bptokimsref\endbibitem
- Hopkins and King (2010) {barticle}[author] \bauthor\bsnmHopkins, \bfnmDaniel\binitsD. and \bauthor\bsnmKing, \bfnmGary\binitsG. (\byear2010). \btitleA method of automated nonparametric content analysis for social science. \bjournalAmerican Journal of Political Science \bvolume54 \bpages229–247. \bptokimsref\endbibitem
- Ifrim, Bakir and Weikum (2008) {binproceedings}[author] \bauthor\bsnmIfrim, \bfnmGeorgiana\binitsG., \bauthor\bsnmBakir, \bfnmGökhan\binitsG. and \bauthor\bsnmWeikum, \bfnmGerhard\binitsG. (\byear2008). \btitleFast logistic regression for text categorization with variable-length N-grams. In \bbooktitle14th ACM SIGKDD International Conference on Knowledge Discovery and Data Mining \bpages354–362. \bpublisherACM, \blocationNew York. \bptokimsref\endbibitem
- Jia et al. (2011) {bmisc}[author] \bauthor\bsnmJia, \bfnmJinzhu\binitsJ., \bauthor\bsnmMiratrix, \bfnmLuke W.\binitsL. W., \bauthor\bsnmGawalt, \bfnmBrian\binitsB., \bauthor\bsnmYu, \bfnmBin\binitsB. and \bauthor\bsnmEl Ghaoui, \bfnmLaurent\binitsL. (\byear2011). \bhowpublishedWhat is in the news on a subject: Automatic and sparse summarization of large document corpora. Technical Report #801, Dept. Statistics, Univ. California, Berkeley. \bptokimsref\endbibitem
- Kiousis and Wu (2008) {barticle}[author] \bauthor\bsnmKiousis, \bfnmSpiro\binitsS. and \bauthor\bsnmWu, \bfnmXu\binitsX. (\byear2008). \btitleInternational agenda-building and agenda-setting: Exploring the influence of public relations counsel on US news media and public perceptions of foreign nations. \bjournalThe International Communications Gazette \bvolume70 \bpages58–75. \bptokimsref\endbibitem
- Kunczik (2000) {bmisc}[author] \bauthor\bsnmKunczik, \bfnmMichael\binitsM. (\byear2000). \bhowpublishedGlobalisation: News media, images of nations and the flow of international capital with special reference to the role of rating agencies. J. International Communication 8 39–79. \bptokimsref\endbibitem
- Lazer et al. (2009) {barticle}[pbm] \bauthor\bsnmLazer, \bfnmDavid\binitsD., \bauthor\bsnmPentland, \bfnmAlex\binitsA., \bauthor\bsnmAdamic, \bfnmLada\binitsL., \bauthor\bsnmAral, \bfnmSinan\binitsS., \bauthor\bsnmBarabasi, \bfnmAlbert-Laszlo\binitsA.-L., \bauthor\bsnmBrewer, \bfnmDevon\binitsD., \bauthor\bsnmChristakis, \bfnmNicholas\binitsN., \bauthor\bsnmContractor, \bfnmNoshir\binitsN., \bauthor\bsnmFowler, \bfnmJames\binitsJ., \bauthor\bsnmGutmann, \bfnmMyron\binitsM., \bauthor\bsnmJebara, \bfnmTony\binitsT., \bauthor\bsnmKing, \bfnmGary\binitsG., \bauthor\bsnmMacy, \bfnmMichael\binitsM., \bauthor\bsnmRoy, \bfnmDeb\binitsD. and \bauthor\bparticleVan \bsnmAlstyne, \bfnmMarshall\binitsM. (\byear2009). \btitleComputational social science. \bjournalScience \bvolume323 \bpages721–723. \biddoi=10.1126/science.1167742, issn=1095-9203, mid=NIHMS98137, pii=323/5915/721, pmcid=2745217, pmid=19197046 \bptokimsref\endbibitem
- Lee and Chen (2006) {barticle}[author] \bauthor\bsnmLee, \bfnmL.\binitsL. and \bauthor\bsnmChen, \bfnmS.\binitsS. (\byear2006). \btitleNew methods for text categorization based on a new feature selection method and a new similarity measure between documents. \bjournalLecture Notes in Comput. Sci. \bvolume4031 \bpages1280. \bptokimsref\endbibitem
- McLeod, Kosicki and Pan (1991) {bbook}[author] \bauthor\bsnmMcLeod, \bfnmM.\binitsM., \bauthor\bsnmKosicki, \bfnmG. M.\binitsG. M. and \bauthor\bsnmPan, \bfnmZ.\binitsZ. (\byear1991). \btitleOn Understanding and Misunderstanding Media Effects. \bpublisherEdward Arnold, \blocationLondon. \bptokimsref\endbibitem
- Monroe, Colaresi and Quinn (2008) {barticle}[author] \bauthor\bsnmMonroe, \bfnmBurt L.\binitsB. L., \bauthor\bsnmColaresi, \bfnmMichael P.\binitsM. P. and \bauthor\bsnmQuinn, \bfnmKevin M.\binitsK. M. (\byear2008). \btitleFightin’ words: Lexical feature selection and evaluation for identifying the content of political conflict. \bjournalPolitical Analysis \bvolume16 \bpages372–403. \bptokimsref\endbibitem
- Mosteller and Wallace (1984) {bbook}[mr] \bauthor\bsnmMosteller, \bfnmFrederick\binitsF. and \bauthor\bsnmWallace, \bfnmDavid L.\binitsD. L. (\byear1984). \btitleApplied Bayesian and Classical Inference: The Case of The Federalist Papers, \bedition2nd ed. \bpublisherSpringer, \blocationNew York. \biddoi=10.1007/978-1-4612-5256-6, mr=0766742 \bptokimsref\endbibitem
- Neto, Freitas and Kaestner (2002) {bincollection}[mr] \bauthor\bsnmNeto, \bfnmJoel Larocca\binitsJ. L., \bauthor\bsnmFreitas, \bfnmAlex A.\binitsA. A. and \bauthor\bsnmKaestner, \bfnmCelso A. A.\binitsC. A. A. (\byear2002). \btitleAutomatic text summarization using a machine learning approach. In \bbooktitleAdvances in Artificial Intelligence. \bseriesLecture Notes in Computer Science \bvolume2507 \bpages205–215. \bpublisherSpringer, \blocationBerlin. \biddoi=10.1007/3-540-36127-8_20, mr=2048852 \bptokimsref\endbibitem
- Paul, Zhai and Girju (2010) {binproceedings}[author] \bauthor\bsnmPaul, \bfnmMichael J.\binitsM. J., \bauthor\bsnmZhai, \bfnmChengXiang\binitsC. and \bauthor\bsnmGirju, \bfnmRoxana\binitsR. (\byear2010). \btitleSummarizing contrastive viewpoints in opinionated text. In \bbooktitleProceedings of the 2010 Conference on Empirical Methods in Natural Language Processing \bpages66–76. \bpublisherAssociation for Computational Linguistics, Stroudsburg, PA. \bptokimsref\endbibitem
- Pottker (2003) {barticle}[author] \bauthor\bsnmPottker, \bfnmH.\binitsH. (\byear2003). \btitleNews and its communicative quality: The inverted pyramid—when and why did it appear? \bjournalJournalism Studies \bvolume4 \bpages501–511. \bptokimsref\endbibitem
- Rose et al. (2010) {bincollection}[author] \bauthor\bsnmRose, \bfnmStuart\binitsS., \bauthor\bsnmEngel, \bfnmDave\binitsD., \bauthor\bsnmCramer, \bfnmNick\binitsN. and \bauthor\bsnmCowley, \bfnmWendy\binitsW. (\byear2010). \btitleAutomatic keyword extraction from individual documents. In \bbooktitleText Mining: Applications and Theory (\beditor\bfnmMichael W.\binitsM. W. \bsnmBerry and \beditor\bfnmJacob\binitsJ. \bsnmKogan, eds.). \bpublisherWiley, \blocationChichester. \bptokimsref\endbibitem
- Salton (1991) {barticle}[pbm] \bauthor\bsnmSalton, \bfnmG.\binitsG. (\byear1991). \btitleDevelopments in automatic text retrieval. \bjournalScience \bvolume253 \bpages974–980. \biddoi=10.1126/science.253.5023.974, issn=0036-8075, pii=253/5023/974, pmid=17775340 \bptokimsref\endbibitem
- Salton and Buckley (1988) {barticle}[author] \bauthor\bsnmSalton, \bfnmG.\binitsG. and \bauthor\bsnmBuckley, \bfnmC.\binitsC. (\byear1988). \btitleTerm-weighting approaches in automatic text retrieval. \bjournalInformation Processing and Management \bvolume24 \bpages513–523. \bptokimsref\endbibitem
- Senellart and Blondel (2008) {bincollection}[author] \bauthor\bsnmSenellart, \bfnmP.\binitsP. and \bauthor\bsnmBlondel, \bfnmV. D.\binitsV. D. (\byear2008). \btitleAutomatic discovery of similar words. In \bbooktitleSurvey of Text Mining II. \bpublisherSpringer, \blocationBerlin. \bptokimsref\endbibitem
- Shahaf, Guestrin and Horvitz (2012) {binproceedings}[author] \bauthor\bsnmShahaf, \bfnmDafna\binitsD., \bauthor\bsnmGuestrin, \bfnmCarlos\binitsC. and \bauthor\bsnmHorvitz, \bfnmEric\binitsE. (\byear2012). \btitleTrains of thought: Generating information maps. In \bbooktitleProceedings of the 21st International Conference on World Wide Web \bpages899–908. \bpublisherACM, \blocationLyon, France. \bptokimsref\endbibitem
- Tibshirani (1996) {barticle}[mr] \bauthor\bsnmTibshirani, \bfnmRobert\binitsR. (\byear1996). \btitleRegression shrinkage and selection via the lasso. \bjournalJ. R. Stat. Soc. Ser. B Stat. Methodol. \bvolume58 \bpages267–288. \bidissn=0035-9246, mr=1379242 \bptokimsref\endbibitem
- Wagstaff (2012) {binproceedings}[author] \bauthor\bsnmWagstaff, \bfnmKiri L.\binitsK. L. (\byear2012). \btitleMachine learning that matters. In \bbooktitle29th International Conference on Machine Learning \bpages1–6. \blocationEdinburgh, Scotland. \bptokimsref\endbibitem
- Yang and Pendersen (1997) {binproceedings}[author] \bauthor\bsnmYang, \bfnmY.\binitsY. and \bauthor\bsnmPendersen, \bfnmI. O.\binitsI. O. (\byear1997). \btitleA comparative study on feature selection in text categorization. In \bbooktitleICML-97, 14th International Conference on Machine Learning \bpages412–420. \blocationNashville, TN. \bptokimsref\endbibitem
- Zhang and Oles (2001) {barticle}[author] \bauthor\bsnmZhang, \bfnmTong\binitsT. and \bauthor\bsnmOles, \bfnmFrank J.\binitsF. J. (\byear2001). \btitleText categorization based on regularized linear classfiication methods. \bjournalInformation Retrieval \bvolume4 \bpages5–31. \bptokimsref\endbibitem
- Zhao and Yu (2007) {barticle}[mr] \bauthor\bsnmZhao, \bfnmPeng\binitsP. and \bauthor\bsnmYu, \bfnmBin\binitsB. (\byear2007). \btitleStagewise lasso. \bjournalJ. Mach. Learn. Res. \bvolume8 \bpages2701–2726. \bidissn=1532-4435, mr=2383572 \bptokimsref\endbibitem
- Zubiaga et al. (2011) {binproceedings}[author] \bauthor\bsnmZubiaga, \bfnmArkaitz\binitsA., \bauthor\bsnmSpina, \bfnmDamiano\binitsD., \bauthor\bsnmFresno, \bfnmVíctor\binitsV. and \bauthor\bsnmMartínez, \bfnmRaquel\binitsR. (\byear2011). \btitleClassifying trending topics: A typology of conversation triggers on Twitter. In \bbooktitleProceedings of the 20th ACM International Conference on Information and Knowledge Management (CIKM’11) \bpages2461–2464. \bpublisherACM, \blocationNew York. \bptokimsref\endbibitem