NuSTAR Discovery of a Young, Energetic Pulsar Associated with
the
Luminous Gamma-ray Source HESS J1640465
Abstract
We report the discovery of a 206 ms pulsar associated with the TeV -ray source HESS J1640465 using the Nuclear Spectroscopic Telescope Array (NuSTAR) X-ray observatory. PSR J16404631 lies within the shell-type supernova remnant (SNR) G338.30.0, and coincides with an X-ray point source and putative pulsar wind nebula (PWN) previously identified in XMM-Newton and Chandra images. It is spinning down rapidly with period derivative , yielding a spin-down luminosity erg s-1, characteristic age 3350 yr, and surface dipole magnetic field strength G. For the measured distance of 12 kpc to G338.30.0, the TeV luminosity of HESS J1640465 is 6% of the pulsar’s present . The Fermi source 1FHL J1640.54634 is marginally coincident with PSR J16404631, but we find no -ray pulsations in a search using 5 years of Fermi Large Area Telescope (LAT) data. The pulsar energetics support an evolutionary PWN model for the broad-band spectrum of HESS J1640465, provided that the pulsar’s braking index is , and that its initial spin period was ms.
Subject headings:
ISM: individual (G338.30.0, HESS J1640465, 1FHL J1640.54634) — pulsars: individual (PSR J16404631) — stars: neutron — supernova remnants1. Introduction
The detection by the HESS Galactic plane survey (Aharonian et al., 2005) of eV radiation coming from the diffuse remains of supernovae has opened up a new window on the evolution of these energetic stellar remnants. More than 2/3 of the Galactic TeV sources111TeVCat, http://tevcat.uchicago.edu/ are supernova remnants (SNRs) or pulsar wind nebulae (PWNe), the latter being the most numerous class.
High-energy radiation from PWNe is produced as a result of the interaction of the pulsar wind with the surrounding medium. Many young PWNe are found inside shell SNRs, where the emission begins at a termination shock situated close to the pulsar. Downstream of the shock the relativistic electrons radiate synchrotron photons from radio through X-rays. The same electrons up-scatter ambient photons, creating a second, broad spectral peak in the -ray band. Some SNR shells also emit high-energy -rays, although the dominant mechanism there is less clear. One possibility is the hadronic scenario, decay of mesons created in collisions between shock accelerated cosmic-ray protons and thermal gas. However, leptonic models involving inverse Compton scattering of ambient photons are also invoked (for a review see Reynolds, 2008).
HESS J1640465 (Aharonian et al., 2006) is coincident with G338.30.0, a shell-type, diameter SNR (Shaver & Goss, 1970; Whiteoak & Green, 1996). The TeV emission was described as resolved, but centrally peaked. Deeper observations (HESS Collaboration, 2014) show a more extended source than first reported, with Gaussian = and a flux above 200 Gev of erg cm-2 s-1. Based on 21 cm H I absorption spectra to G338.30.0 and adjacent H II regions, Lemiere et al. (2009) concluded that the distance to G338.30.0 is in the range kpc, which makes HESS J1640465 the most luminous TeV source in the Galaxy, with erg s-1.
An XMM-Newton observation by Funk et al. (2007) identified a highly absorbed X-ray point source coincident with the HESS source with clear indication of extended emission. The X-ray components were subsequently well resolved by Chandra (Lemiere et al., 2009). No X-ray emission is detected from the SNR shell, probably because of its low temperature and large intervening column density, cm-2. The power-law spectrum of the Chandra point source, with photon index , is consistent with a pulsar origin. The compact X-ray PWN is in diameter, smaller than the TeV source, while its spectral index, , is much steeper than that of the pulsar. Its spectrum steepens further in the outer parts, which is evidence of synchrotron aging. No radio counterpart to the X-ray PWN is detected in high-resolution images of G338.30.0 using the GMRT at 235, 610, or 1280 MHz, and ATCA maps at 1290 and 2300 MHz, and no radio pulsations were found by the GMRT at 610 and 1280 MHz (Castelletti et al., 2011).
The Fermi source 1FGL J1640.84634, coincident in position with HESS J1640465, was interpreted by Slane et al. (2010) as leptonic emission from a PWN. Their derived GeV spectrum is not cut off as would be the case for magnetospheric pulsar emission, but is continuous with the HESS spectrum. In contrast, HESS Collaboration (2014) interpreted the joint Fermi/HESS spectrum and revised TeV extent in terms of hadronic emission from a portion of the SNR shell interacting with dense interstellar gas. More recent analyses of additional Fermi data (Nolan et al., 2012; Acero et al., 2013; Ackermann et al., 2013) show less flux than Slane et al. (2010) found, and the revision will affect both models.
In this paper, we present the discovery of X-ray pulsations from HESS J1640465/G338.30.0 in data acquired as part of the NuSTAR survey of the Norma Arm region of the Galactic plane (Harrison et al., 2013; Fornasini et al., 2014), and a follow-up observation to determine the pulsar’s energetics. Section 2 describes the NuSTAR observations, pulsar analysis, and spectrum. In Section 3 we report on an unsuccessful search of the Fermi LAT data for -ray pulsations. In Section 4 we discuss the properties of HESS J1640465/G338.30.0 in the context of previous leptonic PWN models for its broad-band spectrum, and use the measured spin parameters of PSR J16404631 in a revised evolutionary PWN model. Some of the implications of our model, and a comparison of its assumptions and results with the hadronic model of HESS Collaboration (2014), are presented in Section 5.
2. NuSTAR Observations
The field containing HESS J1640465 was observed by NuSTAR in three offset pointings of ks each on 2013 June 20–24 as part of a survey of the Norma region of the Galactic plane. However, the source fell in the chip gap for the first observation (ObsID 40014011002) so we exclude this data set in the final timing and spectral analysis. A follow-up, dedicated 90 ks observation of HESS J1640465 was performed on 2013 September 29. An observation log is presented in Table 1. Data were collected using NuSTAR’s two co-aligned X-ray telescopes, with corresponding focal plane modules FPMA and FPMB. These telescopes provide FWHM imaging resolution over the 3–79 keV X-ray band, with a characteristic spectral resolution of 400 eV FWHM at 10 keV (Harrison et al., 2013). The reconstructed NuSTAR coordinates are accurate to at 90% confidence. The relative timing accuracy of NuSTAR is limited to ms rms, after correcting for thermal drift of the on-board clock, with the absolute time scale shown to be better than ms (Mori et al., 2014).
Data were processed and analyzed using NuSTARDAS v1.3.1 and HEASOFT v6.15.1 and the Calibration Database (CALDB) files from 2013 August 30. Our analysis used the standard level-1 filtered event files generated by nupipeline. The observations were free of significant time variable particle background contamination. However, each data set has a unique spatial background pattern across the field-of-view, which affects the sensitivity to a pulsed signal.
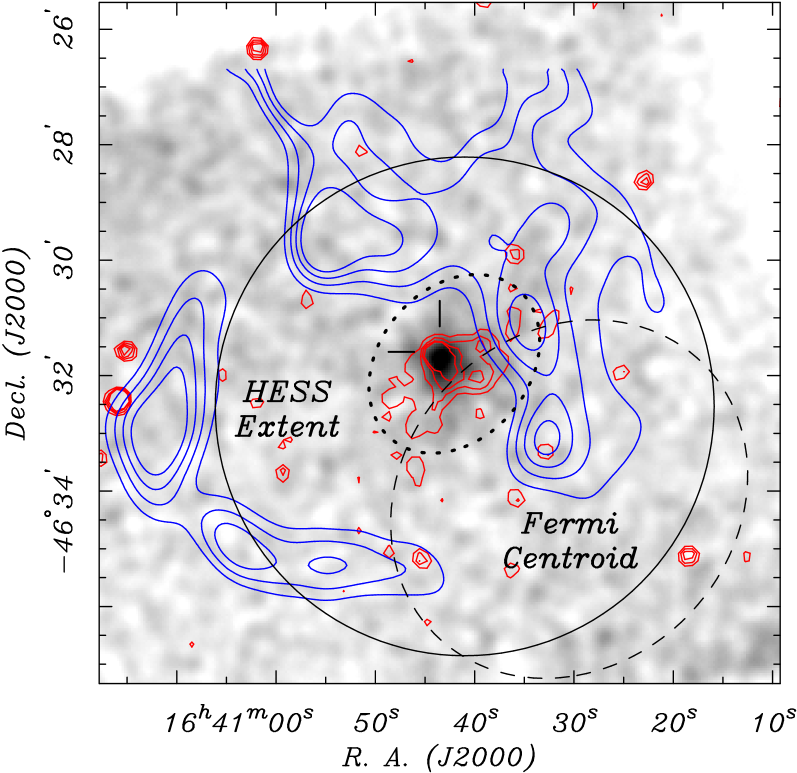
Figure 1 displays the NuSTAR 3–79 keV image of HESS J1640465, obtained on 2013 June 22 with the source on-axis (ObsID 40014016001). The image has been corrected for exposure, smoothed using a Gaussian kernel, and scaled linearly. There is one significant source whose position is from the putative pulsar CXOU J164043.5463135, which is coincident within the NuSTAR positional uncertainty. There is evidently diffuse emission surrounding the point source, consistent with that found in XMM-Newton and Chandra images, and interpreted as a PWN (Funk et al., 2007; Lemiere et al., 2009). This, plus its X-ray flux and spectrum (see below) leave no doubt that the NuSTAR source is the counterpart of CXOU J164043.5463135. The most recent Chandra image obtained on 2011 June 6 (Fornasini et al., 2014) shows that this source has not varied compared to the two previous Chandra observations of 2010 June 19 and 2007 May 11.
| ObsID | Start Date | Exposure/ | RateaaBackground subtracted keV count rate in a radius aperture. | Start Epoch | PeriodbbPeriod derived from a test. The Monte-Carlo derived uncertainty on the last digits is in parentheses. | |
|---|---|---|---|---|---|---|
| (UT) | Span (ks) | (s-1) | (MJD) | (s) | ||
| 40014016001/17001 | 2013 Jun 22 | 48.6/96.5 | 0.011 | 56,465.91194958 | 0.206443040(33) | 59 |
| 30002021002/21003 | 2013 Sep 29 | 89.9/166.4 | 0.011 | 56,564.29199072 | 0.206451335(17) | 79 |
| Parameter | Value |
|---|---|
| R.A. (J2000.0)aaChandra position from Lemiere et al. (2009). | |
| Decl. (J2000.0)aaChandra position from Lemiere et al. (2009). | |
| Epoch (MJD TDB) | 56,466.0 |
| Frequencybb uncertainties given in parentheses., | 4.843950957(40) Hz |
| Frequency derivativebb uncertainties given in parentheses., | Hz s-1 |
| Periodbb uncertainties given in parentheses., | 0.206443048(33) s |
| Period derivativebb uncertainties given in parentheses., | |
| Spin-down luminosity, | erg s-1 |
| Characteristic age, | 3350 yr |
| Surface dipole magnetic field, | G |


2.1. Timing Analysis
To search for pulsations from CXOU J164043.5463135, we examined NuSTAR data obtained during the two Norma Arm survey pointings, adjacent in time. The day-long data set yields a total of 913 photons from the two focal plane modules, extracted in the optimal keV energy bandpass using a radius aperture centered on the source location. Photon arrival times were corrected for clock drift and converted to barycentric dynamical time (TDB) using the JPL DE200 ephemeris and the Chandra coordinates of the point source. The arrival times were binned at 2 ms and searched for coherent pulsations up to the Nyquist frequency using a bin fast Fourier transform (FFT). We found a 206 ms coherent signal with a power of , significant at the () confidence level. This motivated a second-epoch observation from which we were able to confirm the detection () and measure the spin-down rate of the pulsar as described next.
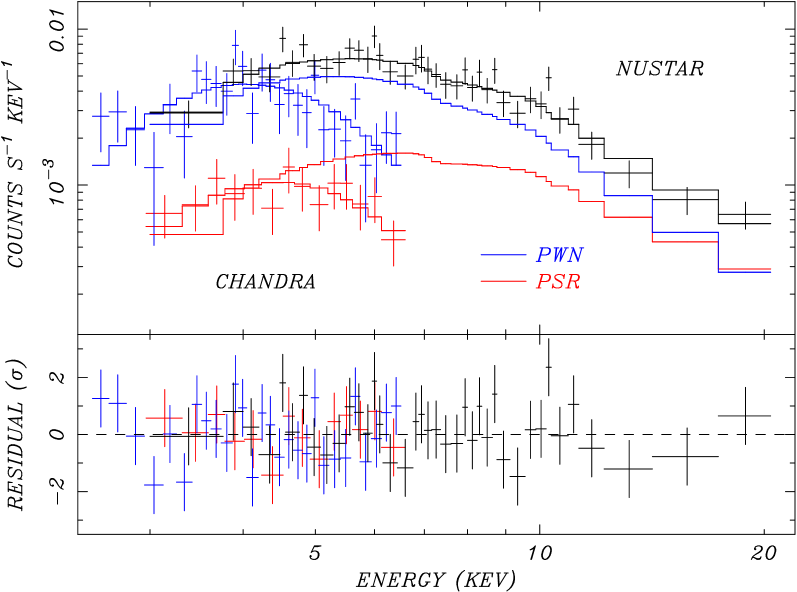
We computed the spin-down rate from the difference in frequency over the 100 day time span between the June and September observations. For each data set, we generated a refined frequency measurement by oversampling the signal using the test statistic around the known frequency (Table 1). We then re-fitted for frequency by including the frequency derivative in the light-curve folds, as each observation is sufficiently long that spin-down smears the pulsed signal ( and 0.32 cycles for the first and second epoch, respectively). The final period measurement used the iterated period derivative reported in Table 2. The uncertainties are estimated from a Monte Carlo simulation of the light curve using the method described by Gotthelf et al. (1999). The final power spectra are shown in Figure 2 (left). The derived physical parameters in Table 2 are from the relations , where g cm2, and the dipole spin-down relations and G.
Figure 2 (right) shows the highly modulated pulse profile characterized by a relatively sharp peak and broad trough compared to a pure sinusoid signal. The pulsed fraction in the keV band is after allowing for the background level in the source aperture, estimated using data from a concentric annulus. This increases to after taking into account contamination from the PWN in the source aperture using the spectral results presented below. Here, we define the pulsed fraction as the ratio of the pulsed emission to the net source (background subtracted) flux. To determine the unpulsed level we take the average of the two lowest bins in the 16-bin folded light curve of Figure 2. The pulse shape shows no variation with energy, within statistics.
2.2. Spectral analysis
For spectral study we extracted photons from the observations listed in Table 1 using an elliptical region of diameter whose major-axis is oriented at position angle , centered on the apparent enhanced PWN emission at (J2000) , which is offset by from the pulsar (see Figure 1). We estimate the background using nearby radius circular regions carefully chosen to account for stray light in the focal planes in two of the observations. Response matrices were generated for each spectral file using the NuSTAR analysis software. All eight spectra were combined, as were their matching response matrices, and fitted using the XSPEC software package (Arnaud, 1996) with minimization. The fitting is limited to the 3–20 keV range due to low signal-to-noise at higher energies. In this range, the combined spectrum yields a total of 14,100 source plus background photons, and is grouped to obtain a minimum detection significance of per spectral bin.
The NuSTAR spectrum in the large aperture is dominated by PWN emission and is well fit by an absorbed power-law model as expected for non-thermal emission from the nebula. We used the tbabs absorption model, with Wilms et al. (2000) abundances and Verner et al. (1996) cross sections, and obtain a best-fit cm-2 and . Errors are 90% confidence level ( for two interesting parameters) determined from the error ellipse contour extrema. This provides an acceptable fit with a reduced for 36 degrees of freedom (dof). The absorbed 2–10 keV flux is erg cm-2 s-1 (90% confidence). This is consistent with the values reported by Funk et al. (2007) using XMM-Newton data extracted from a diameter aperture centered on the PWN.
To further constrain the PWN emission and to isolation the pulsar contribution to the NuSTAR spectrum, we include the Chandra spectrum of the pulsar and PWN in the fitting process. We supplemented the Chandra data set (ObsID 7591) previously analyzed as part of the study of HESS J1640465 by Lemiere et al. (2009) with data obtained on 2011 June 6 (ObsID 12508). These data were acquired with the Advanced CCD Imaging Spectrometer (ACIS, Garmire et al., 2003) and reprocessed using the chandra_repro package of the Chandra Interactive Analysis of Observations (CIAO) software suite. Spectra and their response matrices from the two observations were produced using specextract. The pulsar and PWN spectra are grouped with a minimum of 10 and 40 counts per spectral bin, respectively, and each fitted with the absorbed power-law model, using a common column density.
We used an extraction radius of for the pulsar; the background is negligible in this small region. For the PWN we used the NuSTAR elliptical region and similar background region. We combined spectra from the individual observations, and their response matrices, as above. Although the ACIS-I detector is sensitive in the 0.5–10 keV energy range, we restricted the spectral fits to the 3–7 keV range due to the high absorption and limited statistics. A total of 142 and 1369 photons were fitted for the pulsar and PWN, respectively, during the 47 ks exposure. The second column of Table 3 presents the resulting spectral fits for the pulsar and PWN spectra using the Chandra data alone222The fluxes described in Lemiere et al. (2009) as unabsorbed are not consistent with the (absorbed) fluxes given in Table 3 or with those presented by Funk et al. (2007); the Lemiere et al. (2009) values are likely absorbed fluxes, mischaracterized..
We fitted the Chandra and NuSTAR spectra together using two power laws as before, with their column densities tied. To constrain the pulsar and PWN contributions to the NuSTAR spectrum, we fixed the power-law indices to the Chandra models and tied their flux together in the overlapping 2–10 keV band. To allow for flux calibration differences between the two missions we introduce an overall normalization constant to the NuSTAR model, with best fit value of . The resulting spectrum is shown in Figure 3, and the parameters are reported in Table 3. The NuSTAR spectra of the pulsar and PWN are evidently successfully modeled, as the fitted values are in good agreement with the Chandra results for each component. To estimate the PWN contribution to the pulse profile shown in Figure 2, we repeated our spectral analysis using a radius aperture; the PWN is found to account for of the background-subtracted source flux in pulse profile.
| Parameter | Chandra only | Chandra +NuSTAR |
|---|---|---|
| (cm-2) | ||
| (2–10 keV) | ||
| (2–10 keV) | ||
| (dof) | 1.0 (56) | 0.82 (79) |
Note. — Absorbed power-law model fits to the pulsar and the PWN spectra with their column densities linked. The simultaneous fit to NuSTAR and Chandra data is described in the text. The uncertainties are 90% confidence limits determined from the error ellipse extrema. The given fluxes are absorbed, in units of erg cm-2 s-1.
3. Search for Gamma-ray Pulsations
Although Slane et al. (2010) argue that the GeV emission from 1FGL J1640.84634 originates from the PWN, the Fermi source is spatially unresolved and marginally consistent with the position of the pulsar. Therefore, we searched the Fermi LAT data at the position of PSR J16404631 for a pulsed signal. The X-ray timing parameters and their errors given in Table 2 allow a search for pulsations around the known values. We extract photon arrival times from 2008 August 4 to 2013 October 2. These data were reprocessed using the “Pass 7” event reconstruction algorithm. We selected “source” photons for zenith angles and restricted the energy range to MeV to minimize Earth limb and diffuse Galactic -ray background contamination. The photon arrival times were corrected to the solar system barycenter using the JPL DE405 ephemeris and the Chandra coordinates. For our nominal pulsar search we extracted photons from an energy-dependent radius enclosing 95% of the point spread function.
Because the sparse X-ray observations do not provide a phase-connected ephemeris, unknown timing noise could limit the practical time span of a coherent pulsar search. Accordingly, we grouped the photons into intervals of 100 days and searched for a significant signal over a range of centered on interpolated values at the test epoch using the X-ray timing parameters. This range corresponds to three times the uncertainty on each of and . We used the -test statistic (de Jager & Büsching, 2010) to allow for a complex profile with narrow features. This test selects the Fourier harmonic that results in the most significant normalized power.
None of the resulting searches yielded a significant signal above the noise. We also summed the power from these searches for each pair, to increase the signal sensitivity. No significant signal was apparent. To explore a range of instrumental parameters that might be more sensitive, we repeated our search for a low-energy cutoff of 100, 300, and 500 MeV, and time interval of 30, 200, and 300 days. Despite the expanded range of parameter space, no signal stronger than the expected noise is detected in each search or in the summed results.
4. Modeling the Broad-band Spectrum
4.1. Age, Energetics, and Distance
The discovery of PSR J16404631 supports the conjecture that CXOU J164043.5463135, HESS J1640465, and 1FHL J1640.54634 are all manifestations of a middle-aged pulsar/PWN system. For the measured distance of 12 kpc to G338.30.0 (see below), the TeV luminosity of HESS J1640465 is 6% of the pulsar’s present , while the ratio , indicating that, in a leptonic model where the TeV emission results from up scattering of ambient photons by relativistic electrons, inverse Compton losses now dominate over synchrotron emission.
A result that was perhaps unexpected is the young characteristic age of the pulsar. The pulsar’s characteristic age, 3350 yr, is an approximate measure that applies when a simple vacuum dipole spin-down model is assumed, and when the spin period is significantly larger than that at birth. Although pulsars for which the model has been tested do not rotate like simple vacuum dipoles (Kaspi et al., 2001), it is notable that, excluding magnetars, there are only seven pulsars with yr in the Australia Telescope National Facility (ATNF) catalog333http://www.atnf.csiro.au/research/pulsar/psrcat/expert.html (Manchester et al., 2005), followed by PSR J16404631 with 3350 yr. This is younger than most authors have assumed in modeling the evolution of HESS J1640465/G338.30.0 ( kyr, Funk et al. 2007; kyr, Lemiere et al. 2009; kyr, Slane et al. 2010). Fang & Zhang (2010) presented two models similar to that of Slane et al. (2010), one with erg s-1 and yr, and the other with erg s-1 and yr. While these ages are closer to the likely true age, the actual spin-down power of PSR J16404631 is considerably smaller than the assumed values.
Prior models for G338.30.0 estimate the age of the SNR from its radius assuming that it is in the Sedov phase with (Spitzer, 1978). These estimates are imprecise due to the unknown energy of the explosion and the ambient mass density , and the strong dependence of age on radius, which magnifies any uncertainty in distance. Also, the pulsar is offset from the center of the SNR in a direction that, given the morphology of the PWN, cannot be explained by high kick velocity. Lemiere et al. (2009) conclude that the geometrical center of the remnant is not the explosion site. Instead, the structure of the remnant may be affected by complicated interactions with the local ISM, which could affect the estimation of its age.
There is no near/far distance ambiguity for G338.30.0 because 21 cm absorption is seen up to the maximum negative value at the tangent point in both it and adjacent H II regions. Lemiere et al. (2009) concluded that the distance to G338.30.0 is in the range kpc, while Kothes & Dougherty (2007) had already found a value of kpc from the same 21 cm data, but assuming a Galactic center distance of 7.6 kpc instead of 8.5 kpc. We adopt kpc here. While the distance appears to be constrained well, there is no direct measurement of the ambient density; the above referenced models assume values of between 0.1 cm-3 and 10 cm-3. Castelletti et al. (2011) estimated an electron density of 100–165 cm-3 for the western and northern part of the SNR shell by assuming that the low-energy turnover of its radio spectrum is due to local free-free absorption. They also searched the NANTEN CO survey data for molecular gas that could be target material for hadronic production of -rays from protons accelerated in the SNR shell, but did not find any that could be associated with G338.30.0.
4.2. A Hadronic Model
HESS Collaboration (2014) present a model in which the TeV emission is produced by hadronic interactions in the north and west part of the SNR shell. It is motivated largely by the continuity of the Slane et al. (2010) Fermi spectrum with the HESS spectrum, which they argue is difficult to fit in a PWN model, and also by the overlap of the TeV source with the side of the SNR shell that is adjacent to H II regions. They require a high ambient density of 150 cm-3 to reproduce the GeV/TeV spectrum, but a small density to account for the size of the SNR shell. These are achieved by assuming that the explosion occurred inside a wind-blown bubble of the progenitor star, of average density 0.1 cm-3, which is then consistent with their assumed age of 2500 yr. As they remark, the model requires a large fraction of the SN energy to be channeled into cosmic rays, especially since only one side of the SNR contributes to this process. However, they overestimated the integrated TeV flux of HESS by a factor of due to a numerical error, which relieves the efficiency requirement somewhat. We calculate a TeV luminosity of erg s-1 instead of their erg s-1 (note also the different assumed distances).
As we argue below, the Slane et al. (2010) Fermi spectrum used by HESS Collaboration (2014) is not likely to be correct, and there may not even be a detectable source in Fermi at energies GeV. This is why we use different Fermi results in our own model, which contributes to the diverging conclusions of the two papers.
4.3. Leptonic PWN Models
Slane et al. (2010) modeled the -ray emission from HESS and the associated broad-band spectrum with an evolving, one-zone PWN model, where the -rays are ambient photons inverse Compton scattered by the relativistic electrons that also produce the synchrotron emission. Crucial to these models are the age and spin-down power of the pulsar. Slane et al. (2010) assumed a remnant age of 10 kyr and a pulsar with spin-down power of erg s-1. The latter came from the relation of Possenti et al. (2002) and, given the observed scatter, it was fortuitously a very accurate prediction. It was necessary to add a Maxwellian distribution of electrons around 0.1 TeV to a power-law tail to account for the strong Fermi GeV -rays that they found from this source relative to its TeV flux.
The pulsar age assumed by Slane et al. (2010) was likely too large. The true age of a pulsar is given by
where is the braking index, assumed by Slane et al. (2010) to be 3, consistent with a vacuum dipole, is the spin period at birth, and is the currently measured period. For the pulsar’s true age is less than its characteristic age, and refined models will likely favor a younger system and/or a smaller braking index.
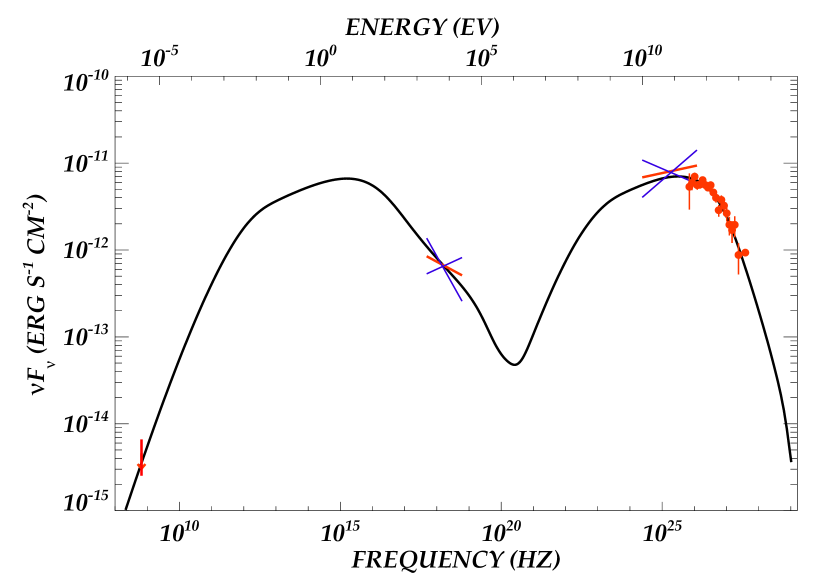
Assuming again that the PWN of PSR J16404631 is primarily responsible for the -ray emission, we fit an evolutionary model of a PWN inside an SNR to the broad-band spectrum. This can constrain the properties of the central neutron star, the pulsar wind, progenitor supernova, and the surrounding ISM. We include the PWN emission in the X-ray band and the radio upper-limit reported in the literature (see Table 4). However, in examining more recent Fermi publications, we note that the source 2FGL J1640.54633 (Nolan et al., 2012) is fainter than the flux (based on yr of data) that was extracted by Slane et al. (2010). More recent analyses of this Fermi source have been restricted to energies GeV (Acero et al., 2013; Ackermann et al., 2013), and we use only the latter in our revised modeling, in particular the spectrum of 1FHL J1640.54634 (Ackermann et al., 2013) derived from yr of data. Indeed, it is not obvious from inspecting Fermi counts maps that there is a significant source at energies GeV, which is why we do not attempt to model this part of the Fermi band. This is an important difference from HESS Collaboration (2014), who accept and model the Fermi results of Slane et al. (2010).
Our model is based on the work of Gelfand et al. (2009), modified to include background photon fields in addition to the cosmic microwave background (CMB), and a broken power-law spectrum of particles injected into the PWN at the termination shock, as favored by recent studies of these objects (e.g., Bucciantini et al. 2011). We assumed two additional background photon fields: one with temperature and energy density , where is the energy density of the CMB, and the other with and , the same as used by Slane et al. (2010). We fixed the distance at 12 kpc. To obtain the best-fit values of the free parameters and their errors, which are listed in Table 5, we employed a Markoff Chain Monte Carlo algorithm similar to the one used to fit the properties of the PWNe in Kes 75 (Gelfand et al., 2013) and G54.1+0.3 (Gelfand et al., in preparation).
For a constant braking index, the spin-down power of the pulsar evolves as
where is the initial spin-down power and is the initial spin-down timescale. The present and are known, which fixes the values of and the present age corresponding to each trial value of and .
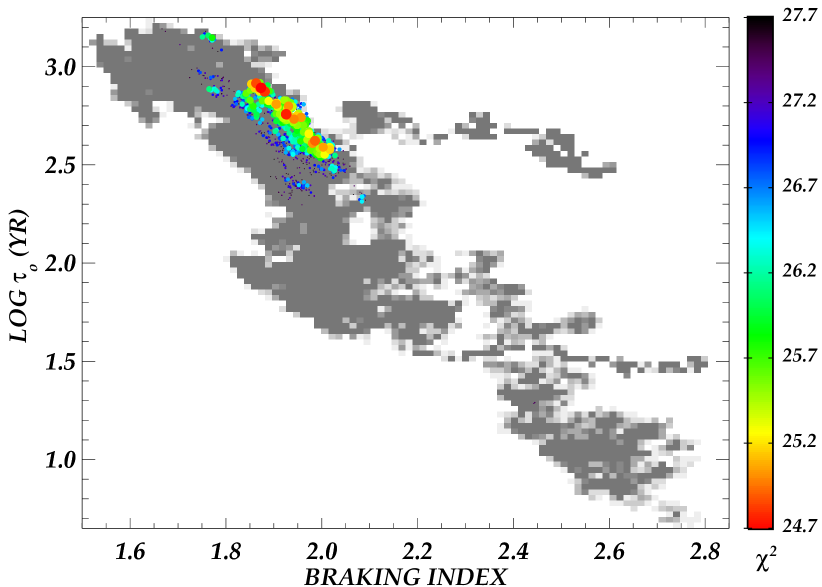
As shown in Figure 4, the model is able to reproduce the observed broad-band spectrum with for 15 degrees of freedom, using the best-fit parameters given in Table 5. In general, the values of these parameters are similar to what has been inferred for other systems using similar models (e.g., Bucciantini et al. 2011). However, our best-fit model requires a small braking index and a short initial spin-down timescale yr. This implies that the pulsar was born spinning rapidly, with ms and a high initial spin-down power erg s-1. Its present age would then be 6800 yr. We note that, in this case, the model is not entirely self-consistent, as the initial rotational energy of the pulsar, erg, is a significant fraction of the fitted SN explosion energy, and could affect the dynamics of the explosion.
| Parameter | Value |
|---|---|
| SN explosion energy, log ( erg) | |
| Ejecta mass, log () | |
| ISM density, log (/cm-3) | |
| Braking index, | |
| Spin-down timescale, log (/yr) | |
| Wind magnetization, log () | |
| Low-energy particle index, | |
| High-energy particle index, | |
| Minimum energy, log (/GeV) | |
| Break energy, log (/TeV) | |
| Maximum energy, log (/PeV) |
5. Discussion
A PWN model for HESS J1640465 is easier to accommodate now because we have deprecated the original Fermi spectrum that was used in all previous model fitting. Even though that spectrum appeared to be continuous with the new HESS points, fitting a single power law, it is now evident that additional Fermi data above 10 GeV are continuous with the HESS data, but with spectral curvature to lower energy that is characteristic of lepton cooling. As to the spatial distribution of TeV photons, while they overlap with part of the SNR shell of G338.30.0, they also overlap with the X-ray PWN, so it is entirely possible that both the PWN and the shell contribute to the -ray emission. Furthermore, it cannot be ruled out that PSR J16404631 emits some pulsed -rays around 1 GeV that we have not yet been able to discover.
The modeled SN explosion is energetic enough for G338.30.0 to have reached its present radius of pc in 6800 yr. The fitted ambient density is cm-3, similar to the value assumed by HESS Collaboration (2014), so this parameter is not a discriminant between the models. The rapid spin-down of PSR J16404631 helps to explain why its PWN can be such a luminous -ray source. The electrons currently emitting inverse Compton scattered TeV photons were injected when the pulsar’s was much higher, while the PWN has expanded, reducing its magnetic field strength and limiting its synchrotron losses. A similar scenario may explain why the young magnetars SGR 180620 (Rowell et al., 2012) and CXOU J171405.7381031 in the SNR CTB 37B (Halpern & Gotthelf, 2010) may power TeV sources even though their present spin-down luminosities are small.
If for PSR J16404631, as it is for all pulsars in which it has been measured, one reason could be that its magnetic dipole field strength or the inclination angle of its axis is increasing in time such that (Livingstone et al., 2007). If , for example, will remain constant and PSR J16404631 will join the group of magnetars when its period is s and G. (However, aside from the idealized case, there is no reason why should be constant over the lifetime of a pulsar.) The smallest measured pulsar braking index that is not affected by glitching is for PSR J17343333 (Espinoza et al., 2011). The 1.17 s period of PSR J17343333, and its inferred dipole magnetic field of G, already close to those of magnetars.
The complex of H II regions and SNRs including G338.30.0 is at the intersection of the far end of the Galactic bar with the Norma spiral arm. Davies et al. (2012) detected a young, massive star cluster in the near-infrared at the center of the H II region G338.4+0.1, and displaced by from HESS J1640465, or a projected separation of 22 pc at the distance they inferred of kpc. The most massive star in the cluster is a WR star with an estimated initial mass of and an age of 3.7 Myr. The optical extinction to the cluster is compatible with the X-ray measured column density to CXOU J164043.5463135. Optical and infrared emission from the H II regions and star cluster could provide significant target photons for inverse Compton scattered TeV emission. Davies et al. (2012) suggested that the progenitor of the putative neutron star could have been born in, and dynamically ejected from the cluster during its formation, in which case its mass must have been at least as large as the most massive star presently in the cluster. But they stopped short of making this claim because they could not prove the birth of the pulsar progenitor in the cluster, as opposed to in a nearby site of independently seeded star formation.
Nevertheless, it is possible to speculate that the large magnetic field strength of PSR J16404631, and the short initial spin period needed to explain its powerful TeV nebula, may both result from a massive progenitor such as a WR star. Duncan & Thompson (1992) proposed that millisecond initial spin periods are needed for a dynamo to generate magnetar strength -fields. There is evidence that the most massive stars () are the progenitors of magnetars (Figer et al., 2005; Gaensler et al., 2005; Muno et al., 2006), although there are exceptions (Davies et al., 2009). If PSR J16404631 is found to have these birth properties, it could be evidence of a physical link between magnetars and other high -field pulsars.
6. Conclusions and Future Work
NuSTAR is a sensitive instrument for the discovery of young pulsars in distant parts of the Galaxy that are obscured by large ISM column densities. The detection of PSR J16404631 in G338.30.0 provides long-awaited evidence that a PWN powers the TeV source HESS J1640465, and its properties test evolutionary models that fit the multiwavelength spectrum. The spin-down power of PSR J16404631, erg s-1, is typical of the range of middle-aged pulsars powering TeV nebulae, but its characteristic age of 3350 yr is younger than the modeled age of the system, which is yr, with a corresponding braking index of . Its observed rapid spin-down and inferred short initial spin period of ms make it possible for PSR J16404631 to power the most luminous known TeV source in the Galaxy. Nevertheless, a more sensitive determination of the -ray spectrum below 10 GeV, and a map of the spatial distribution of the TeV photons, are needed to discriminate among models that locate the emission in the PWN versus the SNR shell. It is possible that two (or more) mechanisms may contribute to the extraordinary -ray luminosity of HESS J1640465.
If radio pulsations are detected and monitored, or with the dedicated program of timing PSR J16404631 with NuSTAR in progress, we can hope to measure its braking index, and thereby better estimate the actual age of G338.30.0 and the initial spin period of the pulsar. This can provide confirmation of the model presented in this work.
References
- Acero et al. (2013) Acero, F., Ackermann, M., Ajello, M., et al. 2013, ApJ, 773, 77
- Ackermann et al. (2013) Ackermann, M., Ajello, M., Allafort, A., et al. 2013, ApJS, 209, 34
- Aharonian et al. (2005) Aharonian, F., Akhperjanian, A. G., Aye, K.-M., et al. 2005, Science, 307, 1938
- Aharonian et al. (2006) Aharonian, F., Akhperjanian, A. G., Bazer-Bachi, A. R., et al. 2006, ApJ, 636, 777
- Arnaud (1996) Arnaud, K. A., 1996, in ASP Conf. Ser. 101, Astronomical Data Analysis Software and Systems V, ed. G. H. Jacoby & J. Barnes (San Francisco, CA: ASP), 17
- Bucciantini et al. (2011) Bucciantini, N., Arons, J., & Amato, E. 2011, MNRAS, 410, 381
- Castelletti et al. (2011) Castelletti, G. Giacani, E., Dubner, G., et al. 2011 A&A, 536, A98
- Davies et al. (2012) Davies, B., de La Fuente, D., Najarro, F., et al. 2012, MNRAS, 419, 1860
- Davies et al. (2009) Davies, B., Figer, D.F., Kudritzki, R.-P., et al. 2009, ApJ, 707, 844
- de Jager & Büsching (2010) de Jager, O. C. & Büsching, I. 2010, A&A, 517, 9
- Duncan & Thompson (1992) Duncan, R. C., & Thompson, C. 1992, ApJ, 392, L9
- Espinoza et al. (2011) Espinoza, C. M., Lyne, A. G., Kramer, M., Manchester, R. N., & Kaspi, V. M. 2011, ApJL, 741, L13
- Fang & Zhang (2010) Fang, J., & Zhang, L. 2010, A&A, 515, A20
- Figer et al. (2005) Figer, D. F., Najarro, F., Geballe, T. R., et al. 2005, ApJ, 622, L49
- Fornasini et al. (2014) Fornasini, F. M., Tomsick, J. A, Bodaghee, A., et al. 2014, ApJ, submitted
- Funk et al. (2007) Funk, S., Hinton, J. A., Pühlhofer, G., et al. 2007, ApJ, 662, 517
- Gaensler et al. (2005) Gaensler, B. M., McClure-Griffiths, N. M., Oey, M. S., et al. 2005, ApJ, 620,
- Garmire et al. (2003) Garmire, G. P., Bautz, M. W., Ford, P. G., Nousek, J. A.. & Ricker, G. R. 2003, Proc. SPIE, 4851, 28
- Gelfand et al. (2013) Gelfand, J., Slane, P., & Temim, T. 2013, in The Fast and the Furious: Energetic Phenomena in Isolated Neutron Stars, Pulsar Wind Nebulae and Supernova Remnants, ed. J.-U. Ness, 24
- Gelfand et al. (2009) Gelfand, J. D., Slane, P. O., & Zhang, W. 2009, ApJ, 703, 2051
- Giacani et al. (2008) Giacani, E., Castelletti, G., Dubner, G., et al. 2008, in AIP Conf. Proc. 1085, High Energy Gamma-Ray Astronomy, ed. F. A. Aharonian, W. Hofmann, & F. Rieger (Melville,NY: AIP), 234
- Gotthelf et al. (1999) Gotthelf, E. V., Vasisht, G., & Dotani, T. 1999, ApJ, 522, L49
- Halpern & Gotthelf (2010) Halpern, J. P., & Gotthelf, E. V. 2010, ApJ, 725, 1384
- Harrison et al. (2013) Harrison, F. A., Craig, W. W., Christensen, F. E., et al. 2013, ApJ, 770, 103
- HESS Collaboration (2014) HESS Collaboration, Abramowski, A., Aharonian, F., et al. 2014, MNRAS, 439, 2828
- Kaspi et al. (2001) Kaspi, V. M., Roberts, M. E., Vasisht, G., et al. 2001 ApJ, 560, 371
- Kothes & Dougherty (2007) Kothes, R., & Dougherty, S. M. 2007, A&A, 468, 993
- Lemiere et al. (2009) Lemiere, A., Slane, P., Gaensler, B. M., & Murray, S. 2009, ApJ, 706, 1269
- Livingstone et al. (2007) Livingstone, M. A., Kaspi, V. M., Gavriil, et al. 2007, Ap&SS, 308, 317
- Manchester et al. (2005) Manchester, R. N., Hobbs, G. B., Teoh, A., & Hobbs, M. 2005, AJ, 129, 1993
- Mori et al. (2014) Mori, K. 2014, et al. submitted.
- Muno et al. (2006) Muno, M. P., Clark, J. S., Crowther, P. A. 2006, ApJ, 636, L41
- Nolan et al. (2012) Nolan, P. L., Abdo, A. A., Ackermann, M., et al. 2012, ApJS, 199, 31
- Possenti et al. (2002) Possenti, A., Cerutti, R., Colpi, M., & Mereghetti, S. 2002, A&A, 387, 993
- Reynolds (2008) Reynolds, S. P. 2008, ARA&A, 46, 89
- Rowell et al. (2012) Rowell, G., De Naurois, M., Djannati-Ataï, A., & Gallant, Y. 2012, in AIP Conf. Proc. 1505, High Energy Gamma-ray Astronomy, ed. F. A. Aharonian, W. Hofmann, & F. M. Rieger (Melville, NY: AIP ), 273
- Shaver & Goss (1970) Shaver, P. A., Goss, W. M. 1970, AuJPA, 14, 133
- Slane et al. (2010) Slane, P, Castro, D., Funk, S., et al. 2010, ApJ, 720, 266
- Spitzer (1978) Spitzer, L. 1978, Physical Processes in the Interstellar Medium, (New York: Wiley)
- Verner et al. (1996) Verner, D. A., Ferland, G. J., Korista, K. T., & Yakovlev, D. G. 1996, ApJ, 465, 487
- Whiteoak & Green (1996) Whiteoak, J. B. Z., & Green, A. J. 1996, A&AS, 118, 329
- Wilms et al. (2000) Wilms, J., Allen, A., & McCray, R. 2000, ApJ, 542, 914