The Quiescent X-ray Spectrum of Accreting Black Holes
Abstract
The quiescent state is the dominant accretion mode for black holes on all mass scales. Our
knowledge of the X-ray spectrum is limited due to the characteristic low luminosity in
this state. Herein, we present an analysis of the sample of dynamically-confirmed
stellar-mass black holes observed in quiescence in the Chandra/XMM-Newton/Suzaku
era resulting in a sample of 8 black holes with 570 ks of observations. In contrast
to the majority of AGN where observations are limited by contamination from diffuse gas,
the stellar-mass systems allow for a clean study of the X-ray spectrum resulting from the
accretion flow alone. The data are characterized using simple models. We find a model
consisting of a power-law or thermal bremsstrahlung to both provide excellent descriptions
of the data, where we measure and respectively in the 0.3 – 10 keV bandpass, at a median
luminosity of . This result in discussed in the
context of our understanding of the accretion flow onto stellar and supermassive black
holes at low luminosities.
keywords:
accretion, accretion discs - black hole physics - stars: binaries (GS 2023+338) X-rays: binaries1 Introduction
| System | Observatory | Exposure time | Net counts | Obsid | Reference |
|---|---|---|---|---|---|
| [ ks ] | [ ct ] | ||||
| GS 2023-338 | Chandra | 10.3 | 1693.6 | #97 | Garcia et al. (2001) |
| – – | Chandra | 55.6 | 1930.1 | #3808 | Kong et al. (2002) |
| – – | XMM-Newton (pn, m1, m2) | 30.2, 34.0, 34.0 | 2032, 766, 816 | #0304000201 | Bradley et al. (2007) |
| – – | Suzaku (x0, x1, x3) | 42.3, 42.3, 42.4 | 1601.9, 1841.6, 1941.0 | #404059010 | this work |
| 1A 0620-00 | Chandra | 42.1 | 120.9 | #95 | Garcia et al. (2001) |
| – – | Chandra | 39.6 | 301.7 | #5479 | Gallo et al. (2006) |
| GRO J1655-40 | Chandra | 42.6 | 49.6 | #99 | Garcia et al. (2001) |
| – – | Chandra | 18.2 | 147.9 | #10907 | Calvelo et al. (2010) |
| – – | XMM-Newton (pn) | 15.6 | 77.4 | #011246201 | Hameury et al. (2003) |
| GS 1354-64 | Chandra | 39.5 | 273.1 | #12741 | Reynolds & Miller (2011) |
| – – | Chandra | 19.8 | 136.1 | #13720 | this work |
| – – | Chandra | 19.8 | 112.6 | #15576 | this work |
| XTE J1118+480 | Chandra | 45.8 | 69.4 | #3422 | McClintock et al. (2003) |
| XTE J1550-564 | Chandra | 18.0 | 40.6 | #3672 | Corbel et al. (2006) |
| – – | Chandra | 47.8 | 133.3 | #5190 | Corbel et al. (2006) |
| – – | XMM-Newton (pn) | 10.8 | 67.1 | #0400890101 | Pszota et al. (2008) |
| GS 1124-683 | XMM-Newton (pn) | 26.9 | 66.4 | #00085960101 | Sutaria et al. (2002) |
| GRS 1009-45 | BeppoSax | 40.6 | 43.0 | #20607001 | Campana et al. (2001) |
The nearby population of active galactic nuclei (AGN) is dominated by systems accreting at low luminosity, i.e., (Soria et al., 2006; Ho, 2009; Gallo et al., 2010; Pellegrini, 2010)111Where and the accretion efficiency assumes the fiducial value of 0.1.. Understanding the nature of the accretion flow in this low luminosity mode is important because the feedback generated by the black holes operating in this kinetic mode may affect the host galaxy. The energy output, when integrated over the time lifetime of the black hole, may significantly affect the local environment (e.g., Croton et al. 2006).
In such phases, accretion onto black holes is broadly expected to proceed via a geometrically–thick accretion flow, but the details remain uncertain. This is partially because observations are complicated by the contaminating components typical in the host galaxy. In principle, a low luminosity can be achieved by transferring very little gas onto the black hole, or by transferring more gas in a manner that is radiatively inefficient. In practice, these mechanisms likely act in concert. A modest inward flow of gas onto the black hole may trap radiation so that the energy is advected across the event horizon. Numerous flavors of advection–dominated accretion flow (ADAF) models have been developed around this idea (e.g., Ichimaru 1977; Narayan & Yi 1994; Narayan & McClintock 2008; Narayan et al. 2000; Igumenshchev & Narayan 2002; Proga & Begelman 2003; Blandford & Begelman 1999). Alternatively, the inflow may channel most of the accretion energy into an outflow, potentially producing relativistic jets (e.g. Markoff et al. 2001a). Models consisting of both an ADAF-like and/or a jet component have been proposed, e.g., Yuan et al. (2009); Eracleous et al. (2010); Nemmen et al. (2014), and are increasingly common.
Even as such models develop and progress, however, some fundamental uncertainties remain. Blandford & Begelman (1999) noted that hot, radiation-trapping accretion flows with low mass flux – ADAFs – may not be gravitationally bound to the black hole. Thus, it is uncertain if gas truly accretes onto the black hole itself, when the rate of mass transfer from large radii is too meager. To this end Chandra has recently invested over 4 Ms in an effort to shed light on the nature of the quiescent accretion flow. Observations of the Galactic center supermassive black hole (SMBH) Sgr A∗ (Nowak et al., 2012; Wang et al., 2013) and the SMBH in NGC 3115 (Wong et al., 2011, 2014) suggest that an ADAF with a significant outflowing component is favored. These observations are supported by recent numerical work (Yuan et al., 2012a, b). See the review by Yuan & Narayan (2014) for a detailed discussion of the current status these so-called hot accretion flows.
Comparisons between, for example, Seyfert AGN and stellar-mass black holes in bright, active states have helped to understand both source classes (e.g., Merloni et al. 2003; Falcke et al. 2004). The same is potentially true in even greater measure for black holes that accrete at very low rates. Observations of Galactic black hole binaries in the “quiescent” state have facilitated the best constraints on black hole accretion at in the 0.5 – 10.0 keV band. The spectrum is consistent with a power law of spectral index , though with large uncertainties (Garcia et al. 2001; Kong et al. 2002; Reynolds & Miller 2011). By itself, this does not necessarily distinguish between different accretion models. There is some evidence that jets may at least be an important addition to ADAF flows, based on the ability of jet models to fit the IR portion of broad-band spectra in terms of synchrotron emission (e.g. Markoff et al. 2001a; Fender et al. 2003; Markoff et al. 2005; Maitra et al. 2009). However, the infrared spectrum of Galactic stellar-mass black holes can be readily measured, whereas galactic starlight obscures the IR spectrum of massive black holes in nearby low-luminosity AGN.
Infrared synchrotron emission in jets does not reveal the details of the regime closest to the black hole, however, nor the mechanisms that may operate there, nor whether the gas is bound. Competing models predict that the apparent X-ray power law below keV is associated with either synchrotron and/or synchrotron self-Comptonization (e.g. in a jet base; Markoff et al. 2001a); or Comptonization in a hot (e.g. keV) corona, possibly in concert with Bremsstrahlung emission (Esin et al., 1997; Narayan & McClintock, 2008). Basic models have been constructed to predict the emission line spectrum of hot, unbound flows (e.g. Narayan & Raymond 1999; Perna et al. 2000; Xu 2011); but reported limits are not very constraining (Bradley et al., 2007).
In short, tremendous gaps remain in our understanding of accretion onto black holes at low rates of mass transfer, and observations of stellar-mass black holes may be the most practical way forward. With the goal of understanding what the best current X-ray data are able to reveal, we have systematically analyzed all available spectra of the dynamically confirmed stellar-mass black holes in quiescence. We report continuum fitting results and limits on emission lines. Leveraging these results, we also lay out the kind of observations that are necessary to make progress using current X-ray observatories.
In this paper, we describe an analysis of all archival observations of quiescent stellar mass black holes observed to date. The analysis presented herein provides the best currently available constraints in the quiescent accretion spectral shape. In §2, we describe the observations and spectral extraction. We proceed to analyze the data in §3. In §4, these results are discussed.
2 Observations
In this study, we consider all observations of dynamically confirmed Galactic stellar mass black holes in the quiescence state (), observed prior to 2013. Such observations have only become readily possible with the advent of modern CCD based detectors (e.g., Chandra/ACIS, XMM-Newton/EPIC-pn). The sample consists of 18 observations of 8 quiescent black holes. In two of these observations, the system of interest was detected by multiple detectors (XMM-Newton/EPIC-pn/mos1/mos2 & Suzaku/xis0/xis1/xis3), resulting in a final sample of 22 spectra. These are the observations considered in Reynolds & Miller (2011) plus the observation of 1H 1707-250 (Yang et al., 2012), two new Chandra observations of GS 1354-64 and new Suzaku observation of GS 2023+338 (aka V404 Cyg) both of which are presented herein for the first time.
In Table 1, we list the relevant properties of each observation, including the final net number of counts detected from each source. The majority of the sample have been previously published, though all data is re-reduced using the latest calibration files in the current analysis. In all cases, our re-analysis is consistent with the previously published results (see appendix A.5 for details). An inspection of Table 1 reveals our sources to be faint, with the exception of GS 2023+338, which as the most luminous source clearly dominates the sample. We begin our analysis by considering this source in some detail. All spectral analysis is carried out within xspec 12.7.0u222http://heasarc.gsfc.nasa.gov/xanadu/xspec/. The latest versions (as of January 2013) of the relevant caldb files were also used. Chi-squared statistics were used at all times with the data being appropriately rebinned, see the appendix for details.
3 Analysis & Results
Previous observations of a number of quiescent black holes by Chandra & XMM-Newton have shown the 0.5 – 10 keV spectrum to be consistent with a power law (, Garcia et al. 2001; Kong et al. 2002; Bradley et al. 2007; Reynolds & Miller 2011). These analysis necessarily focused on single or small samples of observations. Here we analyze all of the spectra accumulated since the launch of Chandra & XMM-Newton.
As the sensitivity of our spectra is modest, we restrict ourselves to simple models. Two baseline models are considered in detail: a simple power law (pha*po) and thermal bremsstrahlung (pha*brem). The absorption by intervening neutral hydrogen is modeled with phabs, where the abundances and cross-sections assumed are bcmc (Balucinska-Church & McCammon, 1992) and angr (Asplund et al., 2009) respectively.
To begin, we analyze the most luminous and hence most frequently observed quiescent stellar mass black hole GS 2023+338.
| Model | Observation | , kT | |||
|---|---|---|---|---|---|
| , [ keV ] | |||||
| pha*po | GS 2023+338_xmm | 1.17 | 2.03 | 0.80 | 873/887 |
| GS 2023+338_cxo#3808 | 1.17 | 2.25 | 0.79 | ||
| GS 2023+338_cxo#97 | 1.17 | 2.07 | 3.42 | ||
| GS 2023+338_suz | 1.17 | 1.95 | 2.25 | ||
| – – | – – | – – | – – | – – | – – |
| GS 2023+338_simultaneous | 1.15 | 2.05 | – | 894/890 | |
| other_simultaneous | – | 2.18 | – | 189/196 | |
| all_simultaneous | – | 2.06 | – | 1084/1087 | |
| pha*brem | GS 2023+338_xmm | 0.92 | 5.38 | 0.60 | 883/887 |
| GS 2023+338_cxo#3808 | 0.92 | 3.69 | 0.52 | ||
| GS 2023+338_cxo#97 | 0.92 | 5.20 | 2.48 | ||
| GS 2023+338_suz | 0.92 | 6.16 | 1.72 | ||
| – – | – – | – – | – – | – – | – – |
| GS 2023+338_simultaneous | 0.91 | 5.10 | – | 905/890 | |
| other_simultaneous | – | 3.40 | – | 194/196 | |
| all_simultaneous | – | 4.98 | – | 1102/1087 |
3.1 GS 2023+338 (aka V404 Cyg)
GS 2023+338, being both a luminous and proximal quiescent stellar mass black hole, has been observed by all 3 of the major X-ray observatories with CCD detectors (GS 1354-64 is in fact more luminous but lies at a much larger distance, , see Reynolds & Miller 2011 for further details). In order to constrain the spectral form, the four observations were modeled both separately and together. The observations by both XMM-Newton & Suzaku provide 3 spectra each (pn/mos1/mos2 and xis0/xis1/xis3), which we choose not to merge. Therefore we have 4 observations providing a total of 8 spectra (see Table 1).
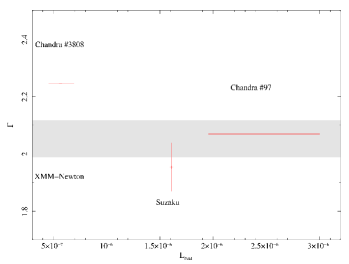
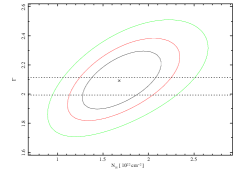
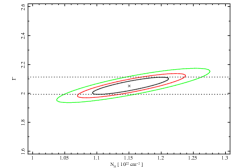
Firstly, the four observations are modeled with a power law, where a common Hydrogen column density is assumed (see Miller et al. 2009), but the power law index and normalization are allowed to vary. The power law index is tied for the sub-components of the XMM-Newton & Suzaku observations. In Fig. 1, we plot the measured power law index versus the luminosity for each observation. With the exception of a single Chandra observation (#3808), the other 3 are all consistent with at the 90% confidence level (plotted), and all four observations agree at the 2 confidence level. Based on this, the data were refit, only now assuming both a common value for the column density and the power law index. We measure a best fit value for the power law index of , indicated by the gray filled region in Fig. 1. Repeating the above analysis with the thermal bremsstrahlung model reveals a best fit temperature of . The relevant parameters for the above spectral fits are listed in Table 2, where we note that both models return statistically equivalent fits.
As line emission is predicted from the ADAF (Narayan & Raymond, 1999; Perna et al., 2000; Xu, 2011), we additionally tested for the presence of an emission lines in the iron K region of the spectrum. To do this, narrow Gaussians () were added to the best fit power-law model above consistent with an origin from Fe K (6.4 keV), Fe XXV (6.7 keV), and Fe XXVI (6.97 keV). We find an upper limit to the equivalent width of emission at the position of these lines of 180 eV, 125 eV, and 160 eV respectively. These results are consistent with the previous XMM-Newton observations of Bradley et al. (2007).
3.2 Other systems
Our sample contains seven additional systems, resulting in 14 spectra in total (see Table 1). The quality of the spectra for each of these systems is significantly less than that for GS 2023+338 above. As such, fits to individual spectra result in a poorly constrained spectral shape, e.g., see Garcia et al. (2001); Kong et al. (2002); Reynolds & Miller (2011). Nonetheless, previous analysis point to a power law index of , as measured for GS 2023+338 above, but with large uncertainties. Here, we assume the quiescent spectral shape to be common to all seven quiescent black holes.
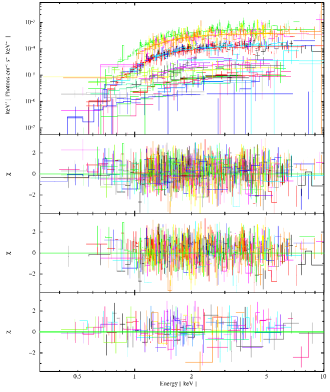
Initially, we fit the spectra with a power law model allowing the column density () and normalization to vary, but assuming a common power law index (). The column densities for XTE J1118+480 and GRS 1009-45 are frozen at their likely value of (McClintock et al., 2003; Campana et al., 2001) as it is not possible to constrain the column density in these systems with the current spectra. For the other systems is allowed to vary and assumed to be constant for those systems with multiple observations (Miller et al., 2009), while the normalization are allowed to vary between observations. In Fig. 2, we plot all 22 spectra fit with a power law model (see §3.3). The bottom panel displays the residuals with respect to a power law fit to the 14 spectra described above. We measure a best fit value for the power-law index of for these 7 quiescent black holes.
As in the case of GS 2023+338, the above analysis is repeated with a thermal bremsstrahlung model (pha*brem), which reveals a best fit temperature of . The relevant parameters for these spectral fits are listed in Table 2, where we again note that both return statistically equivalent fits.
3.3 The entire sample
The results of the previous sections demonstrate that the spectral shape exhibited by the brightest quiescent stellar mass black hole (GS 2023+338) is statistically consistent with that of the fainter systems. Given this fact, we repeat the above analysis, only now we consider all spectra, i.e., 8 spectra for GS 2023+338 and 14 spectra for the other 7 systems.
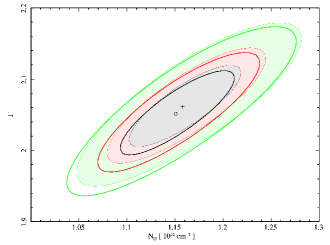
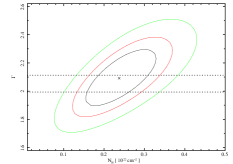
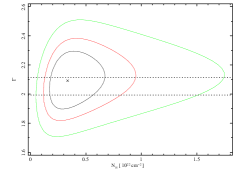
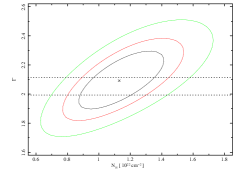
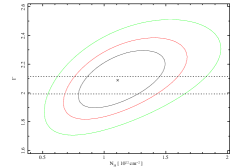
The main panel of Fig. 2 plots the results of a power law fit to all 22 spectra assuming a common , with the second panel displaying the residuals to this fit. The best fit power law index is at the 90% confidence level (bremsstrahlung: ). In Fig. 3, we plot the best fit contour for for GS 2023+338 when it is fit alone (§3.1 – thick unfilled contours) and when all 22 spectra are fit simultaneously (this section – shaded contours). We also show in Fig. 4 the individual best fit contour for for each source. Note the absence of XTE J1118+480 and GRS 1009-45 as the column density was frozen for these sources.
An inspection of Fig. 3 & 4 reveals that the best fit power law index, while dominated by the sensitivity of the GS 2023+338 data is nonetheless consistent among all 8 systems studied herein, i.e., all currently available observations of quiescent stellar mass black holes are consistent with a relatively soft power law () or a low temperature bremsstrahlung component ().
The best fit values for the column density for each system are consistent with that previously measured at optical/IR/X-ray observations. Though in the case of GRO J1655-40 the best fit column we measure is larger than the literature value but remains consistent within the known uncertainties, i.e., see Fig. 3. At the low luminosities characteristic of the quiescent state, we do not expect any additional contribution from local absorbers/winds as may be present at higher luminosities. As such, in order to obtain our final constraint on the shape of the quiescent X-ray spectrum in accreting stellar mass black holes, the column density is fixed at the best values in Fig. 3 and the spectra are re-fit. The resulting best fit power-law index and bremsstrahlung temperature are consistent with those measured above, i.e., and . This demonstrates that the measured spectral shapes are dominated by the intrinsic emission process and not due to the influence of absorption at lower energies. We note that changing the column densities to precisely agree with the literature values does not modify these results.
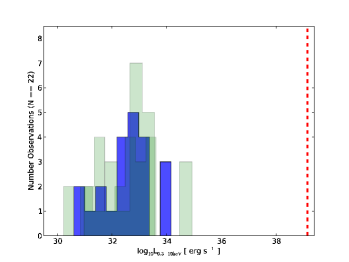
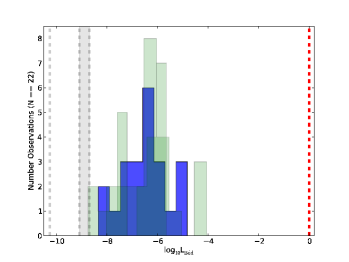
In Fig. 5, we plot the unabsorbed luminosity distribution in the 0.3 – 10 keV band for the 8 black holes in our sample, both as a pure luminosity and an Eddington scaled quantity. Here the Eddington scaled luminosity is the most informative as it facilitates comparison of the observed systems. The distribution of dynamically confirmed stellar mass black holes is observed to have a median luminosity of , though we note this is dominated by the GS 2023+338 observations, i.e., . A clear tail to lower luminosities is also noted, for example, 1A 0620-00 is detected at a luminosity of . For comparison, we indicate the observed luminosity of Sgr A∗ in both the quiescent and flaring state333Where we have corrected the 2.0 – 10.0 keV luminosities from Nowak et al. (2012) by factors of 8.10, 2.18 assuming and 2 for the for the quiescent and flare luminosities respectively., where the thick gray band denotes the mean to peak flare luminosity range (Nowak et al., 2012; Degenaar et al., 2013). The flaring luminosity of Sgr A∗ approaches that observed from the stellar mass sample and the observed spectral index of this flaring emission () is in agreement with the constraints on the quiescent spectral shape presented herein. The Sgr A∗ quiescent spectral shape differs significantly from this with a best fit spectral index of (Nowak et al., 2012).
4 Discussion
The overwhelming majority of black holes in the Universe accrete at a low Eddington-scaled luminosity, yet our knowledge of the nature of the accretion flow in this state is severely lacking. Herein, we have presented an analysis of all of the existing data on dynamically confirmed stellar mass black holes in an effort to place the current state of our observational knowledge in focus. Modeling the observed spectra assuming simple power law or thermal bremsstrahlung models reveals the spectral shape exhibited by the accretion flow at a median luminosity to be consistent with:
in the 0.3 – 10 keV bandpass, where the errors are at the 90% confidence level. These systems provide the cleanest possible astrophysical laboratory for the study of this low luminosity accretion flow.
The results presented herein are consistent with previous analysis of quiescent stellar mass BHs, e.g., Garcia et al. (2001); Kong et al. (2002); Bradley et al. (2007); Reynolds & Miller (2011); Plotkin et al. (2013). The quiescent X-ray spectrum is distinct to that observed at higher luminosities, for example, in the so called ‘low-hard’ state a harder spectral index is observed, i.e., (McClintock & Remillard, 2006; Reynolds & Miller, 2013). The spectral index we measure for the stellar mass BH sample, agrees with a scenario whereby the accretion flow changes (i.e., softens) at some luminosity below that typically observed in the low-hard state (). Detailed study of the decay from outburst of a number of stellar mass BHs suggest that this softening occurs at luminosities (Corbel et al., 2006; Plotkin et al., 2013). Unfortunately, such soft spectra alone cannot uniquely determine the nature of the underlying accretion flow as both ADAF, jet, and hybrid models are capable of producing the observed power law index () in the X-ray bandpass, e.g., Esin et al. (1997); Markoff et al. (2001b); Yuan & Cui (2005a).
Given the apparent scale invariant nature of the accretion flow onto black holes as evidenced by, for example, the fundamental plane (Merloni et al., 2003; Falcke et al., 2004), it is worth considering the similarity of the observed quiescent spectral shape of the stellar mass black hole sample presented herein to that observed from quiescent AGN in more detail.
4.1 Quiescent SMBHs
The stellar mass sample studied herein lie at a median luminosity of . The observed spectral index () is consistent with that observed in large samples of nearby AGN at similar Eddington ratios, e.g., Gallo et al. (2010); Gültekin et al. (2012). Knowledge of the quiescent spectral shape is important as conclusively identifying low-luminosity AGN emission is difficult, e.g., Miller et al. (2012) find a lower limit of 45% for the occupation fraction in a sample of Virgo cluster galaxies. The difficulty of identifying the AGN component will only increase, as in future surveys normal galaxies will be the dominant population, in contrast to current deep Chandra fields which are dominated by AGN, e.g., Lehmer et al. (2012).
Further constraints on the nature of the quiescent accretion flow have been provided by observations of nearby SMBH, most notably Sgr A∗ (Nowak et al., 2012; Neilsen et al., 2013; Wang et al., 2013) and NGC 3115∗ (Wong et al., 2011, 2014). Sgr A∗ has recently been studied in great detail with Chandra where it has been found that the quiescent X-ray emission from Sgr A∗ is consistent with a power law of spectral index (Nowak et al., 2012), whereas the flare spectrum is consistent with a harder power-law spectral index (Nowak et al., 2012; Neilsen et al., 2013), consistent with the spectrum observed from the Galactic stellar mass sample. The Chandra campaign detected 39 discrete flaring events from Sgr A∗ and although they exhibited a variation in peak luminosity by over a factor of 10, no evidence for statistically significant evolution in the spectral shape of the flare emission was found (Nowak et al., 2012; Neilsen et al., 2013). Similar results on the shape of the flare spectrum have been suggested by previous observations from multiple X-ray observatories, e.g., XMM-Newton (Porquet et al., 2003, 2008) and Swift (Degenaar et al., 2013).
Based on archival CCD resolution Chandra observations Sazonov et al. (2012) claim the quiescent emission from Sgr A∗ to be contaminated by line of sight emission from coronally active stars/gas implying that the true quiescent X-ray spectrum from Sgr A∗ was unobserved. However, a recent analysis of the high resolution X-ray spectrum provided by the gratings onboard Chandra has failed to detect the predicted Fe K emission line expected if emission from coronally active stars dominated the measured X-ray spectrum, suggesting that such emission, if present, contributes no more than 25% of the observed spectrum (Wang et al., 2013). Detailed modeling of the latest Chandra grating spectrum favors an ADAF-type solution for the observed quiescent emission. Of particular note, the favored solution is inconsistent with a classic ADAF where the low luminosity is due to the advection of energy in the accretion flow (e.g., Narayan & Yi 1994) and instead favors a scenario where a large amount of the accreted material is ejected in an outflow (e.g., Blandford & Begelman 1999), hence limiting the luminosity to be . The shape of the Chandra spectrum is dominated by bremsstrahlung emission from the inner accretion flow (), but this component only contributes of the observed X-ray luminosity within the Bondi radius (Wang et al. 2013; see also Yuan & Narayan 2014).
A similar deep Chandra study of the SMBH in the galaxy NGC 3115 has been carried out where, due to the massive black hole, the Bondi radius is resolvable at X-ray energies (Wong et al., 2011, 2014). The density profile of the gas inside the Bondi radius has been measured, where as in the case of Sgr A∗ an ADAF with an outflow solution is favored. In both cases, the observed shape of the accretion flows are consistent with that produced in updated numerical models of low-luminosity accretion flows, which find outflows to be a ubiquitous property (Yuan et al., 2012a, b).
Sgr A∗ is by some distance the best studied quiescent supermassive black hole, and we compare the observed quiescent accretion flow properties of this SMBH to the stellar mass sample in more detail below.
4.2 Quiescent stellar mass BHs and Sgr A∗ flares
The flaring activity observed from Sgr A∗ is less luminous than the observed distribution of stellar mass systems (see Fig. 5). Nonetheless, the observed spectral shapes are consistent with each other (), suggestive of a common X-ray emission mechanism.
GS 2023+338 is the best studied quiescent stellar mass black hole at X-ray wavelengths and it is studies of this system that have provided the best constraints on the nature of the quiescent accretion flow. Early studies envisaged a pure ADAF model, e.g, Narayan et al. (1997); however, the presence of a radio jet in this system and numerous quiescent SMBHs suggested a more complicated picture. Coupled with observations of Sgr A∗, which constrained the accretion rate to be lower than that expected for a classical ADAF model (Bower et al., 2003), this lead to the development of hybrid ADAF/jet models, e.g., (Yuan et al., 2003; Yuan & Cui, 2005a; Yuan et al., 2005b).
The most recent constraints on the broadband spectral energy distribution of this stellar mass black hole have been provided by Hynes et al. (2009), where it was found that the radio and X-ray emission are uncorrelated whereas the optical and X-ray emission exhibit a correlation suggesting irradiation of the accretion disk by the inner ADAF-like flow (see also Hynes et al. 2002, 2004). The lack of a correlation between the radio and X-ray emission argues against the X-ray emission originating in the jet, as does the measured low UV flux, which is inconsistent with expectations from an extrapolation of the jet component into this bandpass (Hynes et al., 2009). Additionally, as has been observed for X-ray flares from Sgr A∗, the spectral shape of the accretion flow in GS 2023+338 displays no evidence for a significant deviation from a power-law despite the detection of significant variability (Bernardini & Cackett, 2014). These points lead to Hynes et al. (2009) favoring a hybrid jet plus ADAF scenario for this system.
A similar physical picture emerges from multi-wavelength observations of Sgr A∗ where flares in the near infrared (nIR 1 – 5 m) and X-ray occur approximately simultaneously, whereas as the radio flares are typically delayed suggesting a more tenuous relationship with the process producing the X-ray/nIR emission, e.g., Yusef-Zadeh et al. (2008); Dodds-Eden et al. (2009). A model in which the X-ray and nIR flares are produced via magnetic re-connection processes in the inner ADAF has been shown to self consistently re-produce the observed correlated nIR/X-ray flares (Dodds-Eden et al., 2010). An alternative model where the X-ray emission is due to the scattering of nIR photons to X-ray energies by hot electrons in the accretion flow has also been advocated, e.g., Yusef-Zadeh et al. (2012).
4.3 Stellar mass BHs and Sgr A∗ in quiescence
The quiescent X-ray spectrum measured from Sgr A∗ is distinct from that measured during the flaring events, and that observed from the stellar mass sample presented herein. X-ray variability in quiescence attests to continued accretion onto the black hole in the stellar mass case. For example, the quiescent X-ray emission from GS 2023+338 has been observed to be variable on all timescales probed ranging from seconds to years (e.g., see Hynes et al. 2009; Bernardini & Cackett 2014, and Table 2 herein). Variability on similar timescales is also observed from additional systems where feasible, e.g., Kong et al. (2002); Reynolds & Miller (2011). In contrast the quiescent X-ray emission from Sgr A∗ is remarkably constant, with no appreciable variation in the non-flare emission detected (Wang et al., 2013). In a detailed analysis of the flare properties observed in the Chandra XVP program, Neilsen et al. (2013) find that the flaring emission component is unlikely to contribute more than 10% of the quiescent emission. This is suggestive of further evolution of the quiescent spectrum at the lowest luminosities/mass accretion rates.
In the quiescent state the luminosity is highly sub-Eddington, primarily due to a reduced accretion rate (); however, the feeding mechanism is different in the SMBH and the stellar mass BH case. The stellar systems accrete from an accretion disk that is replenished by material from the mass donor secondary star. In quiescence, the accretion disk is truncated at some distance from the black hole, likely of order (Esin et al., 1997), with the region interior to this transitioning to an ADAF of some form. Optical studies of the quiescent outer accretion disk reveal an accretion rate onto the outer disk of (Marsh et al., 1994; McClintock et al., 1995), whereas the Eddington accretion rate is 3 orders of magnitude higher (assuming a BH). Additionally, observations at UV energies have revealed the presence a significant source of UV flux likely originating from the mass transfer stream disk impact point, e.g., McClintock et al. (2003); Froning et al. (2011).
In contrast, low luminosity SMBH such as Sgr A∗ accrete diffuse gas from the inner regions of their host galaxy typically by the Bondi-Hoyle mechanism at large radii () transitioning to an ADAF interior to this. For Sgr A∗ the accretion rate is less than that suggested by the standard Bondi mechanism (), and has been constrained via Faraday rotation measurements to be (Bower et al., 2003), many orders of magnitude less than the Eddington accretion rate of . The mass reservoir immediately available to the stellar mass systems is larger than that available to the SMBH in addition to being provided via an accretion disk vs the quasi-spherical feeding suffered by the SMBHs. This larger mass accretion rate is likely the dominant source of the enhanced variability observed from the stellar mass systems.
The shape of the X-ray spectrum from an ADAF depends on the detailed physics of the accretion flow, but is expected to be dominated by emission from bremsstrahlung and compton components (Narayan & Yi, 1994; Yuan & Narayan, 2014). The bremsstrahlung emission originates from the entire radial extent of the ADAF, but the overall X-ray spectrum is typically dominated by the compton component. The energy at which the comptonized component dominates is dependent upon the input energy of the seed photons provided by the lower energy synchrotron emission, which due to the mass dependent nature of the synchrotron peak frequency peaks at optical/radio frequencies for the stellar mass/SMBHs respectively (e.g., ; Quataert & Narayan 1999). As a result, the comptonized emission in the SMBH case will have a characteristic temperature lower than that for the stellar mass systems, potentially producing a systematic difference in the observed spectra. This can allow the bremsstrahlung component to significantly contribute to the observed shape of the X-ray spectrum from quiescent SMBHs, whereas the stellar mass black hole spectrum will remain dominated by the compton component.
This will change in the presence of an outflow (i.e., Blandford & Begelman 1999), which results in a reduced soft seed flux for the comptonization process. Due to the reduction/removal of the electrons producing the highest frequency synchrotron emission that originate from the innermost radii of the accretion flow (), the comptonization component will be suppressed resulting in a bremsstrahlung dominated X-ray spectrum. In this case, the shape of the bremsstrahlung component can provide direct constraints on the radial mass outflow rate as has been demonstrated in the case of Sgr A∗ (Wang et al., 2013).
Finally, it is worth noting that considerable uncertainty on the composition of the broadband spectral energy distribution at low luminosities remains. For example, the nature of the relationship between the ADAF and the radio jet which is observed in some quiescent systems is uncertain, e.g., both GS 2023+338 and M87∗ produce collimated radio outflows (). The emission from the jet component can in cases contribute to the X-ray bandpass (Yuan et al., 2009; Eracleous et al., 2010; Nemmen et al., 2014), although a significant jet contribution in the case of GS 2023+338 is ruled out (Hynes et al., 2009). Evidence for outflowing material has been detected in the inner accretion flow at radio frequencies from Sgr A∗(Doeleman et al., 2008); however, its relationship to a radio jet such as those observed at higher luminosities is uncertain.
4.4 Future prospects
The discovery of a relationship between the mass, X-ray/Radio luminosity of accreting black holes across the mass scale (Merloni et al., 2003; Falcke et al., 2004), suggests that the process of accretion onto a black hole is intrinsically scale invariant. Hence, future studies of quiescent accretion flows onto both stellar and supermassive black holes will play a key role in our understanding of the low luminosity accretion flow. A number of avenues suggest that further progress is imminent, for example, the ‘G2’ object approaching Sgr A∗ has the potential to provide a once in a lifetime insight into the accretion flow onto Sgr A∗ (Gillessen et al., 2012). Should significant material accrete onto the black hole, we may hope to measure directly the response of the accretion flow to a known increase in mass accretion rate. Further observations may hope to reveal the relationship between the outflow predicted at low luminosities, the numerous radio flares, and evidence for previous activity from Sgr A∗ in the Galactic center (e.g., Wang et al. 2013; Clavel et al. 2013).
Of the stellar mass systems both GS 2023+338 and 1A 0620-00 (Gallo et al., 2005, 2006) have been detected at both radio and X-ray wavelengths in quiescence. However, in neither case is it possible to resolve the observed emission. The situation is much improved in the case of a supermassive black hole where imaging of event horizon scale emission will become a reality in the next decade444http://www.eventhorizontelescope.org. Current radio observations have probed the innermost regions of the accretion flow around a number of SMBHs, where detailed study of Sgr A∗ and M87∗ (, Di Matteo et al. 2003) have revealed evidence for outflowing material in the inner regions surrounding the SMBH (Doeleman et al., 2008, 2012). The currently favored ADAF models predict outflows at such low luminosity (e.g., Yuan et al. 2012a, b) and such observations promise to directly constrain this emission.
Given the abundant complicating issues when attempting to constrain the low luminosity accretion flow onto a SMBH, the advantage of utilizing the stellar mass BH sample is clear. Unfortunately, significant expansion of the known stellar mass sample will be difficult, given the difficulty of dynamically constraining the mass of the black hole for sources lying in highly crowded Galactic center fields. A new avenue would be provided by the discovery of an isolated stellar mass black hole; however, to date no such system is known. The eRosita mission will survey the galactic plane region down to luminosities of and the final survey may contain a small number of isolated black holes, but positive identification will be difficult (Merloni et al., 2012), while detection of larger numbers of isolated stellar mass BHs will likely await the completion of SKA (Fender et al., 2013).
The results presented herein represent the accumulation of over 10 years ( 570 ks)
of observations with the Chandra & XMM-Newton X-ray observatories. It
is clear that to significantly advance our understanding on this issue, new large scale
observing programs will be required. When considering the stellar mass black hole sample
two immediate avenues present themselves:
(i) Our current constraints are unable to
determine if the X-ray spectral shape exhibits curvature or is consistent with a power law
alone. Constraining the X-ray spectral shape at energies in excess of 10 keV would clearly
be of benefit here, and with the successful launch of NuSTAR such constraints may
be forthcoming in the near future.
(ii) Numerous ADAF models predict the presence of
narrow emission lines (EW 30 eV) from highly ionized iron, e.g.,
Narayan & Raymond (1999); Perna et al. (2000); Xu (2011). Imprinted in these lines will lie information on the
geometry and ionization structure of the accretion flow, e.g., Wang et al. (2013) recently
used the detection of highly ionized Fe XXV from Sgr A∗, which they successfully
reproduced with an ADAF model. Crucially, this data required an ADAF that
generated a significant outflow (e.g., Blandford & Begelman 1999; Yuan et al. 2012a, b; Wang et al. 2013). The
detection of outflows at such low luminosities facilitates constraints on black hole
feedback across the entire luminosity and mass range exhibited by accreting black holes.
The current best limits on line emission from the quiescent accretion flow in a stellar
mass system are provided by the XMM-Newton observation of Bradley et al. (2007);
however, at typical equivalent widths 30 eV, the predicted linewidths are not
probed. A 500 ks observation with XMM-Newton is the only way to make progress in
this area for several years to come.
Acknowledgments
This research has made use of data obtained from
the High Energy Astrophysics Science Archive Research Center (HEASARC), provided by
NASA’s Goddard Space Flight Center. This research has made use of data obtained from the
Suzaku satellite, a collaborative mission between the space agencies of Japan
(JAXA) and the USA (NASA). This research made extensive use of the SIMBAD
database, operated at CDS, Strasbourg, France and NASA’s Astrophysics Data System.
We thank the anonymous referee for a constructive report which improved this paper.
References
- Asplund et al. (2009) Asplund M. et al., 2009, ARA&A, 47, 481
- Balucinska-Church & McCammon (1992) Balucinska-Church M., McCammon D., 1992, ApJ, 400, 699
- Bernardini & Cackett (2014) Bernardini, F., & Cackett, E. 2014, MNRAS, 439, 2771
- Blandford & Begelman (1999) Blandford R., Begelman M., 1999, MNRAS, 303, 1
- Bradley et al. (2007) Bradley C.K., Hynes R.I., Kong A.K.H., Haswell C.A., Casares J., Gallo E., 2007, ApJ, 667, 427
- Bower et al. (2003) Bower, G. C., Wright, M. C. H., Falcke, H., & Backer, D. C. 2003, ApJ, 588, 331
- Calvelo et al. (2010) Calvelo, D. E., Fender, R. P., Russell, D. M., et al., 2010, MNRAS, 409, 839
- Campana et al. (2001) Campana, S., Parmar, A. N., & Stella, L., 2001, A&A, 372, 241
- Chatterjee et al. (2009) Chatterjee, R., Marscher, A. P., Jorstad, S. G., et al., 2009, ApJ, 704, 1689
- Clavel et al. (2013) Clavel, M., Terrier, R., Goldwurm, A., et al. 2013, A&A, 558, A32
- Corbel et al. (2006) Corbel S., Tomsick J.A., Kaaret P., 2006, ApJ, 636, 971
- Croton et al. (2006) Croton D.J. et al., 2006, MNRAS, 365, 11
- Degenaar et al. (2013) Degenaar, N., Miller, J. M., Kennea, J., et al. 2013, ApJ, 769, 155
- Di Matteo et al. (2003) Di Matteo, T., Allen, S. W., Fabian, A. C., Wilson, A. S., Young, A. J., 2003, ApJ, 582, 133
- Dodds-Eden et al. (2009) Dodds-Eden, K., Porquet, D., Trap, G., et al. 2009, ApJ, 698, 676
- Dodds-Eden et al. (2010) Dodds-Eden, K., Sharma, P., Quataert, E., et al. 2010, ApJ, 725, 450
- Doeleman et al. (2008) Doeleman, S. S., Weintroub, J., Rogers, A. E. E., et al., 2008, Natur, 455, 78
- Doeleman et al. (2012) Doeleman, S. S., Fish, V. L., Schenck, D. E., et al., 2012, Science, 338, 355
- Eracleous et al. (2010) Eracleous, M., Hwang, J. A., Flohic, H. M. L. G., 2010, ApJS, 187, 135
- Esin et al. (1997) Esin, A. A., McClintock, J. E., Narayan, R., 1997, ApJ, 489, 865
- Falcke et al. (2004) Falcke H., Kording E., Markoff S., 2004, A&A, 414, 895
- Fender et al. (2003) Fender, R. P., Gallo, E., Jonker, P. G., 2003, MNRAS, 343, L99
- Fender et al. (2013) Fender R., Maccarone T., Heywood, I., 2013, 430, 1538
- Froning et al. (2011) Froning, C. S., Cantrell, A. G., Maccarone, T. J., et al. 2011, ApJ, 743, 26
- Gallo et al. (2005) Gallo, E., Fender, R. P., & Hynes, R. I. 2005, MNRAS, 356, 1017
- Gallo et al. (2006) Gallo E., Fender R.P., Miller-Jones J.C.A., Merloni A., Jonker P.G., Heinz S., Maccarone T., Van der Klis M., 2006, MNRAS, 370, 1351
- Gallo et al. (2008) Gallo, E., Homan, J., Jonker, P. G., Tomsick, J. A., 2008, ApJL, 683, L51
- Gallo et al. (2010) Gallo, E., Treu, T., Marshall, P. J., et al., 2010, ApJ, 714, 25
- Garcia et al. (2001) Garcia M.R., McClintock J.E., Narayan R., Callanan P., Barret D., Murray S., 2001, ApJ, 553, 47
- Gillessen et al. (2012) Gillessen, S., Genzel, R., Fritz, T. K., et al., 2012, Natur, 481, 51
- Gültekin et al. (2012) Gültekin, K., Cackett, E. M., Miller, J. M., et al., 2012, ApJ, 749, 129
- Hameury et al. (2003) Hameury J.M., Barret D., Lasota J.P., McClintock J.E., Menou K., Motch C., Olive J.F., Webb N., 2003, A&A, 399, 631
- Ho (2009) Ho, L. C., 2009, ApJ, 699, 626
- Hynes et al. (2002) Hynes, R. I., Zurita, C., Haswell, C. A., et al. 2002, MNRAS, 330, 1009
- Hynes et al. (2004) Hynes, R. I., Charles, P. A., Garcia, M. R., et al. 2004, ApJL, 611, L125
- Hynes et al. (2009) Hynes R.I., Bradley C.K., Rupen M., Gallo E., Fender R.P., Casares J., Zurita C., 2009, MNRAS, 399, 2239
- Ichimaru (1977) Ichimaru, S., 1977, ApJ, 214, 840
- Igumenshchev & Narayan (2002) Igumenshchev, I. V., & Narayan, R., 2002, ApJ, 566, 137
- Khargharia et al. (2010) Khargharia, J., Froning, C. S., Robinson, E. L., 2010, ApJ, 716, 1105
- Kong et al. (2002) Kong A.K.H., McClintock J.E., Garcia M.R., Murray S.S., Barret D., 2002, ApJ, 570, 277
- Lehmer et al. (2012) Lehmer, B. D., Xue, Y. Q., Brandt, W. N., et al., 2012, ApJ, 752, 46
- Maitra et al. (2009) Maitra, D., Markoff, S., Brocksopp, C., et al., 2009, MNRAS, 398, 1638
- Markoff et al. (2001a) Markoff, S., Falcke, H., Fender, R., 2001a, A&A, 372, L25
- Markoff et al. (2001b) Markoff, S., Falcke, H., Yuan, F., Biermann, P. L., 2001b, A&A, 379, L13
- Markoff et al. (2005) Markoff S., Nowak M., Wilms J., 2005, ApJ, 635, 1203
- Marsh et al. (1994) Marsh, T. R., Robinson, E. L., & Wood, J. H. 1994, MNRAS, 266, 137
- McClintock et al. (1995) McClintock, J. E., Horne, K., & Remillard, R. A. 1995, ApJ, 442, 358
- McClintock et al. (2003) McClintock J.E., Narayan R., Garcia M.R., Orosz J.A., Remillard R.A., Murray S.S., 2003, ApJ, 593, 435
- McClintock et al. (2004) McClintock J.E., Narayan R., Rybicki G.B., 2004, ApJ, 615, 402
- McClintock & Remillard (2006) McClintock J.E., Remillard R.A., 2006, in Lewin W.H.G., van der Klis M., eds, Compact Stellar X-Ray Sources, Cambridge University Press, Cambridge, in press (astro-ph/0306213)
- Merloni et al. (2003) Merloni A., Heinz S., di Matteo T., 2003, MNRAS, 345, 1057
- Merloni et al. (2012) Merloni, A., Predehl, P., Becker, W., et al., 2012, arXiv:1209.3114
- Miller-Jones et al. (2009) Miller-Jones J.C.A., Jonker P.G., Dhawan V., Brisken W., Rupen M.P., Nelemans G., Gallo E., 2009, ApJ, 706, 230
- Miller et al. (2009) Miller, J. M., Cackett, E. M., & Reis, R. C., 2009, ApJL, 707, L77
- Miller et al. (2012) Miller, B., Gallo, E., Treu, T., Woo, J.-H., 2012, ApJ, 747, 57
- Narayan & Yi (1994) Narayan, R., & Yi, I., 1994, ApJL, 428, L13
- Narayan et al. (1996) Narayan R., McClintock J.E., Yi I., 1996, ApJ, 457, 821
- Narayan et al. (1997) Narayan, R., Barret, D., & McClintock, J. E. 1997, ApJ, 482, 448
- Narayan & Raymond (1999) Narayan R., Raymond, J., 1999, ApJL, 515, L69
- Narayan et al. (2000) Narayan, R., Igumenshchev, I. V., Abramowicz, M. A., 2000, ApJ, 539, 798
- Narayan & McClintock (2008) Narayan R., McClintock J.E., 2008, NewAR, 51, 733
- Neilsen et al. (2013) Neilsen, J., Nowak, M. A., Gammie, C., et al. 2013, ApJ, 774, 42
- Nemmen et al. (2014) Nemmen, R. S., Storchi-Bergmann, T., & Eracleous, M. 2014, MNRAS, 438, 2804
- Nowak et al. (2012) Nowak M.A., Neilsen J., Markoff, S.B., et al., 2012, ApJ, 759, 95
- Pellegrini (2005) Pellegrini, S., 2005, ApJ, 624, 155
- Pellegrini (2010) Pellegrini, S., 2010, ApJ, 717, 640
- Perna et al. (2000) Perna R., Raymond J., Narayan, R., 2000, ApJ, 541, 898
- Plotkin et al. (2013) Plotkin, R. M., Gallo, E., Jonker, P. G., 2013, ApJ, 773, 59
- Porquet et al. (2003) Porquet, D., Predehl, P., Aschenbach, B., et al. 2003, A&A, 407, L17
- Porquet et al. (2008) Porquet, D., Grosso, N., Predehl, P., et al. 2008, A&A, 488, 549
- Proga & Begelman (2003) Proga, D., Begelman, M. C., 2003, ApJ, 592, 767
- Pszota et al. (2008) Pszota, G., Zhang, H., Yuan, F., Cui, W., 2008, MNRAS, 389, 423
- Quataert & Narayan (1999) Quataert, E., & Narayan, R. 1999, ApJ, 520, 298
- Reynolds & Miller (2011) Reynolds, M. T., Miller, J. M., 2011, ApJL, 734, L17
- Reynolds & Miller (2013) Reynolds, M. T., Miller, J. M., 2013, ApJ, 769, 16
- Sazonov et al. (2012) Sazonov S., Sunyaev R., Revnivtsev M., 2012, MNRAS, 420, 388
- Soria et al. (2006) Soria, R., Graham, A. W., Fabbiano, G., et al., 2006, ApJ, 640, 143
- Sutaria et al. (2002) Sutaria F.K., Kolb U., Charles P. et al., 2002, A&A, 391, 993
- Tomsick et al. (2003) Tomsick J.A., Corbel S., Fender, R. et al., 2003, ApJ, 597, 133
- Wang et al. (2013) Wang, Q. D., Nowak, M. A., Markoff, S. B., et al., 2013, Science, 341, 981
- Wong et al. (2011) Wong, K.-W., Irwin, J. A., Yukita, M., et al., 2011, ApJL, 736, L23
- Wong et al. (2014) Wong, K.-W., Irwin, J. A., Shcherbakov, R. V., et al., 2014, ApJ, 780, 9
- Xu (2011) Xu Y.D., 2011, ApJ, 729, 10
- Yang et al. (2012) Yang, Y.J., Kong A.K.H., Russell D.M., Lewis F., Wijnands R., 2012, MNRAS, 427, 2876
- Yu et al. (2011) Yu, Z., Yuan, F., Ho, L. C., 2011, ApJ, 726, 87
- Yuan et al. (2003) Yuan, F., Quataert, E., & Narayan, R. 2003, ApJ, 598, 301
- Yuan & Cui (2005a) Yuan, F., Cui, W., 2005a, ApJ, 629, 408
- Yuan et al. (2005b) Yuan, F., Cui, W., & Narayan, R. 2005b, ApJ, 620, 905
- Yuan et al. (2009) Yuan, F., Yu, Z., & Ho, L. C., 2009, ApJ, 703, 1034
- Yuan et al. (2012a) Yuan, F., Wu, M., & Bu, D. 2012a, ApJ, 761, 129
- Yuan et al. (2012b) Yuan, F., Bu, D., & Wu, M. 2012b, ApJ, 761, 130
- Yuan & Narayan (2014) Yuan, F., & Narayan, R. 2014, arXiv:1401.0586
- Yungelson et al. (2006) Yungelson, L. R., Lasota, J.-P., Nelemans, G., et al., 2006, A&A, 454, 559
- Yusef-Zadeh et al. (2008) Yusef-Zadeh, F., Wardle, M., Heinke, C., et al. 2008, ApJ, 682, 361
- Yusef-Zadeh et al. (2012) Yusef-Zadeh, F., Wardle, M., Dodds-Eden, K., et al. 2012, AJ, 144, 1
- Zhang et al. (2009) Zhang, W. M., Soria, R., Zhang, S. N., Swartz, D. A., Liu, J. F. 2009, ApJ, 699, 281
.5 A.1) Data Reduction
All Data reduction takes place within the
ciao4.2555http://cxc.harvard.edu/ciao/,
sas11.0.0666http://xmm.esa.int/sas/, and heasoft
6.12777http://heasarc.gsfc.nasa.gov/lheasoft/ environments. We provide
further information on the specific steps undertaken to extract spectra for each
observatory used in our analysis below.
Chandra:
All Chandra observations were reprocessed with
chandra_repro. Spectra were then extracted from the resulting event lists
with specextract assuming a 2.5″radius extraction region and an
appropriate background region from a neighboring source free region of the
detector. All spectra were binned to have a S/N = 3 per bin and we restricted
ourselves to data in the 0.3 – 7.0 keV energy range.
XMM-Newton:
Event files for all 4 sources observed by XMM-Newton were created using
evselect, where we have excluded count rates greater than 0.4, 0.35 ct
s-1 for the EPIC-pn and MOS detectors respectively, to account for flaring.
The resulting lightcurves were inspected to confirm the absence of remaining flares
before spectra were extracted. We extracted all events with a pattern 4 and 12
for the EPIC-pn and MOS assuming extraction regions of radius 20″and 30″respectively. The resulting spectra were grouped such that there were 20 counts per
bin and all good data in the 0.3 – 10.0 keV energy range are considered.
Suzaku:
Our sample contains a single Suzaku
observation. GS 2023+338 was observed for 42 ks on 2009-11-09 (PI: Reynolds). Event
files were created in the standard manner using the relevant Suzaku
ftools. Spectra were extracted assuming a 4′radius extraction region
and the background was estimated from a neighboring source free region of the
detector. The resulting spectra were grouped such that there were 20 counts per
bin. Due to the high background in the XIS1 detector only data in the 0.5 – 5.0 keV
range was considered, whereas data in the energy range 0.5 – 10.0 keV were considered
for the XIS0, XIS3 detectors.
BeppoSax:
Our sample contains one source observed with
BeppoSax (GRS 1009-45). We followed the standard procedures described in the
BeppoSax data analysis
cookbook888http://www.asdc.asi.it/bepposax/software/cookbook/ in obtaining
the spectra from the raw event files. To summarize, we used xselect to extract
both LECS and MECS source spectra with 8′ radius and the latest backgrounds with
a similar radius were obtained from black field
images999ftp://ftp.asdc.asi.it/sax/cal/bgd/. Counts in excess of the
background are detected in the MECS data alone. The latest response files were also
downloaded101010ftp://ftp.asdc.asi.it/sax/cal/responses/98_11 and the
various spectra were grouped such that there were 20 counts per bin. Spectra from MECS 2
and 3 were co-added and fit in the 1.3 – 10.0 keV energy range.
We note that previously Campana et al. (2001) analyzed this dataset and claimed that GRS 1009-45 was not detected, with an upper limit to the . However, these authors estimated the background flux level via the counts in an annulus around the source region. In contrast, following the recommended procedure as outlined in the data analysis cookbook, utilizing a blank sky field, we find 50 net counts at a position consistent with GRS 1009-45, see Table 1 for details. We note that Hameury et al. (2003) previously presented the results of an XMM-Newton observation of this system and reported an upper limit approximately a factor of 40 less than measured here. Given the 4 years that elapsed between these observations (1998 vs 2002) this suggests significant variability.
This paper was typeset using a LaTeX file prepared by the author