A Dual Diffusion Chamber for
Observing Ice Crystal Growth on c-Axis Ice Needles
Kenneth G. Libbrecht
Department of Physics, California Institute of Technology
Pasadena, California 91125
Abstract. We describe a dual diffusion chamber for observing ice crystal growth from water vapor in air as a function of temperature and supersaturation. In the first diffusion chamber, thin c-axis ice needles with tip radii nm are grown to lengths of mm. The needle crystals are then transported to a second diffusion chamber where the temperature and supersaturation can be independently controlled. By creating a linear temperature gradient in the second chamber, convection currents are suppressed and the supersaturation can be modeled with high accuracy. The c-axis needle crystals provide a unique starting geometry compared with other experiments, and the dual diffusion chamber allows rapid quantitative observations of ice growth behavior over a wide range of environmental conditions.
1 Introduction
The basic physics underlying crystal growth is remarkably rich, as processes over many length scales – from short-range molecular dynamics to long-range diffusion effects – work in concert to determine surface growth rates and crystal growth morphologies. The formation of faceted dendritic structures has been particularly challenging to understand in detail, requiring simultaneous descriptions of both the surface attachment kinetics (responsible for faceting) as well as particle and/or heat transport via diffusion surrounding the crystal (driving dendritic growth). Even realizing stable computer simulations that qualitatively reproduce observed structures has been achieved only recently [1, 2].
The formation of snow crystals – ice crystals grown from water vapor in air – is the most-studied example of faceted dendritic crystal growth to date, yet our understanding of these common structures is surprisingly poor. The dramatic variation of snow crystal morphology with growth temperature has been known for over 75 years, for example, yet this seemingly simple behavior is still without a satisfactory explanation [3]. One reason for this state of affairs is that the surface attachment kinetics depend in detail on the molecular structure of the ice surface, including surface melting, which is itself not well understood. In addition, we have recently found that the attachment kinetics depend on the mesoscale surface structure, further complicating our picture of ice crystal growth [4].
Making significant progress in crystal growth physics often requires quantitative comparisons between experimental observations and comprehensive computer modeling that incorporates all relevant physical processes. For the case of ice growth from water vapor, this begins with precise measurements of crystal growth rates and morphologies under well-defined conditions. Many of the ice-growth studies reported in the literature are not well-suited for quantitative analysis [5], and there remains much room for improvement on the experimental front.
Focusing on ice growth from water vapor, a variety of experimental methods have been used for measuring growth rates and morphologies under different conditions. We begin with a brief summary of these methods.
Growth on a flat substrate. In this method one begins with a small seed crystal resting on a flat substrate, and then observes its subsequent growth as a function of temperature, supersaturation, background gas pressure, and other conditions. This method affords many advantages, including: 1) small crystals can be observed, which is important for minimizing diffusion effects and measuring surface attachment kinetics; 2) interferometric techniques can be used for making precise measurements of growth rates; 3) aligning a crystal facet to the substrate gives a well-defined growth morphology relative to the substrate, and 4) the supersaturation is set by the temperature difference between the growing crystal and a nearby water vapor reservoir, which can yield exceptionally good determinations of this important quantity. The substrate method was used to make the most accurate measurements to date of the attachment coefficient for ice growth over a range of conditions [6], as well as exploring aspects of structure-dependent attachment kinetics [4]. Overall this method is perhaps the most useful for making precise measurements of ice growth rates in well-defined conditions.
Disadvantages of this method include: 1) ice/substrate interactions can substantially alter the ice growth rates [7]; 2) the supersaturation must remain below , limited by the formation of droplets on the substrate; and 3) neighboring crystals (near the test crystal but perhaps unseen) can strongly affect the supersaturation, so care must be taken to isolate a single test crystal.
Growth on a filament substrate. This method dates back to Nakaya’s measurements in the 1930s using rabbit hair [8], and more recent examples include the use of thin glass capillaries [9, 10]. Advantages of this method include: 1) the thin filament reduces substrate interactions somewhat and allows observations of full three-dimensional growth morphologies; 2) supersaturations above can be obtained if the growing crystal shields the filament to prevent droplet formation, and 3) single crystals can be observed, allowing good determinations of the surrounding supersaturation.
Disadvantages of this method include: 1) substrate interactions are significant and difficult to control; 2) the crystal morphology is typically not aligned with respect to the substrate, complicating the analysis of substrate interactions; 3) observing very small crystals is usually impractical, making it difficult to reduce diffusion effects. While the filament technique has been particularly useful in qualitative studies of ice growth, its disadvantages are nontrivial, especially substrate interactions, making it difficult to realize precise measurements.
Growth in free fall. In this method one typically nucleates crystals in air, allows them to grow in free-fall, and then observes them as they fall onto a substrate at the bottom of the growth chamber [11, 12]. Advantages of this method include: 1) there are no substrate interactions to contend with; 2) large numbers of crystals can be observed, allowing the study of rare morphologies (e.g. triangular plate crystals [13]); 3) very small crystals can be studied; and 4) free-fall growth chambers typically have larger volume/surface ratios than other growth chambers, allowing relatively cleaner environments (with fewer contaminants in the air) to be used.
Disadvantages include: 1) the presence of many growing crystals makes it difficult to determine the supersaturation accurately; 2) growth in near-vacuum conditions is typically not practical; 3) the growth cannot be observed continuously, and 4) the conditions are typically not uniform inside the growth chamber.
The free-fall method is especially useful for performing morphological studies with large numbers of crystals, but again this method is not well suited for making precise growth measurements, mainly because the supersaturation is difficult to determine.
Levitated crystals. Observing individual levitated crystals is a particularly appealing experimental method, as in principle it has a great many advantages, including: 1) the complete absence of substrate interactions; 2) very small crystals can be used; and 3) the crystal growth can be continuously monitored. In many ways levitated crystals are ideally suited for making precise growth measurements.
Disadvantages include: 1) the technical challenges are much greater than with the other methods; 2) maintaining levitation as the crystal mass increases can be problematic, and 3) controlling and determining the supersaturation may be difficult if ice condensation on the levitation hardware is close to the growing crystals.
The growth of ice crystals in ion traps has been reported [14], and ice crystals held in air flows have also been observed [15]. Levitation of ice crystals by thermo- and photophoretic forces has been demonstrated as well [16], as has acoustic levitation of ice particles [17]. With the exception of [15], these techniques have so far remained mainly in the demonstration phases, and have not yet been used to produce comprehensive measurements of ice growth rates.
Growth on ice needles. In this paper we describe the development of a novel method for observing the growth of ice crystals at the ends of slender ice needles. The needles are grown near C at high supersaturation by applying 2 kilovolts DC to a wire substrate. Once formed, the needles are transported to a second chamber for subsequent measurements. Advantages of this technique include: 1) there are no substrate interactions, even though the crystal is held in a stationary position; 2) the growth can be continuously monitored; 3) high supersaturations can be used to grow complex morphologies; and 4) a rapid turnaround makes it possible to study many crystals quickly.
The method has a number of disadvantages also, including: 1) the hardware is technically complex (although in practice quite reliable); 2) the ice needle interferes with the crystal growth at the tip (although in a well-defined way); 3) the supersaturation is somewhat influenced by the underlying wire substrate and the presence of neighboring needles near the test crystal.
We believe that the dual-chamber apparatus described here is well-suited for the study of fast-growing morphologies like thin plates, stellar crystals, and hollow columns under controlled conditions in air. Our hope is that quantitative measurements of these morphologies will provide new insights into Structure-Dependent Attachment Kinetics (SDAK) [4]. It appears that the SDAK mechanism is an important player in the growth of snow crystals, particularly the SDAK instability, and a better understanding of this enigmatic phenomenon is needed. Our dual-chamber apparatus should allow a quantitative exploration of the SDAK instability over a range of conditions, thus leading to a greater understanding of the detailed physical processes underlying ice crystal growth dynamics.
2 Dual Chamber Design
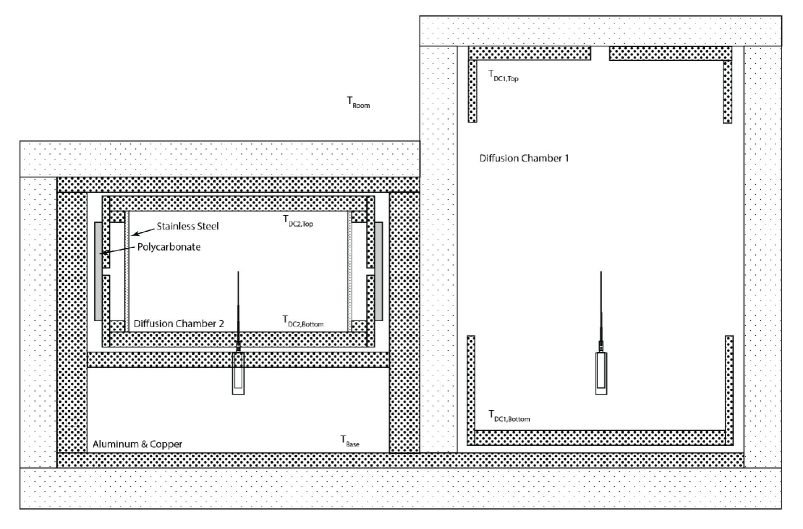
Figure 1 shows the overall layout of our dual-chamber apparatus. The use of two side-by-side diffusion chambers allows each to be optimized separately for its intended function. Diffusion Chamber 1 (DC1) was designed with an exceptionally high supersaturation, near 100% near C, as this is needed for reliably producing c-axis ice needles. Diffusion Chamber 2 (DC2) was designed to produce a well-known temperature and supersaturation in the vicinity of the growing crystals, where both parameters can be varied over a wide range. The two diffusion chambers are built upon a common base plate that is cooled to C using a recirculating chiller.
Also common to both chambers is the wire tip upon which ice crystals initially grow. At the base of the wire assembly is a small gearhead motor (Faulhaber 06/1 64:1 gearhead with 0615 C 003 S motor) that is used to rotate the wire, thus positioning the ice needles for observation in DC2. Typically the wire is rotated so the c-axis of a particular ice needle is perpendicular to the optical axis of the microscope. In this way the needle diameter as a function of time can be measured, along with the tip crystal diameter and thickness. Other observation angles yield additional information about the crystal morphology, etc.
The wire itself is a sharpened stainless steel acupuncture needle (SEIRIN J Type, 120 m in diameter, 40 mm long). The wire is supported by telescoping stainless steel tubes that connects it to the rotation motor. A manipulator arm mounted below the motor translates the motor/needle assembly back and forth between the two diffusion chambers. A pair of sliding shutters isolate the diffusion chambers from each other, minimizing air currents between the two, and both shutters are opened only briefly when the motor/needle assembly is being transported between the two chambers.
2.1 Diffusion Chamber 1
DC1 was designed to be an electric ice needle factory, capable of reliably producing c-axis ice needles on demand, following the procedures described in [18]. The inner dimensions of the diffusion chamber are 250 mm square by 350 mm in height. The walls are made from a combination of acrylic and polycarbonate sheets, surrounded by styrofoam insulation. The styrofoam is isolated from the inside of the chamber by the plastic sheets to avoid outgassing from the styrofoam. Outgassing from the plastic appeared to be negligible after some preliminary baking of the system.
A copper water reservoir is placed near the top of DC1, and this metal assembly is typically run at a temperature of 59.0 C. Metal side extensions reduce condensation on the walls near the top of the chamber (near the water reservoir) and serve to increase the temperature gradient (and thus the supersaturation) near the center of the chamber.
The aluminum assembly near the bottom of DC1 (see Figure 1) is typically held at a temperature of C, and again the side extensions increase the temperature gradient near the center of the chamber. The finite thickness of the insulating walls around DC1 mean that the temperature profile within the chamber depends slightly on the room temperature surrounding the apparatus. This effect was usually negligible, as the room temperature was also regulated by the building air-handling system.
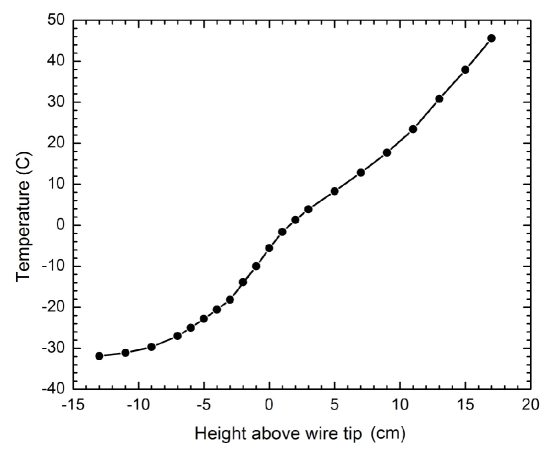
Figure 2 shows the vertical temperature profile along the central axis of DC1. This and other temperature measurements reveal that the isothermal surfaces within the chamber are not horizontal, which in turn means that there must be some convective air currents present. These slow convective motions likely significantly affect the supersaturation within the chamber, and modeling these effects would be challenging. However, the sole purpose of DC1 is to produce a high supersaturation near C at the wire tip, as these are the conditions needed for producing c-axis ice needles [18]. We use crystal growth rates as an indicator of the supersaturation (see below), but its exact value is otherwise not determined.
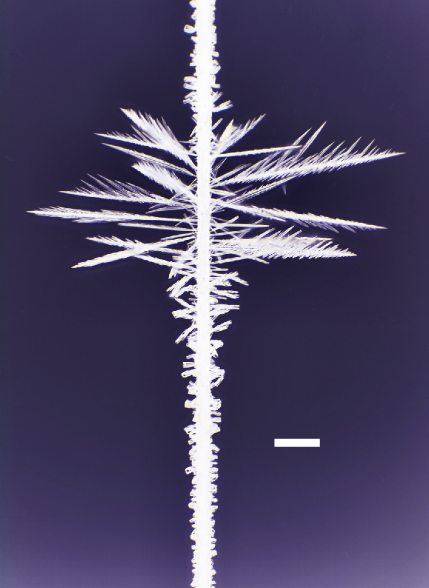
Figure 3 shows an example of ice crystals growing near a temperature of C within DC1, on a nylon filament placed along its central axis. The crystal growth morphology is strongly temperature dependent in this range, so observations like these provide an excellent surrogate for in situ temperature measurements as a function of height. The filament is typically placed in DC1 at the beginning of each run to verify that the system is performing satisfactorily, and it is otherwise not present.
The fastest growing crystals seen in Figure 3 are the “fishbone” crystals [19] growing near C. Through trial-and-error we determined that the best location for creating c-axis electric ice needles is just below the fishbone cluster. The temperature profile in DC1 was adjusted by changing the top and bottom temperatures, along with the heights of both sets of metal side extensions, so that the vertical location of the wire tip was near this optimum temperature. Once the chamber reached its operating state, we found that the vertical position of the needle cluster was stable to mm, which was the limit of our measurements.
The following procedure is followed to create a set of electric ice needles: 1) The wire is transferred to DC1, and ice crystals on the wire are knocked off as much as possible using a cold metal cylinder. Occasionally, if the wire is carrying a lot of ice, a warm metal cylinder is inserted through a hole in the top of DC1 to melt and clean ice crystals from the wire. Following this melt step, the cold cylinder is used to touch the wire and freeze the remaining water film. 2) With the wire tip in place, one ml of air containing a chemical additive is inserted into DC1 just below the wire. Silicone caulk (GE Silicone II) vapor is the best additive we have found to date, and this contains acetic acid vapor with an unknown mix of other volatile compounds. 3) After inserting the chemical additive, 2 kV DC is applied to the wire. Thin ice needles typically begin growing within a few seconds after the voltage is applied, and their growth is monitored using a long-distance microscope located outside DC1. 4) After the needles have grown to lengths of roughly 2 mm, which takes 10-15 seconds, the high voltage is turned off and a thin horizontal plate is immediately positioned above the wire. This plate reduces the supersaturation so fishbone crystals do not begin growing on the ice needles after the voltage is turned off. 5) The wire assembly with ice needles is then transferred to DC2 for further observations.
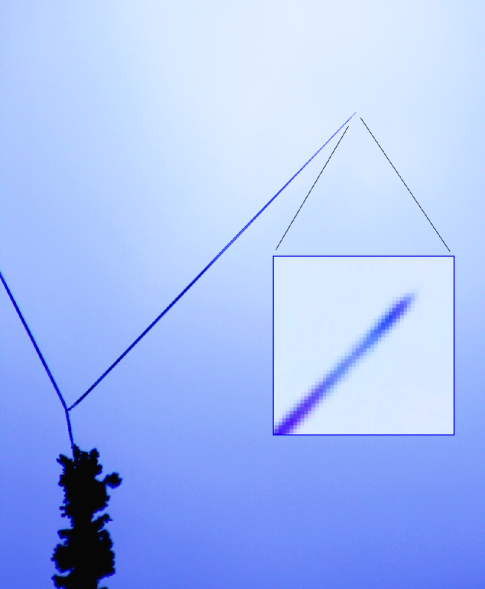
Figure 4 shows an example of an electric needle crystal immediately after being transferred to DC2. The needles are quite robust and usually survive the transfer well. Within roughly ten seconds one can position the wire tip in DC2, rotate it to its desired position, focus on a particular ice needle, and begin monitoring the subsequent growth of the crystal.
Several conditions are required to successfully produce c-axis electric ice needles [18]: 1) the temperature must be near C; 2) the supersaturation must be sufficiently high, above roughly 100 percent; 3) the applied voltage must be roughly 1 kV or higher; and 4) some chemical additive vapor must be present in the air. If all these conditions are met, then typically several c-axis needles grow out from the needle tip in random directions, and this happens with essentially a 100 percent yield. If any of the conditions are not met, then either no electric needles appear, or more commonly the needles will not grow along the c-axis.
When the nylon filament is placed in DC1, the fastest fishbone crystals grow with tip velocities of 3.5-4.0 m/sec. This observation serves as a surrogate supersaturation measurement, since the tip growth velocity depends approximately linearly on supersaturation in this range [18]. If the wire is positioned in the chamber with no applied voltage, then the fastest fishbone crystals grow with tip velocities of 7-8 m/sec. The factor of two increase is because crystals growing on the vertical filament above the C region (that is, at higher temperatures) shield the supersaturation, whereas no crystals are growing above the wire tip. With 2 kV applied, c-axis electric needles grow with tip velocities of 150-200 m/sec. An analysis of diffusion-limited growth indicates that these fast-growing electric needles have tip radii of approximately 100 nm during growth [18].
2.2 Diffusion Chamber 2
DC2 was designed to provide a stable, well-defined ice growth environment that can also be adjusted over a broad range in temperature and supersaturation. In particular, the chamber was designed to eliminate convective air currents as much as possible, so the supersaturation can be accurately calculated from the known boundary conditions inside the chamber.
To eliminate convection, the isothermal surfaces within the chamber must be horizontal, which is a nontrivial design feature. Referring to Figure 1, DC2 begins with an aluminum clam-shell construction, the top half being held at a temperature and the bottom half at Polycarbonate plates span the gap between the upper and lower halves, thus sealing the chamber to prevent air currents coming in from outside. Within the clamshell, 1.6-mm thick stainless steel plates form a set of inner walls, and their purpose is to provide a uniform linear temperature gradient along the walls. Heat flow down these plates is substantially higher than heat flow from the surrounding clamshell (the latter impeded by the low thermal conductivity of air), thus ensuring the linear temperature gradient. The inner dimensions of DC2 are 184.1x184.1x101.6 mm.
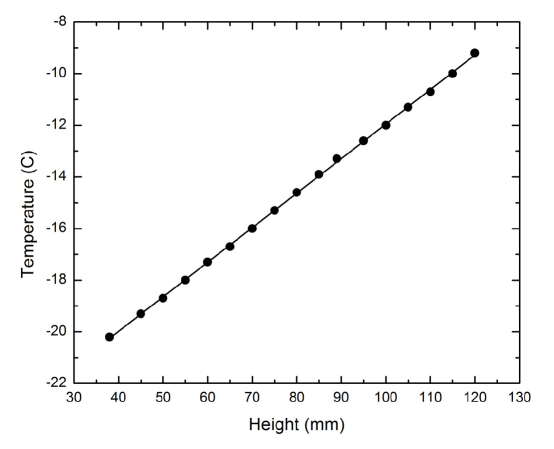
Figure 5 shows an example of a measured vertical temperature profile within DC2. For this measurement the top and bottom plate temperatures were set to C and C, respectively, giving a center temperature of C. A fit to these data yields a temperature gradient 0.134 C/mm, which differs from the expected value of 0.138 C/mm (for a plate separation of 101.6 mm) by three percent. The difference appears to be caused by slight heat leaks from the side windows in DC2 (each consisting of three insulated layers between the inner walls and the outside air), together with the fact that the thermistors used in DC2 are only rated to an absolute accuracy of 0.1 C.
Solving the heat diffusion equation within DC2 yields the solution
| (1) |
where this describes the wall temperature, the top and bottom temperatures, and the air temperature within the chamber. As long as the isothermal surfaces will be horizontal and no convection will occur.
The wire assembly passes through a small linear opening at the bottom of DC2, and this opening is blocked with a slit mylar sheet to reduce air currents. In addition, the temperatures below the bottom surface of DC2 are typically lower than (see Figure 1) providing a stable temperature gradient that prevents convection through the opening. The wire also passes through an opening in one wall of the chamber during its transfer from DC1, and a sliding shutter seals this opening except for the few seconds during transfer.
With convection essentially eliminated, the particle diffusion equation can be solved to determine the supersaturation within the chamber. If the walls were infinitely far away, then the water vapor concentration in the chamber would be (ignoring small corrections from, for example, the temperature dependence of the diffusion constant) and the supersaturation at the center of the chamber would be
to lowest order in where is measured in degrees Celsius in the second line of this equation. Note that is only a weak function of temperature, so this approximation is adequate for making rough calculations over the range C.
For better accuracy we numerically solve the diffusion equation within DC2, including the boundary condition that on the ice-covered walls of the chamber, where is the surface temperature at each point. These numerical models indicate that the center supersaturation is approximately 0.8 times the result given by Equation 2.2. The ice-covered wire adds an additional correction factor of approximately 0.9, depending on how much ice is on the wire, the length of the ice needle being tested, and the locations of any neighboring needles. A careful examination of these effects gives an absolute fractional uncertainty in the supersaturation of approximately percent under typical operating conditions. For C, for example, we find that the center supersaturation is well described by . A more detailed analysis of the supersaturation within DC2, along with test measurements, will be reported separately.
While DC1 includes an ample water reservoir (100 ml) at the top of the chamber, DC2 contains four shallow water reservoirs (15 ml each) at the bottom of the chamber. During the initial cooldown of the system, DC2 is run in reverse – with the top cooler than the bottom – in order to promote convection that carries water from the bottom reservoirs to the top and walls of the chamber. These surfaces become coated with water droplets during this phase (which lasts about three hours), and subsequently cooling the entire chamber to C for fifteen minutes freezes the droplets. This process coats essentially the entire inside surface of DC2 with a thin layer of ice, while maintaining the simple rectangular geometry of the chamber. The volume of ice transferred is sufficient that all surfaces will remain ice covered for the duration of an experimental run (typically less than ten hours).
3 Initial Observations
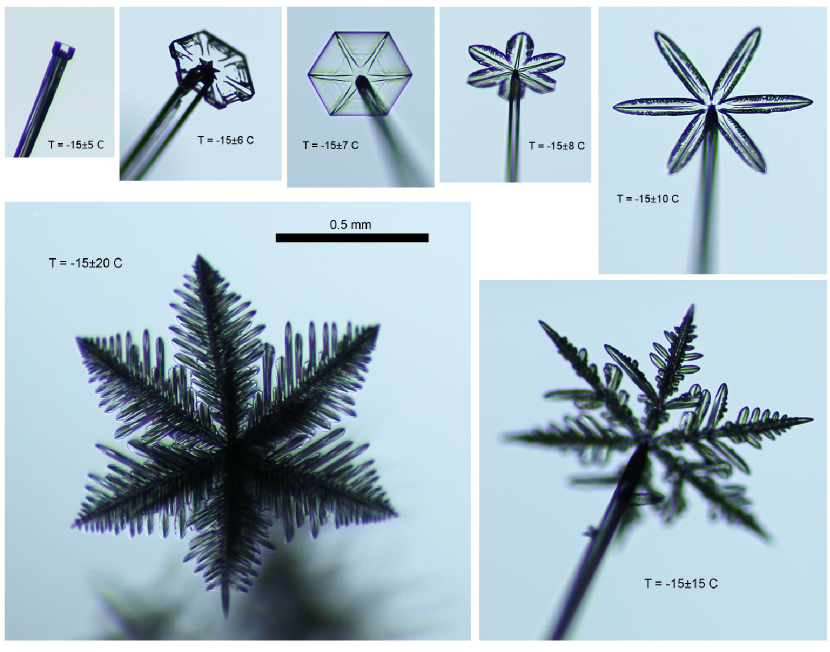
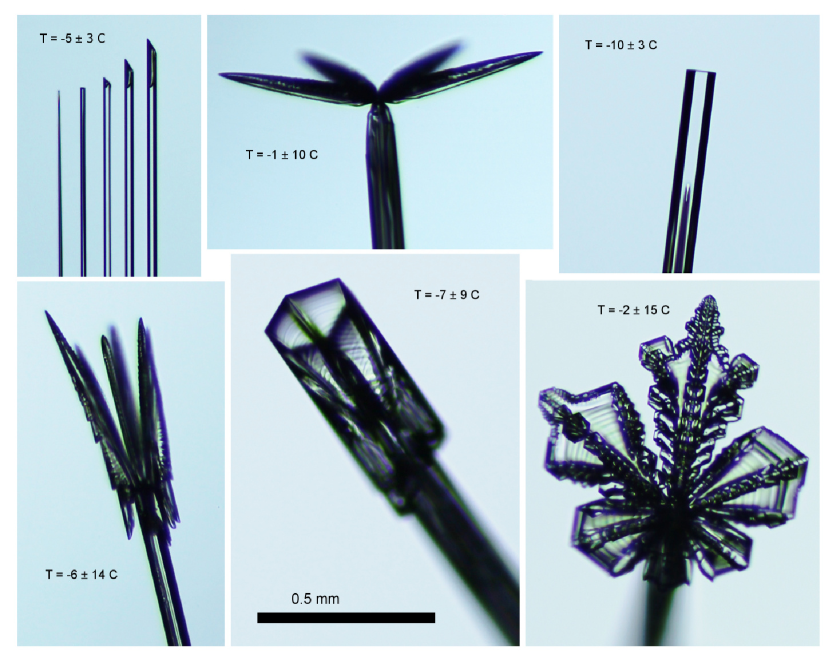
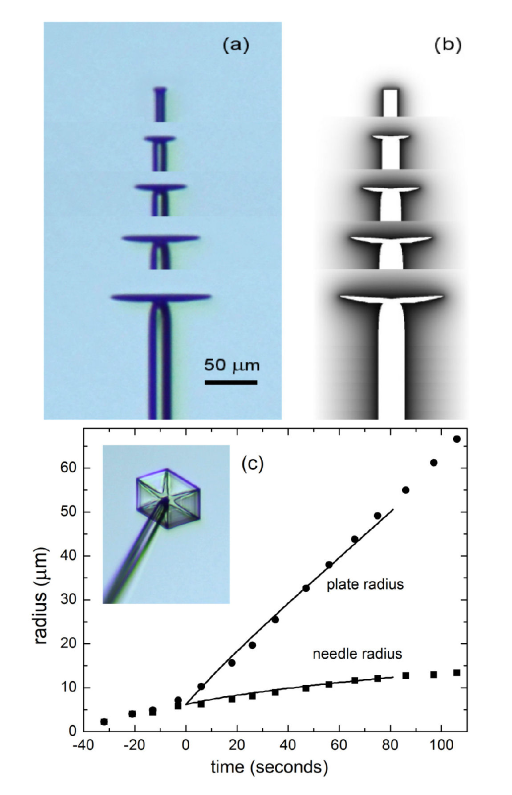
Figure 6 shows some example crystals grown on c-axis ice needles at C using this apparatus, showing the progression of morphologies at this temperature as a function of supersaturation. Figure 7 shows some additional example crystals grown at other temperatures. As described above, the dual-chamber apparatus is especially well suited to making quantitative measurements at known temperatures and supersaturations, for comparison with numerical models of faceted dendritic growth. Figure 8 shows one of our early attempts at 2D modeling of thin plates growing on ice needles, using the cellular automata technique described in [20]. Moving forward to full 3D numerical models remains a challenge, but recent progress in producing realistic models using accurate input physics appears quite promising [21].
References
- [1] J. Gravner and D. Griffeath, “Modeling snow-crystal growth: A three-dimensional mesoscopic approach,” Phys. Rev. E 79, 011601 (2009).
- [2] J. W. Barrett, H. Garcke, and R. Nurnberg, “Numerical computations of faceted pattern formation in snow crystal growth,” Phys. Rev. E 86, 011604 (2012).
- [3] K. G. Libbrecht, “The physics of snow crystals,” Rep. Prog. Phys., 68, 855-895 (2005).
- [4] K. G. Libbrecht, “Toward a comprehensive model of snow crystal growth dynamics: 1. Overarching features and physical origins,” arXiv:1211.5555 (2012).
- [5] K. G. Libbrecht, “A critical look at ice crystal growth data,” arXiv:cond-mat/0411662 (2004).
- [6] K. G. Libbrecht and M. E. Rickerby, “Measurements of surface attachment kinetics for faceted ice crystal growth,” J. Cryst. Growth 377, 1-8 (2013).
- [7] K. G. Libbrecht, “Managing systematic errors in ice crystal growth experiments,” arXiv:1208.5064 (2012).
- [8] Nakaya, U., “Snow Crystals: Natural and Artificial,” (Harvard University Press) (1954).
- [9] C. A. Knight, “Ice growth from the vapor at -5 degrees C,” J. Atmo. Sci. 69, 2031-40 (2012).
- [10] J. Nelson and C. Knight, “Snow crystal habit changes explained by layer nucleation,” J. Atmo. Sci. 55, 1452-65 (1998).
- [11] T. Gonda and M. Komabayasi, “Skeletal and dendritic structures of ice crystal as a function of thermal conductivity and vapor diffusivity,” J. Meteor. Soc. Japan 49, 32–41 (1971).
- [12] T. Gonda, “The growth of small ice crystals in gases of high and low pressures,” J. Meteor. Soc. Japan 54, 233–40 (1976).
- [13] K. G. Libbrecht and H. M. Arnold, “Aerodynamic stability and the growth of triangular snow crystals,” arXiv:0911.4267 (2009).
- [14] B. D. Swanson, M. J. Bacon, E. J. Davis, and M. B. Baker, “Electrodynamic trapping and manipulation of ice crystals,” Quart. J. Royal Meteor. Soc. 125, 1039-58 (1999).
- [15] T. Takahasi, T. Endoh, G. Wakahama, and N. Fukuta, “Vapor diffusional growth of free-falling snow crystals,” J. Meteor. Soc. Japan 69, 15–30 (1991).
- [16] T. Kelling, G. Wurm, and C. Durmann, “Ice particles trapped by temperature gradients at mbar pressures,” Rev. Sci. Instr. 82, 115105 (2011).
- [17] Y. J. Lu, W. J. Xie, and B. Wei, “Observation of ice nucleation in acoustically levitated water drops,” Appl. Phys. Lett. 87, 184107 (2005).
- [18] K. G. Libbrecht, T. Crosby, and M. Swanson, “Electrically enhanced free dendrite growth in polar and non-polar systems,” J. Cryst. Growth 240, 241-9 (2002).
- [19] K. G. Libbrecht, “Identification of a novel ”fishbone” structure in the dendritic growth of columnar ice crystals,” arXiv:0912.2522 (2009).
- [20] K. G. Libbrecht, “Quantitative modeling of faceted ice crystal growth from water vapor using cellular automata,” J. Comp. Meth. Phys. 174806 (2013).
- [21] J. G. Kelly and E. C. Boyer, “Physical improvements to a mesoscopic cellular automaton model for three-dimensional snow crystal growth, arXiv:1308.4910 (2013).