Jet-Shocked H2 and CO in the Anomalous Arms of Molecular Hydrogen Emission Galaxy NGC 4258
Abstract
We present a Spitzer Infrared Spectrograph (IRS) map of H2 emission from the nearby galaxy NGC 4258 (Messier 106). The H2 emission comes from of warm molecular hydrogen heated to 240-1040 K in the inner anomalous arms, a signature of jet interaction with the galaxy disk. The spectrum is that of a molecular hydrogen emission galaxy (MOHEG), with a large ratio of H2 over 7.7m PAH emission (0.37), characteristic of shocked molecular gas. We find close spatial correspondence between the H2 and CO emission from the anomalous arms. Our estimate of cold molecular gas mass based on CO emission is 10 times greater than our estimate of based on dust emission. We suggest that the value is 10 times lower than the Milky Way value because of high kinetic temperature and enhanced turbulence. The H2 disk has been overrun and is being shocked by the jet cocoon, and much of the gas originally in the disk has been ejected into the galaxy halo in an X-ray-hot outflow. We measure a modest star formation rate of 0.08 yr-1 in the central 3.4 kpc2 that is consistent with the remaining gas surface density.
Subject headings:
galaxies:active—galaxies:intergalactic medium—galaxies:jets1. Introduction
1.1. Radio Jet Feedback
Radio jet-interstellar medium (ISM) interactions may cause either positive or negative feedback on star formation in galaxies (Wagner & Bicknell, 2011). Jet feedback may explain the truncation of the galaxy mass function and quenching of star formation via expulsion or heating of the ISM (Croton et al., 2006). At larger scales, radio jets may prevent the cooling and accretion of intergalactic medium (Fabian et al., 2000). Hydrodynamical simulations of radio jets demonstrate that the jet deposits a large amount of energy, inflating a cocoon of hot gas that may encompass and shock the entire host galaxy ISM (Sutherland & Bicknell, 2007). Molecular gas may be dissociated by shocks and driven out of the galaxy by outflows, preventing star formation altogether. Alternatively, jet driven turbulence may support the gas against collapse, preventing star formation.
1.2. MOHEG Phenomenon
Ogle et al. (2010, 2007) find that 30% of 3C radio galaxies have extremely luminous H2 emission from large masses (up to ) of warm molecular gas. The H2 is heated to temperatures of 100-1500 K. UV excitation in photodissociation regions (PDRs) is ruled out by a very high ratio of L(H2 0-0 S(0)-S(3))/L(PAH 7.7 m). Heating by X-rays from the AGN is ruled out by insufficient X-ray luminosity. The remaining viable sources of heating are shocks driven into the ISM by the radio jet, or cosmic rays (Ogle et al., 2010).
Similar conditions and IR spectra are seen in the Stephan’s Quintet (SQ) intergalactic shock, where there is a close correspondence between X-ray, H, H2, [C II], and CO emission (Appleton et al., 2006; Cluver et al., 2010; Guillard et al., 2012; Appleton et al., 2013). The large range of densities, temperatures, and cooling timescales are characteristic of a shocked multiphase medium, where X-ray emitting gas occupies the lower-density spaces in the post-shocked gas (Guillard et al., 2009).
X-ray emission from jet-shocked gas is seen in several radio MOHEGs, including Per A (Fabian et al., 2006), Cen A (Kraft et al., 2007), and 3C 305 (Massaro et al., 2009; Hardcastle et al., 2012). Some radio MOHEGs display jet-driven neutral and ionized outflows with velocities up to 1200 km s-1 (Morganti et al., 2005; Emonts et al., 2005; Guillard et al., 2012). The limited spatial resolution of mid-IR H2 observations of distant radio galaxies has made it difficult to determine the relationship between the radio jet, X-ray emitting gas, outflows, and the H2 emission region. It is unknown whether the H2 emission comes from a distinct shock front or is distributed more widely in the galaxy. It is also unclear whether the H2 emission arises from preexisting molecular gas that has been shocked in-situ, entrained in an outflow, or created in the postshock gas.
1.3. Anomalous Arms and Jet Feedback in NGC 4258
NGC 4258 (Messier 106, , Mpc) is a nearby galaxy hosting a Seyfert 1.9 AGN (Ho et al., 1997). It is known for its anomalous spiral arms, which emerge from the galaxy nucleus and appear to intersect the regular spiral arms of the galaxy (Courtes & Cruvellier, 1961). It is famous for water maser emission from a nuclear disk that enables accurate measurement of the central black hole mass (Miyoshi et al., 1995; Greenhill et al., 1995).
The anomalous spiral arms of NGC 4258 emit strongly in radio continuum (van der Kruit, Oort, & Mathewson, 1972), optical nebular lines, and X-rays. Optical emission line ratios (Cecil, Morse, & Veilleux, 1995) and X-ray spectroscopy (Cecil, Wilson, & De Pree, 1995; Wilson et al., 2001; Yang et al., 2007) indicate K shocked gas in the anomalous arms. Large lobes of X-ray emitting plasma extend above and below the galactic disk, from a jet-driven outflow (Cecil, Wilson, & De Pree, 1995; Wilson et al., 2001). A series of H-emitting streamers of ionized gas branch off of the anomalous arms, marking cooler gas entrained by the hot outflow.
The 3-dimensional orientation of the inner radio jet relative to the maser disk is well-constrained by VLBI observations. Jet hot spots indicate a consistent jet orientation at larger scales, at an angle of 30° to the plane of the galaxy disk (Cecil et al., 2000). Wilson et al. (2001) propose that the anomalous arms are the projection of the jet along the disk, along a “line of destruction”. Gas is blown out the opposite side of the disk to the jet.
2. Observations and Results
A map of NGC 4258 was made with Spitzer IRS SL1,2 and LL1,2 modules (PID 30471, PI J. D. Smith). The 60 s SL observations were stepped perpendicular to the slit . The 30 s LL observations were stepped perpendicular to the slit and parallel to the slit . The inner ( kpc) of the galaxy is covered by all 4 modules. There is extended coverage along the SL and LL slits, which are oriented in perpendicular directions. Spectral cubes were constructed from each IRS module with the IDL program CUBISM (Smith et al., 2007a), using the off-pointed slit for background subtraction, and 5 global bad pixels were cleaned from the data.
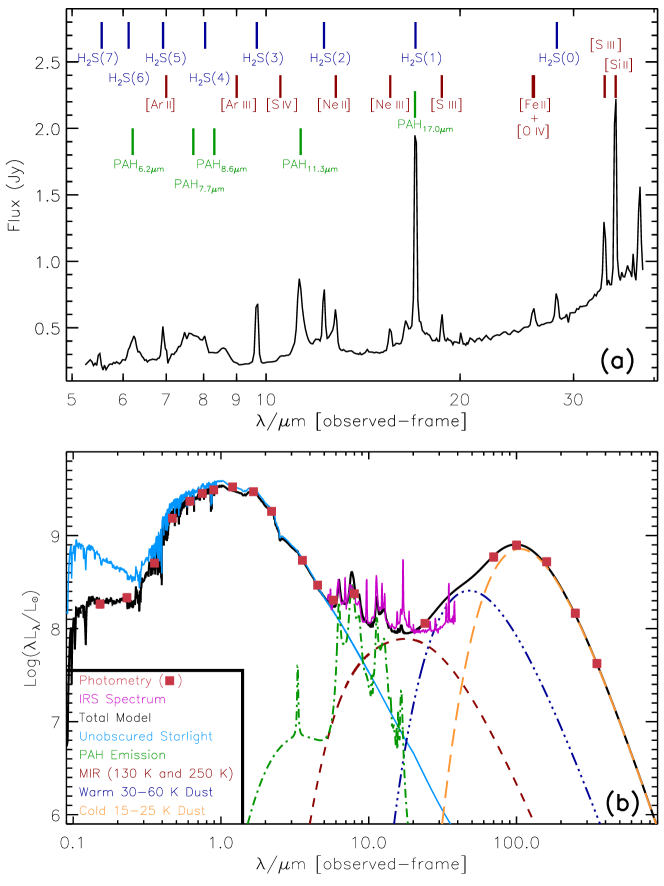
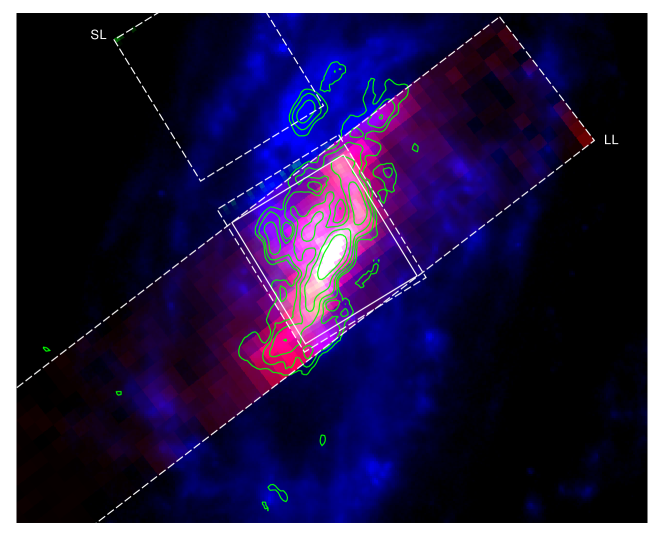
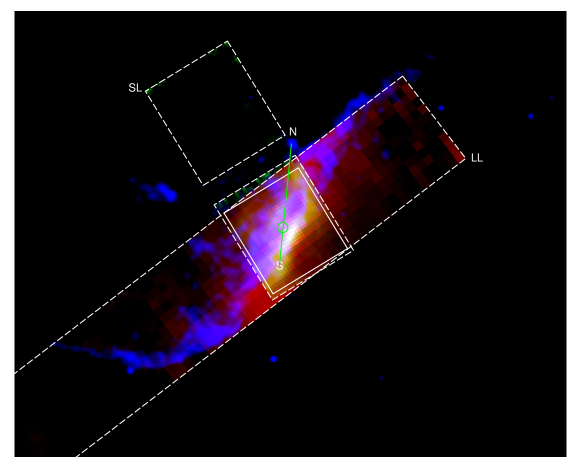
The integrated IRS spectrum is shown in Figure 1a. The spectrum was extracted from the spectral cubes in the overlap region between the SL and LL slits indicated in Figure 2. Line and polycyclic aromatic hydrocarbon (PAH) feature fluxes (Table 1) were fit using PAHFIT (Smith et al., 2007b). The H2 pure rotational lines are extraordinarly strong relative to the PAH and continuum emission. Ionized emission lines include [Ar ii] 6.99, [S iv] 10.51, [Ne ii] 12.81, [Ne iii] 15.56, [S iii] 18.71, [O iv] 25.89, [Fe ii] 26.00, [S iii] 33.48, and [Si ii] 34.82. The high ionization lines of [Ne vi] 7.65, [Ne v] 14.3, and [Ne v] 24.31 are undetected.
We extracted slices from the SL1 and LL2 cubes at the wavelengths of the H2 9.66 m 0-0 S(3) and 17.03 m 0-0 S(1) lines. Ancillary images were collected from GALEX (FUV, NUV), SDSS DR10 (u, g, r, i, z), 2MASS (J, H, K), Spitzer IRAC (3.6, 4.5, 5.8, 8.0m), MIPS 24 m, Herschel PACS (70, 100, 160 m) and SPIRE (250, 350 m). We extracted matched photometry in each band, inside the IRS spectral extraction region, including the AGN, and used these to form the spectral energy distribution (SED, Figure 1b). We find an upper limit of 40% on the percentage AGN contribution to the PACS photometry within a radius.
The IRS H2 maps in Figure 2 are overlaid on the Spitzer IRAC 8 m image, with CO 1-0 emission contours mapped by BIMA (Helfer et al., 2003). A primary ridge of H2 emission is located 6″ SW of the AGN, running SE-NW along the edge of the anomalous arms. The brightest H2 S(3) emission appears along the inner edge of this ridge, where it is closest to the AGN and jet. The ridge bends to the NE at a location 20″ NW of the AGN. A secondary ridge of emission is located 6″ NE of the AGN. The H2 ridges correspond closely to the ridges of CO emission (Martin et al., 1989; Krause, Fendt, & Neininger, 2007). There is no clear relationship between H2 emission and the PAH and hot dust emission in the IRAC 8 m image, consistent with the results of Laine et al. (2010), who find no obvious impact of the jet on the distribution of 8 m emission.
We compare our Spitzer H2 map with a Chandra 0.3-8 keV image of the anomalous arms, retrieved from the archive (combined ObsIDs 350, 1618, 2340; PI A. Wilson). The Chandra image has been cleaned of extranuclear point sources and smoothed. The clear association between H2 and X-ray emission from the inner anomalous arms (Fig. 3) suggests that both are powered by jet-driven shocks. The X-ray emitting gas is located either in gaps between the molecular clouds, or in streams of ejecta directed out of the plane of the galaxy. The H2 emitting gas appears to be confined to the plane, and does not follow the anomalous arms out of the plane. However, the H2 emission does extend well beyond the projection of the radio jet axis. We suggest that the warm H2 and hot, intercloud X-ray emitting gas are in the turbulent post-shocked layer left behind as the jet cocoon has expanded and overrun a multi-phase medium.
The inner X-ray jet lies in a channel between two molecular ridges (Fig. 4). An anticorrelation between the H2 and X-ray emission is clearly seen at 6-9″ by comparing their azimuthal profiles (Fig. 4). A similar anticorrelation is seen between H emission and CO emission at these distances (Martin et al., 1989). The jet may have carved out a hole in the molecular gas disk, or alternatively the X-ray and H emitting gas is confined by a preexisting hole in the disk.
3. Discussion
3.1. H2 Temperature Distribution and Heating
We created an excitation diagram for the H2 pure rotational lines, and used this to estimate the mass of warm H2 as a function of temperature, assuming thermal equilibrium. Three temperature components are required to fit the excitation diagram, with (H2) , , and at K, 450 K, and 1040 K, respectively. The total warm H2 mass at K is therefore (H2) .
The mid-IR (MIR) line luminosities inside our IRS extraction region are given in Table 1. The total ionized gas MIR line luminosity is L(MIR,ionized) erg s-1, compared to the total H2 0-0 S(0)-S(7) rotational line luminosity of L(H2 0-7) erg s-1. H2 emission is one of the main ISM cooling channels. The luminosity of H2, summed over the first 4 transitions is L(H2) erg s-1, while the PAH 7.7m luminosity is L(PAH 7.7) erg s-1. The ratio is (H2)/(PAH 7.7) , which qualifies NGC 4258 as a MOHEG (Ogle et al., 2010). A large ratio of H2 to PAH 7.7 m () indicates that the H2 is not heated by UV photons from hot stars in a PDR (Guillard et al., 2012).
We measure an unabsorbed 2-10 keV luminosity of erg s-1 for the AGN from the Chandra image. The ratio of L(H2)/(AGN, 2-10 keV) = 0.54 rules out AGN heating of the H2 by X-rays from the nucleus, which has a maximum ratio of 0.01 (Ogle et al., 2010). The extended thermal X-ray emission inside the IRS extraction region has a total 0.3-2 keV luminosity of erg s-1, which is a factor of less than the total H2 line luminosity, and therefore contributes a negligible amout of X-ray heating to the H2.
Heating by mechanical energy from the jet via shocks or cosmic rays is the prime candidate for powering the H2 emission. The radio jet power dissipated at its terminal hotspots is estimated to be erg s-1, based on the H luminosities of the N and S bow shocks, assuming an 0.82% conversion efficiency (Cecil et al., 2000). This is only 36% of the total H2 power measured within the IRS spectral extraction region. In order to power the observed H2 emission, the jet must be at least three times more powerful than the above estimate. Additional power may be dissipated along the entire length of the jet, particularly where the primary H2 emission ridge is brightest, near the AGN (Figures 2 and 3).
3.2. CO and Dust Emission
We measure the BIMA CO 1-0 flux (Helfer et al., 2003) in our IRS extraction region to be 1783 Jy km/s. Using the standard Galactic conversion factor of cm-2/(K km s-1) (Lebrun et al., 1983; Bolatto et al., 2013), we estimate a cold H2 mass of . This is in agreement with previous CO measurements and H2 mass estimates of (Cox & Downes, 1996; Krause, Fendt, & Neininger, 2007). However, we find evidence for a nonstandard value below, so this is likely an overestimate of the molecular gas mass.
The integrated 42-122 m luminosity from the IRS extraction region is (FIR) erg s-1. We estimate a dust mass of by fitting the FIR SED with a modified blackbody with dust emissivity powerlaw index ; in agreement with a dust mass of derived by fitting the UV-FIR SED (Fig. 1b) using MAGPHYS (da Cunha et al., 2008). We use this to estimate a total gas mass of , assuming a gas/dust mass ratio of 100, as found in the Milky Way (Savage & Mathis, 1979). This is only 10% of the molecular gas mass estimated from CO using the standard value. The corresponding gas surface density is pc-2.
To reconcile the large molecular gas mass estimated from CO with the smaller total gas mass estimated from FIR dust emission, either the dust/gas ratio must be a factor of 10 smaller, or the value must be a factor of 10 lower than in the Milky Way. While we can not rule out a low dust/gas ratio in the H2 emission region, dust absorption is seen in optical images of this region with a morphology similar to the H2 emission. In support of a low factor is the close spatial correspondence between CO 1-0 emission and H2 emission. If most CO emission comes from the same 240-1040 K gas as the H2 emission, we expect the CO emission to be enhanced by the high temperature and any additional turbulence. Some other nearby galaxies show similarly depressed values in their central regions (Sandstrom et al., 2013). The warm H2 in NGC 4258 constitutes roughly 1% of the CO-derived molecular mass, or 10% of the dust-derived gas mass. This warm H2 percentage is similar to that seen for LINER and Seyfert nuclei in the SINGS sample (Roussel et al., 2007).
3.3. Jet Feedback on ISM and Star Formation
The radio jet has a clear impact on the temperature and spatial distribution of molecular and atomic gas in the anomalous arms of NGC 4258. The question remains whether it has a significant impact on the gas content, star formation rate, and evolution of the central regions of NGC 4258 and the galaxy as a whole. The clearest indication that the jet is ejecting large quantities gas from the galaxy is seen in X-ray images, where bubbles of hot gas extend far above and below the plane. Integrating over the entire X-ray lobes and assuming a filling factor of , we find of 0.2-0.9 keV gas cooling at a rate of yr-1. An outflow of hot gas at this rate is necessary to sustain the X-ray emission from the lobes, assuming no additional source of heating. If the gas in the center of the galaxy is the source of this outflow, then most of it has already been ejected into the galaxy halo and the rest would be depleted in yr, if not replenished.
We estimate the star formation rate in the IRS extraction region using two methods. The MAGPHYS model (Fig. 1b) gives a best-fit star formation rate (SFR) of yr-1 and a stellar mass of . In agreement with this, we estimate SFR(PAH 7.7) (PAH 7.7) yr-1 from the luminosity of the 7.7m PAH feature (Roussel et al., 2001). In comparison, the Kennicutt-Schmidt (KS) law (Kennicutt, 1998) predicts a SFR surface density of yr-1 kpc-2 for the dust-derived gas surface density of (H2) pc-2, or a total SFR of yr-1, in agreement with the observed SFR. However, if were to use the CO-based molecular gas mass density of (H2) pc-2, the KS law would predict a 25 times greater SFR of 2.5 yr-1, in disagreement with the observed vaule. This demonstrates the crucial role the factor plays in estimates of SFR suppression, which may be greatly overestimated in MOHEGs where CO emissivity is enhanced and the value is low.
4. Conclusions
We find H2 emission aligned with the inner anomalous arms of NGC 4258, tracing a large mass of shocked molecular gas. The high H2/PAH 7.7 m ratio of 0.37 is similar to radio galaxies and other MOHEG systems. The H2 emission appears to be powered by the jet-ISM interaction, which drives shocks into the galaxy disk and generates the outflow of hot gas seen in X-ray emission. However, the jet must be at least 3 times more powerful than previous estimates in order to drive the observed H2 luminosity of L(H2) erg s-1. The standard overpredicts the molecular gas mass by a factor of 10 compared to the FIR-derived gas mass of . It is likely that CO emission is enhanced and is suppressed by the high temperature and turbulent motions in the jet-shocked anomalous arms. Taking this into account, and using the lower, FIR-derived gas mass, there is no indication of significant suppression of the SFR in the central regions of NGC 4258 relative to normal galaxies. While the SFR is not suppressed in the remaining central molecular disk of NGC 4258, we estimate that most of the gas originally there has already been ejected into the X-ray emitting lobes, and that the rest will be ejected in yr.
References
- Appleton et al. (2013) Appleton, P. N., Guillard, P., Boulanger, F. et al. 2013, ApJ, 777, 66
- Appleton et al. (2006) Appleton, P. N., Xu, K. C., Reach, W. et al. 2006, ApJ, 639, L51
- Bolatto et al. (2013) Bolatto, A. D., Wolfire, M., & Leroy, A. K. 2013, ARA&A, 51, 207
- Cecil et al. (2000) Cecil, G., Greenhill, L. J., DePree, C. G. et al. 2000, ApJ, 536, 675
- Cecil, Morse, & Veilleux (1995) Cecil, G., Morse, J. A., & Veilleux, S. 1995, ApJ, 452, 613
- Cecil, Wilson, & De Pree (1995) Cecil, G., Wilson, A. S., & De Pree, 1995, ApJ, 440, 181
- Cluver et al. (2010) Cluver, M. E., Appleton, P. N., Boulanger, F. et al. 2010, ApJ, 710, 248
- Courtes & Cruvellier (1961) Courtes, & Cruvellier, 1961, Compt. Rend. Acad. Sci. Paris, 253, 218
- Cox & Downes (1996) Cox, P. & Downes, D. 1996, ApJ, 473, 219
- Croton et al. (2006) Croton, D. J., Springel, V., White, S. D. M. et al. 2006, MNRAS, 365, 11
- da Cunha et al. (2008) da Cunha, E., Charlot, S., & Elbaz, D. 2008, MNRAS, 388, 1595
- Emonts et al. (2005) Emonts, B. H. C., Morganti, R., Tadhunter, C. N. et al. MNRAS, 362, 931
- Fabian et al. (2006) Fabian, A. C., Sanders, J. S., Taylor, G. B., et al. 2006, MNRAS 366, 417
- Fabian et al. (2000) Fabian, A. C., Sanders, J. S., Ettori, S. et al. 2000, MNRAS, 318, 65
- Greenhill et al. (1995) Greenhill, L. J., Jiang, D. R., Moran, J. M., & Reid, M. J. 1995, ApJ, 440, 619
- Guillard et al. (2009) Guillard, P., Boulanger, F., Pineau des Forets, G., & Appleton, P. N. 2009, A&A, 502, 515
- Guillard et al. (2012) Guillard, P., Boulanger, F., Pineau des Forets, G. et al. 2012, ApJ, 749, 158
- Guillard et al. (2012) Guillard, P., Ogle, P. M., Emonts, B. H. C. et al. 2012, ApJ, 747, 95
- Helfer et al. (2003) Helfer, T. T., Thornley, M. D., Regan, M. W. et al. 2003, ApJS, 145, 259
- Ho et al. (1997) Ho, L. C., Fillipenko, A. V., & Sargent, W. L. W. 1997, ApJS, 112, 315
- Kennicutt (1998) Kennicutt, R. C. 1998, ApJ, 498, 541
- Kraft et al. (2007) Kraft, R. P., Nulsen, P. E. J., Birkenshaw, M. et al. 2007, ApJ, 665, 1129
- Krause, Fendt, & Neininger (2007) Krause, M., Fendt, C., & Neininger, N. 2007, A&A, 467, 1037
- Laine et al. (2010) Laine, S., Krause, M., Tabatabaei, F. S., & Siopis, C. 2010, AJ, 140, 1084
- Lebrun et al. (1983) Lebrun, F., Bennett, K., Bignami, G. F. et al. 1983, ApJ, 274, 231
- Massaro et al. (2009) Massaro, F., Chiaberge, M., Grandi, P. et al. 2009, ApJ, 692, 123
- Miyoshi et al. (1995) Miyoshi, M., Moran, J., Hernstein, J. et al. 1995, Nature, 373, 127
- Morganti et al. (2005) Morganti, R., Tadhunter, C. N., & Osterloo, T. A. 2005, A&A, 444, L9
- Martin et al. (1989) Martin, P., Roy, J. R., Noreau, L., & Lo, K. Y. 1989, A&A, 345, 707
- Hardcastle et al. (2012) Hardcastle, M. J., Massaro, F., Harris, D. E. et al. 2012, MNRAS, 424, 1774
- Ogle et al. (2010) Ogle, P., Boulanger, F., Guillard, P. et al. 2010, ApJ, 724, 1193
- Ogle et al. (2007) Ogle, P., Antonucci, R., Appleton, P. N., & Whysong, D. 2007, ApJ, 668, 699
- Roussel et al. (2007) Roussel, H., Helou, G., Hollenbach, D. J. et al. 2007, ApJ, 669, 959
- Roussel et al. (2001) Roussel, H., Sauvage, M., Vigroux, L., & Bosma, A., 2001, A&A, 372, 427
- Sandstrom et al. (2013) Sandstrom, K. M., Leroy, A. K., Walter, F. et al. 2013, ApJ, 777, 5
- Savage & Mathis (1979) Savage, B. D. & Mathis, J. S. 1979, ARA&A, 17, 73
- Sutherland & Bicknell (2007) Sutherland, R. S. & Bicknell, G. V. 2007, ApJS, 173, 37
- Smith et al. (2007a) Smith, J. D. T., Armus, L., Dale, D. A. et al. 2007a, PASP, 119, 1133
- Smith et al. (2007b) Smith, J. D. T., Draine, B. T., Dale, D. A. et al. 2007b, ApJ, 656, 770
- van der Kruit, Oort, & Mathewson (1972) van der Kuit, P.C., Oort, J. H., & Mathewson, D. S. 1972, A&A, 21, 169
- Wagner & Bicknell (2011) Wagner, A. Y., & Bicknell, G. V. 2011, ApJ, 728, 29
- Wilson et al. (2001) Wilson, A. S., Yang, Y., & Cecil, G. 2001, ApJ, 560, 689
- Yang et al. (2007) Yang, Y., Li, B., Wilson, A. S., & Reynolds, C. S. 2007, ApJ, 660, 1106
| Line | H2 S(7) | H2 S(6) | H2 S(5) | H2 S(4) | H2 S(3) | H2 S(2) | H2 S(1) | H2 S(0) | PAH 7.7 |
|---|---|---|---|---|---|---|---|---|---|
| (m) | 5.55 | 6.11 | 6.91 | 8.03 | 9.66 | 12.28 | 17.03 | 28.22 | 7.7 |
| Flux | 4.1 | 1.2 | 10.1 | 4.70 | 20.47 | 10.45 | 29.49 | 2.8 | 172. |
| Flux Unc. | 0.4 | 0.2 | 0.3 | 0.05 | 0.03 | 0.02 | 0.04 | 0.4 | 1. |
| Luminosity | 0.26 | 0.08 | 0.64 | 0.30 | 1.29 | 0.66 | 1.86 | 0.18 | 10.8 |
| Line | [Ar ii] | [S iv] | [Ne ii] | [Ne iii] | [S iii] | [O iv] | [Fe ii] | [S iii] | [Si ii] |
| (m) | 6.99 | 10.51 | 12.81 | 15.56 | 18.71 | 25.89 | 26.00 | 33.48 | 34.82 |
| Flux | 3.5 | 0.94 | 5.28 | 3.66 | 2.98 | 1.3 | 1.5 | 4.796 | 13.179 |
| Flux Unc. | 0.3 | 0.02 | 0.02 | 0.03 | 0.03 | 0.5 | 0.4 | 0.002 | 0.003 |
| Luminosity | 0.22 | 0.06 | 0.33 | 0.23 | 0.19 | 0.08 | 0.09 | 0.30 | 0.83 |
Note. — Spitzer IRS line flux ( erg s-1 cm-2 Hz-1) and luminosity ( erg s-1) within central kpc of NGC 4258.