Extended Star Clusters in NGC 1023 from HST/ACS Mosaic Imaging
Abstract
Faint fuzzies are a relatively new class of star cluster, first found in the nearby S0 galaxy NGC 1023 by Larsen & Brodie using WFPC2 images from the Hubble Space Telescope (HST). Here we investigate the star cluster system of NGC 1023 using an eight pointing mosaic of ACS images from HST. We identify blue and red normal globular clusters (two of which are particularly luminous and dense) and two ultra compact dwarf objects (with effective radius 10 pc). With our more complete spatial coverage, we also find 81 red and 27 blue faint fuzzies (FFs). We confirm the association of the red FFs with the disk of NGC 1023, consistent with them being long-lived open clusters. Half of the blue FFs appear to be associated with the dwarf satellite galaxy NGC 1023A (which was largely absent from the original HST/WFPC2 coverage), while the remainder are spatially coincident with the densest HI gas that surrounds NGC 1023. The blue FFs have colours that are consistent with young (few 100 Myr old) star clusters that formed during the most recent interaction between NGC 1023 and its satellite NGC 1023A.
keywords:
galaxies: star clusters – galaxies: evolution – galaxies: lenticular – galaxies individual (NGC 1023)1 Introduction
At the turn of century, Larsen & Brodie (2000) reported the discovery of star clusters in the nearby (11.1 Mpc) S0 galaxy NGC 1023 using HST/WFPC2 imaging. As well as normal globular clusters (see Kartha et al. 2014 for a recent analysis), NGC 1023 hosts a population of faint objects with large sizes (i.e. effective radii of 7-20 pc) and low surface brightness. Most are red in colour and subsequent follow-up spectroscopy with the Keck telescope confirmed their high metallicity and old ages (Larsen & Brodie 2002). They dubbed these objects Faint Fuzzies (FFs). They add to the ever increasingly family of old star clusters which are filling the parameter space of size and luminosity (e.g. Brodie et al. 2011; Bruens & Kroupa 2012; Forbes et al. 2013).
Using the ACS VCS survey data, Peng et al. (2006) found a number of similar objects in 12 early-type Virgo cluster galaxies (most of which were morphologically classifed as S0). They suggested that the best Galactic analog to these clusters, which they called Diffuse Star Clusters (DSCs), were old open clusters.
Based on the kinematics of red FFs in NGC 1023, Burkert et al. (2005) found them to lie in a fast rotating ring structure and suggested that they had formed in a galaxy interaction. Chies-Santos et al. (2013) compared red FF kinematics with those of Planetary Nebulae and the HI gas finding disk-like kinematics and concluded that the red FFs are not associated with an ongoing galaxy merger but are simply long-lived open disk clusters. Further support for the long-lived in-situ formation of the FFs comes from the modelling of Brüns et al. (2009) who showed that merging star clusters could reproduce well the size, mass and spatial distribution of FFs in NGC 1023.
Thus FFs and DSCs appear to be old open clusters associated with disks in lenticular galaxies. They may also be common in the disks of late-type spirals but are difficult to detect (and therefore study) within a complex, dusty disk.
Here we analyse a mosaic of eight HST/ACS images in two filters of NGC 1023. This is one of only a few early-type galaxies with such extensive ACS spatial coverage. It also includes the dwarf satellite galaxy NGC 1023A, which was largely missing from the HST/WFPC2 coverage. With a wider and more continuous field-of-view than the original study of Larsen & Brodie (2000) using HST/WFPC2 we search for additional red FFs to confirm their disk-like 2D distribution. Larsen & Brodie (2000) also found two blue FFs associated with NGC 1023A. Greater spatial coverage will also aid in quantifying the blue FF population.
2 Data Reduction and Analysis
The eight HST/ACS F475W (g) and F850LP (z) band images used in this study were taken as part of proposal 12202 (PI: Sivakoff). Exposure times were typically 768s in the g band and 1308s in the z band. The eight images create a rare ACS mosaic of a nearby early-type galaxy, covering approximately 12 7 sq. arcmins.
Objects were detected in the individual images using the SExtractor package (Bertins & Arnouts 1996). Photometry of these sources was carried out using DAOPHOT. After the initial selection, magnitudes in 5 pixel (0.25 arcsec) radius aperture were measured and an aperture correction applied based on isolated objects in each image. Like the previous work of Larsen & Brodie (2000), our magnitudes may be systematically underestimated by a few tens of a magnitude for the largest objects but the colours are largely independent of any aperture correction. Total instrumental magnitudes were calibrated to the AB photometric system using zero points of Sirianni et al. (2005). Effective radii (which we refer to as Re or simply size) were measured using the ISHAPE code (Larsen 1999) with a King profile concentration parameter fixed to 30 (as is commonly used, e.g. Larsen & Brodie 2000; Usher et al. 2013). Thus Re is the half-light radius of the best fitting c = 30 King profile. Common objects found in multiple pointings have their magnitudes and errors averaged. Finally, we correct the magnitudes and colours for Galactic extinction following Schlafly & Finkbeiner (2011). Below we quote extinction-corrected values.
Star cluster candidates are selected to have colours 0.6 g–z 1.8 (which corresponds to –2.6 [Z/H] 1.1 according to the globular cluster based transformation of Usher et al. 2012). We also impose a faint magnitude cut of z 23.5, which is effectively a cut in photometric error of less than 0.1. In addition, a minimum size of 0.3 pc was used to effectively remove stars. We did not employ a maximum size limit but a visual inspection was carried out to conservatively remove background galaxies. Table 1 lists the positions, g and z magnitudes, g–z colours and half-light effective radii for the final 358 star cluster candidates. This includes a dozen objects that may be associated with NGC 1023A.
| ID | RA | Dec. | g | gerr | z | zerr | g–z | g–zerr | Re | Rerr | Rerr |
|---|---|---|---|---|---|---|---|---|---|---|---|
| (J2000) | (J2000) | (mag) | (mag) | (mag) | (mag) | (mag) | (mag) | (pc) | (pc) | (pc) | |
| 137 | 40.0883 | 39.0554 | 24.199 | 0.090 | 22.952 | 0.109 | 1.246 | 0.141 | 0.37 | 1.01 | -0.37 |
| 138 | 40.1050 | 39.0574 | 23.087 | 0.048 | 22.125 | 0.072 | 0.961 | 0.086 | 0.39 | 0.79 | -0.32 |
| 139 | 40.1041 | 39.0668 | 22.687 | 0.073 | 21.462 | 0.100 | 1.224 | 0.124 | 0.40 | 0.35 | -0.40 |
| .. | .. | .. | .. | .. | .. | .. | .. | .. | .. | .. | .. |
Notes: Star cluster ID, Coordinates, g mag and error, z mag and error, g–z colour and error, effective radius and errors.
3 Results and Discussion
After applying the selection criteria described above, we show in Figure 1 the z magnitude, g–z colour and effective radius in parsecs (assuming the objects are associated with NGC 1023, i.e. at a distance of 11.1 Mpc).
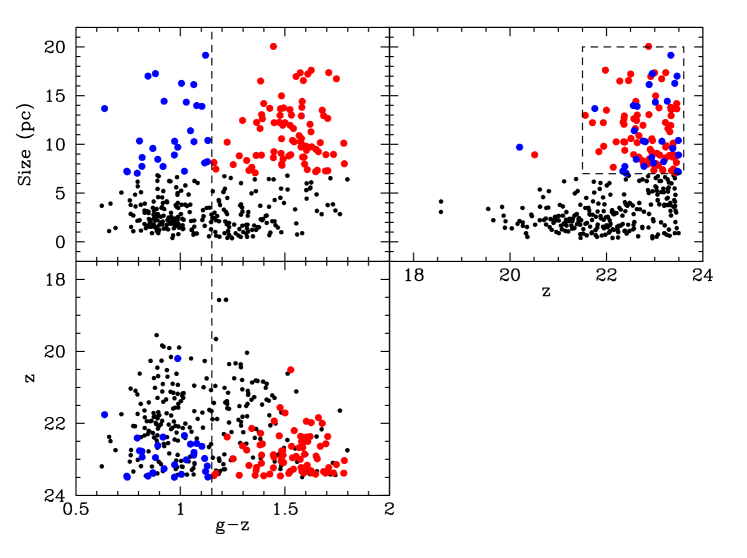
The size-magnitude diagram shows a locus of objects with Re 3 pc - these are globular cluster (GC) candidates. They include two bright objects (IDs 33 and 269 with z 18.5, Mz –11.73) that therefore have relatively high surface densities. In the case of object 269 it has a size of Re = 4.1 pc and appears quite elongated. Both have spectra previously obtained from the Keck telescope (Cortesi et al. 2014, in prep.) confirming their association with NGC 1023, thus they appear to be very luminous GCs. The object 269 has been studied in detail by Larsen (2001) from HST/WFPC2 data. He measures the same size as we do and quotes an ellipticity of 0.37. He notes that it is somewhat more compact than Omega Cen in the Milky Way but similar in density to G1 in M31. The similarities with Omega Cen and G1 suggest that 33 and 269 may both be the compact nuclei of a stripped dwarf galaxy. We also note two relatively bright objects (IDs 102 and 315 with z 20.3, Mz –9.7) with large sizes (Re 10 pc) that resemble low luminosity ultra compact dwarfs (UCDs; see Forbes et al. 2013). The blue UCD (g–z = 0.99; ID: 102) has been confirmed with Keck spectroscopy (Cortesi et al. 2014, in prep.) to be associated with NGC 1023. At faint magnitudes (z 21.5) a number of objects have sizes 7 pc, i.e. FFs by the definition of Larsen & Brodie (2000). Using this selection we find 109 FF candidates, 16 of which are in common with the original WFPC2 V and I band study of Larsen & Brodie (2000). Larsen & Brodie found that the red FFs do not have the standard Gaussian luminosity function of GCs, but rather continued to grow in number down to their magnitude limit of V 24. We find a similar behaviour for both the red and blue FFs, From the study of a large sample of extended clusters (Re 10 pc), Bruens & Kroupa (2012) found that the peak or turnover magnitude in early-type (i.e. both elliptical and lenticular) galaxies occurred around MV = –6.4. If FFs have a similar turnover magnitude (i.e. V 23.8 at the distance of NGC 1023), then our data have reached the peak of the luminosity function of the FFs.
In the colour-magnitude diagram one can see the clear bimodality of the two GC subpopulations, and at fainter magnitudes the FF candidates. A simple colour cut between the blue and red GC subpopulations at g–z = 1.15 is assigned. This corresponds to [Z/H] –0.6 (Usher et al. (2012), and hence [Fe/H] –0.9. With this colour cut we find 81 red FFs and 27 blue FF candidates (including 2 previously identified by Larsen & Brodie 2000). This diagram also shows the location of the two UCDs and the two high density GCs with intermediate colours.
The third panel shows the size-colour distribution. The FFs lie above the GCs in this panel with a similar distribution in g–z colour (although the colour cut for the FFs could be redder by 0.05 mag. than for the GCs). Red FFs clearly outnumber the blue FFs (81 vs 27). Here we have followed the size cut of Larsen & Brodie (2000), i.e. at 7 pc. However, our selected star clusters hint at three size regimes, i.e. normal GCs with Re 3 pc, objects with sizes 3 Re 12 pc, and those with Re 12 pc (for the blue objects this may be Re 14 pc). Larger numbers of objects are needed to verify if this visual impression represents different types of star cluster.
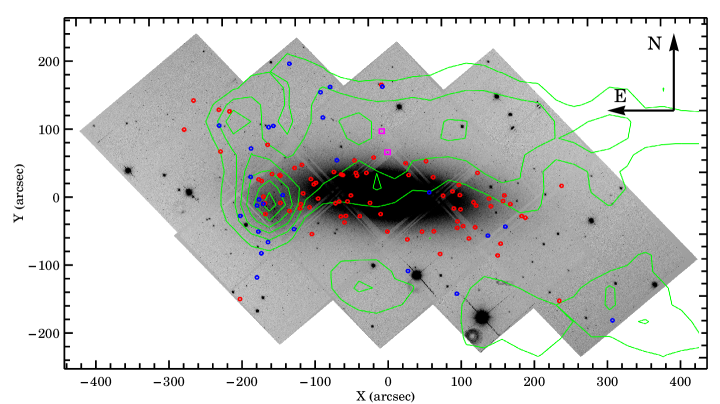
In Figure 2 we show the HST/ACS mosaic of NGC 1023, with the location of the blue and red FFs, the two UCDs and the HI gas distribution (from Morganti et al. 2006). Confirming previous works, the red FFs have a distribution similar to that of the underlying stellar disk. The blue FFs do not follow the disk of NGC 1023. About half of them lie near NGC 1023A, while most of the others are coincident with the densest HI gas.
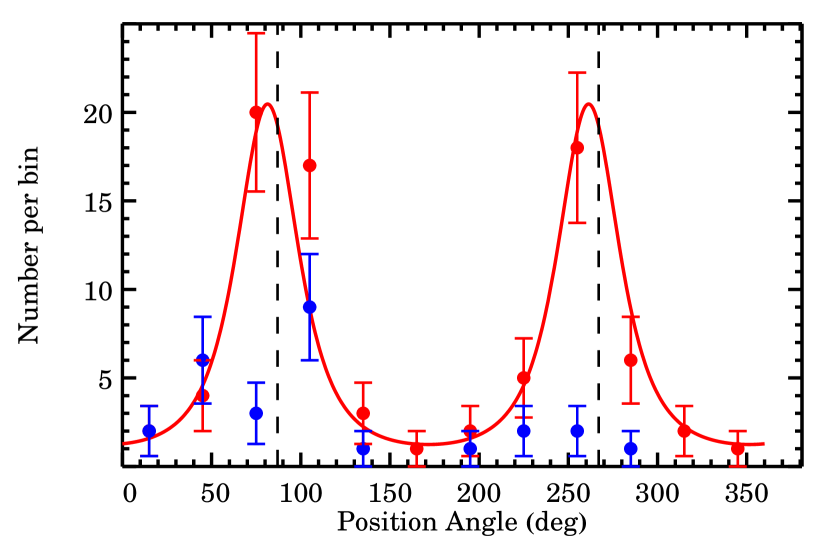
By fitting a simple model (i.e. equation 5 of Kartha et al. 2014) for both the average ellipticity and position angle simultaneously to the spatial distribution of red FFs, we find PA = 82 3 degrees and b/a = 0.4 0.2. The stellar disk of NGC 1023 has an ellipticity of b/a = 0.26 and PA of 85 degrees from a disk-bulge decomposition by Cortesi et al. (2013). This supports the impression by eye in Figure 2, and confirms the findings of Larsen & Brodie (2000), that red FFs are indeed associated with the disk of NGC 1023. In Figure 3 we show the azimuthal distribution of the red and blue FFs, with the red FFs peaking at the same PA as the galaxy major axis, while the blue FFs peak at PA 110 degrees which is the direction of NGC 1023A (while the distribution of other blue FFs shows no clear peak in position angle).
The 27 blue and 81 red FFs have mean colours of g–z = 0.95 0.03 and 1.52 0.01 respectively. In Figure 4 we show the mean colour of the blue and red FFs compared to the single stellar population models of Maraston (2005) with a Kroupa (2001) IMF. The red FFs have colours associated with a metal-rich stellar population as expected if they formed from disk material. From Keck spectra the red FFs are known to be metal-rich and old (Larsen & Brodie 2002), which is consistent with Figure 4.
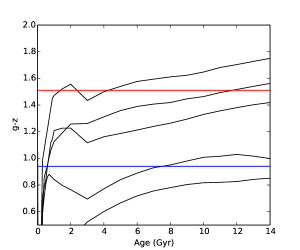
The blue FFs are consistent with being very young ( Gyr). Half of the blue FFs appear to be associated with NGC 1023A, which is thought to have interacted with NGC 1023 a few 100 Myr ago and is responsible for the 109 M⊙ of surrounding HI (Capaccioli et al. 1986). Spectroscopy of two blue NGC 1023A star clusters have ages up to 500 Myrs (Larsen & Brodie 2002), consistent with them forming during the interaction process. As the HI gas is widely distributed around the NGC 1023 system the blue FFs not coincident with NGC 1023A may also be a few 100 Myrs old – followup spectroscopy is required. Thus blue FFs may be the lower mass counterparts to tidal dwarf galaxies, forming out of the tidal debris of a past galaxy interaction.
4 Conclusions
Using a recently-available mosaic of eight HST/ACS pointings in g and z bands, we investigate the star cluster system of NGC 1023 measuring magnitudes, colours and effective radii. We identify the normal globular cluster (GCs) system of NGC 1023 with its red and blue subpopulations, and two particularly luminous and therefore dense GCs. Two ultra compact dwarf objects with effective radii 10 pc are also found. In this Letter, we focus on the faint, extended (effective radii 7 pc) clusters called Faint Fuzzies (FFs). Such objects were originally discovered in NGC 1023 by Larsen & Brodie (2000) using two HST/WFPC2 pointings. With our more complete spatial coverage, we confirm the association of some 81 red FFs with the disk of NGC 1023 consistent with them being long-lived open clusters (albeit somewhat larger and more luminous than typical Milky Way open clusters). We also identify a population of 27 blue FFs, half of which appear to be associated with the dwarf satellite galaxy NGC 1023A (which was largely absent from the original HST/WFPC2 coverage). The others appear to be spatially coincident with the HI gas that surrounds the NGC 1023 system. The blue FFs are consistent with young (few 100 Myrs) star clusters that formed during the interaction between the two galaxies.
5 Acknowledgements
We thank A. Cortesi, A. Chies-Santos and S. Larsen for useful comments. We also the referee for some useful comments. Based on observations made with the NASA/ESA Hubble Space Telescope, obtained from the data archive at the Space Telescope Science Institute. STScI is operated by the Association of Universities for Research in Astronomy, Inc. under NASA contract NAS 5-26555. DAF thanks the ARC for financial support via DP130100388.
6 References
Bertin, E., Arnouts, S., 1996, A&AS, 117, 393
Brodie J. P., Romanowsky A. J., Strader J., Forbes D. A., 2011, AJ, 142,
199
Brüns R. C., Kroupa P., Fellhauer M., 2009, ApJ, 702, 1268
Brüns R. C., Kroupa P., 2012, A&A, 547, A65
Burkert A., Brodie J., Larsen S., 2005, ApJ, 628, 231
Capaccioli M., Lorenz H., Afanasjev V. L., 1986, A&A, 169, 54
Chies-Santos A. L., Santiago B. X., Pastoriza M. G., 2007, A&A, 467, 1003
Chies-Santos A. L., Cortesi A., Fantin D. S. M., Merrifield
M. R., Bamford S., Serra P., 2013, A&A, 559, A67
Cortesi A., et al., 2013, MNRAS, 432, 1010
Forbes D. A., Pota V., Usher C., Strader J., Romanowsky A. J., Brodie
J. P., Arnold J. A., Spitler L. R., 2013, MNRAS, 435, L6
Kartha S. S., Forbes D. A., Spitler L. R., Romanowsky A. J., Arnold J. A.,
Brodie J. P., 2014, MNRAS, 437, 273
Kroupa P., 2001, MNRAS, 322, 231
Larsen S. S., 1999, A&AS, 139, 393
Larsen S. S., 2001, AJ, 122, 1782
Larsen S. S., Brodie J. P., 2000, AJ, 120, 2938
Larsen S. S., Brodie J. P., 2002, AJ, 123, 1488
Maraston C., 2005, MNRAS, 362, 799
Morganti R., et al., 2006, MNRAS, 371, 157
Peng E. W., et al., 2006, ApJ, 639, 838
Schlafly E. F., Finkbeiner D. P., 2011, ApJ, 737, 103
Sirianni M., et al., 2005, PASP, 117, 1049
Usher C., et al., 2012, MNRAS, 426, 1475
Usher C., Forbes D. A., Spitler L. R., Brodie J. P., Romanowsky A. J.,
Strader J., Woodley K. A., 2013, MNRAS, 436, 1172