Relationship between promoter sequence and its strength in gene expression
Abstract
Promoter strength, or activity, is important in genetic engineering and synthetic biology. Evidences show that a constitutive promoter with certain strength for one given RNA can often be reused for other RNAs. Therefore, the strength of one promoter is mainly determined by its nucleotide sequence. One of the main difficulties in genetic engineering and synthetic biology is how to control the expression of certain protein in one given level. One usually used way to achieve this goal is to choose one promoter with suitable strength, which can be employed to regulate the rate of transcription and then leads to needed level of protein expression. For this purpose, so far, many promoter libraries have been established experimentally. However, theoretical methods to predict the strength of one promoter from its nucleotide sequence are desirable. Since such methods are not only valuable in the design of promoter with specified strength, but also meaningful to understand the mechanism of promoter in gene transcription. In this study, through various tests one theoretical model is presented to describe the relationship between promoter strength and its nucleotide sequence. Our analysis shows that, promoter strength is greatly influenced by nucleotide groups with three adjacent nucleotides in its sequence. Meanwhile, nucleotides in different regions of promoter sequence have different effects on promoter strength. Based on experimental data for E. coli promoters, our calculations indicate, nucleotides in -10 region, -35 region, and the discriminator region of promoter sequence are more important than those in spacing region for determining promoter strength. With model parameter values obtained by fitting to experimental data, four promoter libraries are theoretically built for the corresponding experimental environments under which data for promoter strength in gene expression has been measured previously.
I Introduction
In cells, a small variety of expression of some protein may influence cell metabolism seriously. In synthetic biology, many models have been presented to describe the metabolic network Kitano (2002); Yeang and Vingron (2006). According to these models, it often needs to express a certain kind of protein (especially enzyme) in a specific intensity. One of the widely used ways to do this is to adjust the nucleotide sequence of the corresponding promoter Jensen and Hammer (1998a); Mijakovic et al. (2005); Sanchez et al. (2011); Mutalik et al. (2013).
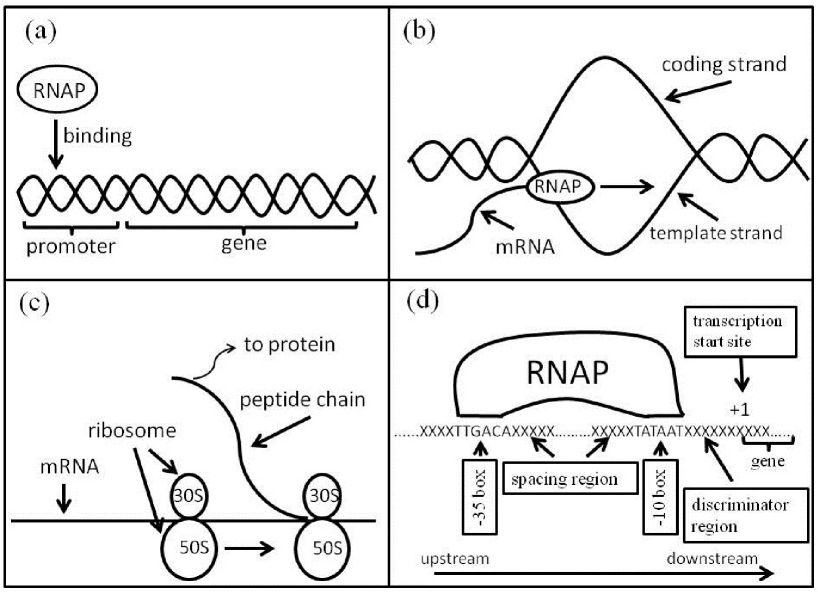
A promoter is a region of DNA that initiates transcription of a particular gene Yasuo and Naoto (2004); E.Mulligan et al. , see Fig. 1. In gene expression, the genetic information coded in nucleotide sequence of DNA should be firstly transcribed into message RNA (mRNA), which is performed by enzyme RNA polymerase (RNAP) Gross et al. (1996); Dehaseth et al. (1998). Usually, the transcription process begins with the binding of RNAP to one specific upstream region of the target gene, which is called promoter Mishra and Chatterji (1993); Campbell et al. (2002). Experiments show that, with different promoters, the protein production rates, or the strengths of gene expression, will be different Jensen and Hammer (1998a); Lu et al. (2012); Mutalik et al. (2013). Therefore, the rate of gene transcription to mRNA is regulated by the nucleotide sequence of promoter (for simplicity, in this study, promoters are assumed to be constitutive, i.e. transcription rate of the corresponding downstream gene is not influenced by transcription factors, for related discussions about translation factors one can see Bintu et al. (2005); Kinney et al. (2010)). Due to the requirement of genetic engineering and synthetic biology, the production rates of certain proteins, especially some enzymes, should be regulated detailedly. One of the ways to attain this aim is to choose specific promoter sequence to get needed rate of transcription (another efficient way is to choose specific ribosome binding site sequence, i.e. RBS sequence, to regulate the rate of translation Salis et al. (2009); Mutalik et al. (2013)).
In order to achieve this goal, many promoter libraries corresponding to large-scale strength of gene expression have been built experimentally Jensen and Hammer (1998a); Mey et al. (2007); Alper et al. (2005); Jensen and Hammer (1998b); Rud et al. (2006); Solem and Jensen (2002); Rhodius et al. (2012); Lu et al. (2012); Wu et al. (2013). Since it has been experimentally verified that the activity of a promoter can be reused among different kinds of proteins Alper et al. (2005); Mutalik et al. (2013); Cox et al. (2007); Hook-Barnard and Hinton (2007), these promoter libraries are valuable to the regulations of metabolic networks involving many different kinds of proteins. The establish of promoter libraries is of great important to the development of synthetic biology. However, reliable mathematical models to describe the relationship between promoter strength and its nucleotide sequence are much desirable. Since such models can not only reduce the experimental expense in building further promoter libraries, but also can help us to understand the mechanism of promoter during gene transcription. More importantly, such models will make it easier to get needed promoter with specific expression strength, and then will be valuable in genetic engineering and synthetic biology.
In the last twenty years, many studies have been done to build quantitative relationship between promoter strength in gene expression and its nucleotide sequence. It has been discovered early that, in E. coli promoters, the -10 region hexamer and -35 region hexamer are strongly conserved, and they are much important for determining the expression strength of promoter Hawley and McClure (1983); Dehaseth et al. (1998); Djordjevic (2011). But recent experimental data shows that promoter strength also depends on nucleotide types in the spacing region of promoter sequence Wu et al. (2013), and may also depend on the discriminator region. Where spacing region is the promoter sequence region between the most conserved -10 region and -35 region, and discriminator region is the sequence region between the -10 region and transcription start site, see Fig. 1(d). Therefore, it becomes much difficult to build reasonable theoretical models to describe the relationship between promoter sequence and its strength, since there may be too many factors or variables which may affect the promoter strength.
In Rhodius and Mutalik (2010), one modular position weight matrix model is presented to evaluate the contribution of promoter sequence to its strength. Where promoter score, which correlates with protein-DNA binding energy and consequently correlates with promoter strength, is obtained as one linear combination of scores for each active promoter sequence modular and an additional penalty term for nonoptimal modular, with the sequence modular scores obtained by basic principles of statistical physics. Similar idea has also been used in E.Mulligan et al. ; Berg and von Hippel (1987a) to try to understand the promoter strength from its nucleotide sequence. Meanwhile, in Kinney et al. (2010), based on a large number of experimental data for strengths and sequences of E. coli lac promoters, an adapted energy matrix for RNAP binding to promoter is statistically determined. Based on this energy matrix, one thermodynamic model is designed in Brewster et al. (2012) to predict promoter strength from its nucleotide sequence. On the other hand, by using support vector regression method and the distribution of specific nucleotides at each position of promoter sequence, which is obtained in Hawley and McClure (1983) and based on 168 E. coli promoter sequences, one strength prediction skill of E. coli promoter from microarray data is provided in Kiryu et al. (2005). They found that several non-consensus nucleotides in the -10 region and -35 region of promoter sequences act positively on the promoter strength, while certain consensus nucleotides have only a minor effect on the strength.
Although many related studies have shown that the consensus sequences (-35 and -10 regions) are most essential to determine the strength of promoter Cheetham et al. (1999); Buc and McCluret (1985); Ross et al. (1993); Jensen and Hammer (1998b), and actually for the sake of simplicity most of the existing models are based on such assumption, recent experimental data for promoter strength obtained by Wang’s study group in Wu et al. (2013) indicates that nucleotide types in spacing region of promoter sequence are also not neglectable. With different spacing sequences but keeping -10 region and -35 region unchanged, the expression strength of promoter may vary between 31 and 105 (in unit relative intensity of red fluorescent per OD600, i.e. RIRF/OD600). For simplicity, this study assumes that gene transcription will initiate as soon as one RNAP binds to its upstream promoter, and the nucleotide sequence of gene is not too long. Then for low concentration of RNAP, which assures that the elongation of mRNA (i.e. the motion of RNAP along DNA) will not be jammed Zhang (2012); Fange et al. (2014), the transcription rate will mainly be determined by the binding rate of RNAP to promoter. Biophysically, RNAP binding rate to promoter can be roughly written as . Where is one rate constant which depends on RNAP concentration and other experimental environments, is Boltzmann constant, is the absolute temperature, and is the free energy barrier of RNAP binding to promoter which is mainly determined by the promoter sequence. Generally, the energy barrier may depend on the secondary structure of promoter, and may also depend on the concentrations of transcription factors for nonconstitutive promoters. But this study assumes that can be completely determined by the nucleotide sequence of promoter, and the main focus in the following is to find one reasonable method to get energy barrier from the nucleotide sequence of promoter.
One immediate idea to get energy barrier is to assume that can be approximated by one linear combination of energy barriers contributed by each nucleotide in the promoter sequence. Here is the index of position of nucleotide in promoter sequence. This idea is similar as the ones previously used in E.Mulligan et al. ; Berg and von Hippel (1987a); Djordjevic and Bundschuh (2008); Rhodius and Mutalik (2010). The main difference between the idea here and the previous ones is as follows. In the previous methods, such as the one used in the modular position weight matrix model in Rhodius and Mutalik (2010), is assumed to be determined only by some so called active modules, including -35 region, -10 region, discriminator region, transcription start region, and the contribution from other suboptimal regions is only included as one penalty term which depends only on their lengths of nucleotide sequences. As have been mentioned previously, recent experimental data presented in Wu et al. (2013) indicates promoter strength also changes with the nucleotide types in spacing region. So we need to calculate the energy barrier contribution from nucleotide in any position of promoter sequence. There are several possible ways to get , which base more or less on basic principles of statistical physics Berg and von Hippel (1987b); Stormo (1990); Rhodius and Mutalik (2010). For example, the energy barrier contribution of one nucleotide at position with type ( or ) can be obtained as Rhodius and Mutalik (2010). Where is the number of nucleotide at position in the aligned sequences, is the total number of promoter, and is the theoretical probability of finding each type of nucleotide (usually is used), and 0.005 and 0.02 are just two other model parameter values. Such method may be theoretically sound, but our calculations indicate it is not reasonably good to describe the experimental data of promoters in Wu et al. (2013).
If the types of nucleotide at different positions of promoter sequence are independent to each other, then due to principles of statistical physics, the probability that there is one base at position is related to the free energy by . By replacing probability with frequency , we then get . Where the frequency is obtained from the 168 promoters of E. coli compiled in Hawley and McClure (1983). The total energy barrier for one given promoter sequence can then be obtained by , with the nucleotide at position . However, this model can not fit to the recent experimental data presented in Wu et al. (2013) well, see Fig. S1(a) in Supplemental Material supplemental .
In recent paper Kinney et al. (2010), based on experimental data of E. coli lac promoters, one parameter matrix is built, which is used to describe the interaction of RNAP with promoter region from position -1 to position -75. Where the matrix element represents the contribution to this interaction from having a base at position in the promoter sequence. Using this parameter matrix , the total energy barrier for RNAP binding to one promoter can be known, and so the corresponding expression strength can be obtained. This parameter matrix has been employed by Brewster et al. in Brewster et al. (2012) to build one theoretical model to predict the strength of promoter, and its accuracy has been validated in the design of promoter with specific strength. However, our test shows that such method is not satisfying when it is employed to describe the recent experimental data presented in Wu et al. (2013), see Fig. S1(b) in Supplemental Material supplemental .
One common characteristic of the three methods discussed above is that, the energy barrier of RNAP binding to promoter is assumed to be one linear combination of energy barriers contributed by each nucleotide in promoter sequence. The failures of these methods in describing the recent experimental data presented in Wu et al. (2013) implie that this assumption of independence and additivity of energy barriers may not be generally true, though it may be approximately reasonable in some special cases and has been validated previously for transcription factor binding sites of promoter Benos et al. (2002). Therefore, this assumption needs to be modified to be more reasonable. One immediate way to do this is to assume that the energy barrier of RNAP binding to promoter is one linear combination of the ones contributed by all nearest-neighbor (NN) nucleotide groups in promoter sequence. For convenience, this study assumes that the energy barrier contributed by one NN nucleotide group is equal to the energy obtained by NN model in the study field of nucleic acids John SantaLucia (1998). Which has actually been used in some software packages, such as NUPACK Zadeh et al. (2011), to calculate the folding free energy of nucleic acid sequence to determine its secondary structure. In NN model, the total energy of one given nucleic acid sequence is obtained as the summation of energies contributed by each NN nucleotide groups, and one additional term according to the initial nucleotide, see the corresponding values listed in Fig. S1(d) supplemental . For example, the energy of sequence CGTTGA at temperature 37oC is obtained as (excerpted from Ref. John SantaLucia (1998)). With one additional parameter to indicate the average level of experimental environments, the fitting results of this model are plotted in Fig. S1(c) supplemental . Unfortunately, this model is also not satisfactory.
The failure of the above NN method to predict promoter strength, i.e. the failure in calculating energy barrier of RNAP binding to promoter, may due to following two reasons. (1) In the NN method, no difference is included among energy contributions from nucleotide groups in -10 region, -35 region, discriminator region, and spacing region. As mentioned above, previous studies have shown that the -10/35 region may be more important for determining promoter strength. So the nucleotide (group) in -10/-35 region should contribute more to the RNAP binding energy . (2) The energy barrier may also depend on large nucleotide groups, at least on nucleotide groups with three adjacent nucleotides. In the following, we will test new models which do not have at least one of the above two weaknesses.
Firstly, we test the model which includes nucleotide position explicitly, where the energy barrier of RNAP binding to promoter is assumed to be linear combination of and . Here is the energy barrier contributed by one nucleotide at position , and is the energy barrier contributed by one nearest-neighbor nucleotide group with nucleotide at position and nucleotide at position . For convenience, in the following, this model is called POSITION2 model. One main difficulty in such model is, compared with the known experimental data, there are too many model parameters. For example, if the promoter sequence comprises of 35 nucleotides, then there will be model parameters. To avoid the overfitting problem, we used the partial least squares (PLS) regression to get parameter values. Where the principal component number, i.e. the number of independent model parameters, is chosen by 10-fold cross-validation. With the chosen principal component number, both the mean residual of all promoter strength between measured values and theoretical values, and the mean residual in 10-fold cross-validation are reasonably low, see Fig. S2(a,b) in Supplemental Material supplemental . In this study, the experimental data includes a total of 422 promoters, with their nucleotide sequences and strengths presented in Refs. Lu et al. (2012); Wu et al. (2013); Mutalik et al. (2013) respectively. Due to the different experimental environments used in measuring promoter strengths, including temperature, RNAP type and concentration, and lots of other conditions in transcription and translation processes, in this model as well as other models used in the study, extra constants are added to total energy barrier to stand for these differences. For experimental data from different references, these extra constants will be different, and their values are also obtained by PLS regression. Meanwhile, to know if there are real differences between the energy barrier contributions from nucleotides in -10 region, -35 region, discriminator region, and spacing region, another extra constant is added to distinguish the length of promoter spacing region. The possible lengths of spacing region in the experimental data used in this study are 16, 17 and 18. With seven principal components, the fitting results of the POSITION2 model are presented in Fig. S2(c) supplemental . Where the mean residual between the experimental data and theoretical values is around 61 (in arbitrary unit), see Fig. S2(a) in Supplemental Material supplemental . From the model coefficient values plotted in Fig. S2(d,e,f) supplemental , one can see that the contributions to total energy barrier from -10 region, -35 region, and discriminator region are larger than those from the spacing region for promoters with any length of spacing region. Here the model coefficients are obtained by an inverse transform from the values of the seven principal components.
One may argue that one of the reasons that the above NN model is not good enough to describe the relationship between promoter strength and sequence is that, the values of given by Ref. John SantaLucia (1998) for energy barrier contribution from nearest-neighbor nucleotide group may not be accurate enough (see also the values listed in Fig. S1(d) in Supplemental Material supplemental ), or they may not be generally right for any nucleic acid sequence. In order to exclude this reason, we have tested one generalized model, called GROUP2 model, in which the energy barrier of RNAP binding is assumed to be one linear combination of and . Different with the above NN model, and here are obtained by PLS regression. However, from the plots in Fig. S2(a,b) supplemental , one can see that the GROUP2 model is actually less accurate than the above POSITION2 model.
As mentioned previously, another possible reason for the failure of NN model to describe the relationship between promoter sequence and strength is that, the promoter strength may also depend on large nucleotide groups (with at least three adjacent nucleotides), but not only on independent nucleotides and nucleotide groups with two neighboring nucleotides. We may need to point out that, models with nucleotide groups of size only 3 implicitly include the cases of size 1 and 2. But, for the sake of comparison of contributions to the total energy barrier of RNAP binding to promoter, from nucleotide groups with different sizes, our model includes all possible nucleotide groups with size 1, 2, and 3. For convenience, such model is called GROUP3 model. In GROUP3 model, there are also too many unknown model parameters which need to be fitted from experimental data, altogether . Therefore, PLS regression is also used in the data fitting process to determine model parameter values, in which the principal component number (i.e. the number of independent model parameters) is determined by reducing both the mean residual between promoter strengths from experimental data and from theoretical model, and the mean residual of promoter strengths in 10-fold cross-validation, see Fig. S3(a,b) in Supplemental Material supplemental . With eight principal components, the fitting results are presented in Fig. S3(c) supplemental . From the model coefficient values plotted in Fig. S3(d) supplemental , one can see that contributions to total energy barrier of RNAP binding from nucleotide groups with three adjacent nucleotides are relatively larger than those from nucleotides or nucleotide groups with two neighboring nucleotides.
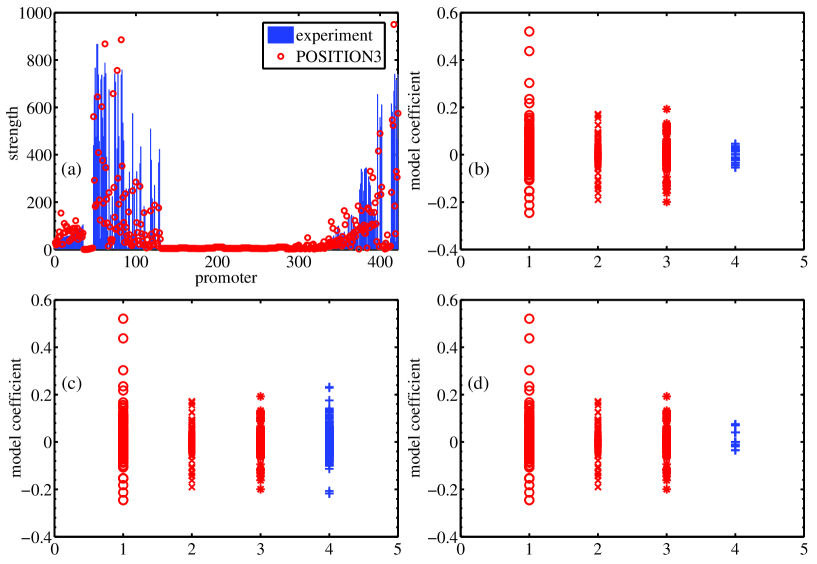
Based on the above two test models, the POSITION2 model and the GROUP3 model, we conclude that the energy barrier of RNAP binding to promoter depends on nucleotide groups with three adjacent nucleotides. Meanwhile, the contributions of nucleotide (groups) to from different regions of promoter sequence are different. Therefore, it seems more reasonable to use one combined model to describe the relationship between promoter strength and sequence, in which both nucleotide groups with size up to three and their positions in promoter sequence are explicitly considered. Undoubtedly, there will be too many unknown parameters in such combined models. For example, if each promoter has 35 nucleotides and there is no missing nucleotide in promoter sequence, the number of model parameters will be . Meanwhile, as mentioned previously, during data fitting extra parameters are also added due to the difference of length of promoter spacing region and the difference of experimental environment to measure promoter strength. Therefore, PLS regression should also be used to determine the values of model parameters. With reasonable low value of mean residual between theoretical model predictions and experimental data of promoter strengths, and mean residual of 10-fold cross-validation, the principal component number of this combined model is chosen to be seven, see Fig. S3(a,b) in Supplemental Material supplemental . With these seven principal components, the theoretical results of this combined model (for convenience, this model is called POSITION3 model) are plotted in Fig. 2(a). The mean residual between theoretical predictions and experimental measurements of promoter strengths is about 59 (in arbitrary unit), see Fig.S3(a). From the plots in Fig. 2(b,c,d), one can easily see that the nucleotide groups in -10 region, -35 region, and discriminator region have more effects on promoter strength. Meanwhile, the effects of nucleotide groups with three adjacent nucleotides are also nonnegligible, see Fig. S4 in Supplemental Material supplemental .
Using the POSITION3 model and genetic algorithm, four promoter libraries are calculated (see Fig. 3, and the Excel files in supplement materials for the corresponding promoter sequences), which correspond to the four experimental environments under which the data used in this study are obtained Lu et al. (2012); Wu et al. (2013); Mutalik et al. (2013). These libraries will be helpful for the synthesis of promoter with specific expression strength. Using the same methods, promoter libraries corresponding to any other experimental environments can also be theoretically built, but with one extra step during which the model constant corresponding to the given experimental environment should be determined firstly by initial promoter samples. Combining our model here for promoter strength with the calculation method for ribosome binding site sequence Salis et al. (2009); Mutalik et al. (2013), the gene expression, including transcription and translation, can be regulated to given strength detailedly.
In conclusion, in this study one theoretical model for describing the relationship between promoter strength and sequence is presented. Our study shows that the nucleotides in -10 region, -35 region, and the discriminator region have more effects on promoter strength than those in spacing region. Meanwhile, promoter strength depends more on nucleotide groups with three adjacent nucleotides than on single nucleotides and nucleotide groups with two neighboring nucleotides. Using our model, promoter libraries with wide range of expression strength are theoretically obtained.
Acknowledgements.
This study was supported by the Natural Science Foundation of China (Grant No. 11271083), and the National Basic Research Program of China (National “973” program, project No. 2011CBA00804).References
- Kitano (2002) H. Kitano, Science 295, 1662 (2002).
- Yeang and Vingron (2006) C.-H. Yeang and M. Vingron, BMC Bioinformatics 7, 332 (2006).
- Jensen and Hammer (1998a) P. R. Jensen and K. Hammer, Biotechnology and Bioengineering 58, 191 (1998a).
- Mijakovic et al. (2005) I. Mijakovic, D. Petranovic, and P. R. Jensen, Current Opinion in Biotechnology 16, 329 (2005).
- Sanchez et al. (2011) A. Sanchez, H. G. Garcia, D. Jones, R. Phillips, and J. Kondev, PLoS Computational Biology 7, e1001100 (2011).
- Mutalik et al. (2013) V. K. Mutalik, J. C. Guimaraes, G. Cambray, C. Lam, M. J. Christoffersen, Q.-A. Mai, A. B. Tran, M. Paull, J. D. Keasling, A. P. Arkin, et al., Nature methods 10, 354 (2013).
- Yasuo and Naoto (2004) M. Yasuo and K. Naoto, in Computational Systems Bioinformatics Conference (Institute of Electrical and Electronics Engineers, 2004), pp. 686–691.
- (8) M. E.Mulligan, D. K.Hawley, R. Entriken, and W. R.McClure Nucleic Acids Research 12, 789-800 (1984).
- Gross et al. (1996) C. A. Gross, C. L. Chan, and M. A. Lonetto, Phil. Trans. R. Soc. Lond. B 351, 475 (1996).
- Dehaseth et al. (1998) P. L. Dehaseth, M. L. Zupancic, , and M. T. R. Jr., Journal Of Bacteriology 180, 3019 (1998).
- Mishra and Chatterji (1993) R. K. Mishra and D. Chatterji, J. Biosci. 18, 1 (1993).
- Campbell et al. (2002) E. A. Campbell, O. Muzzin, M. Chlenov, J. L. Sun, C. A. Olson, O. Weinman, M. L. Trester-Zedlitz, , and S. A. Darst, Molecular Cell 9, 527 (2002).
- Lu et al. (2012) J. Lu, J. Tang, Y. Liu, X. Zhu, T. Zhang, and X. Zhang, Appl Microbiol Biotechnol 93, 2455 (2012).
- Bintu et al. (2005) L. Bintu, N. E. Buchler, H. G. Garcia, U. Gerland, T. Hwa, J. Kondev, and R. Phillips, Current opinion in genetics development 15, 116 (2005).
- Kinney et al. (2010) J. B. Kinney, A. Murugan, J. Curtis G. Callan, and E. C. Cox, Proc. Natl. Acad. Sci. USA 107, 9158 (2010).
- Salis et al. (2009) H. M. Salis, E. A. Mirsky, and C. A. Voigt, Nat. Biotechnol. 27, 946 (2009).
- Mey et al. (2007) M. D. Mey, J. Maertens, G. J. Lequeux, W. K. Soetaert, and E. J. Vandamme, BMC biotechnology 7, 34 (2007).
- Alper et al. (2005) H. Alper, C. Fischer, E. Nevoigt, and G. Stephanopoulos, Proc. Natl. Acad. Sci. USA 102, 12678 (2005).
- Jensen and Hammer (1998b) P. R. Jensen and K. Hammer, Applied and environmental microbiology 64, 82 (1998b).
- Rud et al. (2006) I. Rud, P. R. Jensen, K. Naterstad, and L. Axelsson, Microbiology 152, 1011 (2006).
- Solem and Jensen (2002) C. Solem and P. R. Jensen, Applied and environmental microbiology 68, 2397 (2002).
- Rhodius et al. (2012) V. A. Rhodius, V. K. Mutalik, and C. A. Gross, Nucleic Acids Research 40, 2907 (2012).
- Wu et al. (2013) Y. Wu, Y. Zhang, R. Tu, H. Liu, and Q. Wang, Chinese Journal of Biotechnology 29, 760 (2013).
- Cox et al. (2007) R. S. Cox, M. G. Surette, and M. B. Elowitz, Molecular Systems Biology 3, 145 (2007).
- Hook-Barnard and Hinton (2007) I. G. Hook-Barnard and D. M. Hinton, Gene Regulation and Systems Biology 1, 275 (2007).
- Hawley and McClure (1983) D. K. Hawley and W. R. McClure, Nucleic Acids Research 11, 2237 (1983).
- Djordjevic (2011) M. Djordjevic, Journal of Bacteriology 193, 6305 (2011).
- Rhodius and Mutalik (2010) V. A. Rhodius and V. K. Mutalik, Proc. Natl. Acad. Sci. USA 107, 2854 (2010).
- Berg and von Hippel (1987a) O. G. Berg and P. H. von Hippel, Journal of Molecular Biology 193, 723 (1987a).
- Brewster et al. (2012) R. C. Brewster, D. L. Jones, and R. Phillips, PLoS Computational Biology 8, 12 (2012).
- Kiryu et al. (2005) H. Kiryu, T. Oshima, and K. Asai, bioinformatics 21, 1062 (2005).
- Cheetham et al. (1999) G. M. T. Cheetham, D. Jeruzalmi, and T. A. Steitz, Nature 399, 80 (1999).
- Buc and McCluret (1985) H. Buc and W. R. McCluret, Biochemistry 24, 2712 (1985).
- Ross et al. (1993) W. Ross, K. K. Gosink, J. Salomon, K. Igarashi, C. Zou, A. Ishihama, K. Severinov, and R. L. Gourse, Science 262, 1407 (1993).
- Zhang (2012) Y. Zhang, Eur. Phys. J. E 35, 101 (2012).
- Fange et al. (2014) D. Fange, H. Mellenius, P. P. Dennis, and M. Ehrenberg, Biophysical Journal 106, 55 (2014).
- Djordjevic and Bundschuh (2008) M. Djordjevic and R. Bundschuh, Biophysical Journal 94, 4233 (2008).
- Berg and von Hippel (1987b) O. G. Berg and P. H. von Hippel, J. Mol. Biol. 193, 723 (1987b).
- Stormo (1990) G. D. Stormo, Methods Enzymol 183, 211 (1990).
- (40) The supplementary material including four figures is available at {URL to be provided}.
- Benos et al. (2002) P. V. Benos, M. L. Bulyk, and G. D. Stormo, Nucleic Acids Research 30, 4442 (2002).
- John SantaLucia (1998) J. John SantaLucia, Proc. Natl. Acad. Sci. USA 95, 1460 (1998).
- Zadeh et al. (2011) J. N. Zadeh, C. D. Steenberg, J. S. Bois, B. R. Wolfe, M. B. Pierce, A. R. Khan, R. M. Dirks, and N. A. Pierce, J. Comput. Chem. 32, 170 (2011).