We use the recently developed Differential Equation Model for the reduced electric quadrupole transition probability B(E2) for predicting its values for a wide range of even-even nuclides almost throughout the nuclear landscape from Neon to Californium. This is made possible as the principal equation in the model, namely, the differential equation connecting the B(E2) value of a given nucleus with its derivatives with respect to neutron and proton numbers provides two different recursion relations, each connecting three different neighboring even-even nuclei from lower to higher mass numbers and vice-verse. These relations helped us to extrapolate from known to unknown terrain of the B(E2) landscape and thereby facilitate its predictions throughout.
B(E2) PREDICTIONS FOR EVEN-EVEN NUCLEI IN THE DIFFERENTIAL EQUATION MODEL
This is a slightly modified version of the article submitted for publication in Atom. Data and Nucl. Data Tabl.(2014).
I INTRODUCTION
Reduced electric quadrupole transition probability B(E2) plays an important role for the study of nuclear structure, especially the deformation properties of nuclei. Such studies got a boost with the advent of isotope facilities providing a large amount of experimental data for several nuclides throughout the nuclear chart. The existence of a large volume of experimental data lead Raman et al. rmn at the Oak Ridge Nuclear Data Project rmn ; rm3 to make a comprehensive analysis of all those data in preparing the most sought-after experimentally adopted data table. Of late, Pritychenko et al. prt followed the process in compiling the newly emerging data sets for some even-even nuclei near 28. These new data including the old set obviously put a challenge for the nuclear theorists to understand them.
Theoretically, possible existence of nuclear symmetry in the properties of nuclei led Ross and Bhadurirbh in developing difference equations involving the B(E2) values of neighboring even-even nuclei. Patnaik et al. pat on the other hand have also succeeded in establishing even more simpler difference equations connecting these values of four neighboring even-even nuclei. Apart from these difference equations, there exists several nuclear models such as Single-Shell Asymptotic Nilson Model (SSANM) ssa and Finite-Range Droplet Model (FRDM) frd in predicting B(E2) values to some success.
Just recently, we have succeeded in developing dem a new model for B(E2) termed as the Differential Equation Model (DEM) according to which, the B(E2) value of a given nucleus is expressed in terms of its derivatives with respect to the neutron and proton numbers. In fact, we had already demonstrated frd its goodness in reproducing the known rmn B(E2) values throughout and also in predicting the unknown data of Pritychenko et al. prt with success. It is worth mentioning here, that we could visualize such a differential equation on the basis of a similar equation for an important component of the the ground-state energy of a nucleus, termed as the local energy of the recently developed Infinite Nuclear Matter (INM) model inm ; in2 ; in3 ; in5 ; rcn of atomic nuclei. More over, the -relation connecting the partial derivatives of the local energies in the INM model has been shown to be primarily responsible for the success in5 of the INM model as a mass-formula. The philosophy that any relation in the form of a differential equation is sound enough to possess a good predictive ability was well demonstrated in the INM model, specifically for the prediction in5 of nuclear masses throughout the nuclear chart. Since the local energy basically constitutes the shell and deformation energies, and has been shown rcn to carry also the shell structure of a given nucleus, is expected to have a good one-to-one correspondence with the properties of excited states, and in particular the reduced transition probabilities. All these aspects therefore lead us in formulating the Differential Equation Model dem for B(E2).
In the following Section 2, we briefly discuss the model and its salient features. Section 3 covers the scheme of B(E2) predictions throughout nuclear landscape and calculation of the associated uncertainties in them. In Section 4, we present all our DEM predictions along with the known experimentally adopted B(E2) data.
II THE DIFFERENTIAL EQUATION MODEL FOR B(E2)
The Differential Equation Model for B(E2) has been well described elsewheredem . Here we just highlight its salient features for sake of completeness and also to facilitate discussion of our predictions. The principal equation in the model termed as the DEM equation for B(E2) is given by
| (1) |
where Z, N and A are the usual proton, neutron and mass numbers of a given nucleus. as usual is the symmetry parameter (N-Z)/(N+Z). This DEM Eq. (1) as we see, connects the B(E2) value of a given nucleus (N,Z) with its partial derivatives with respect to neutron and proton numbers N and Z. In order to utilize the differential Eq. (1) for all practical purposes, we have used the usual forward and backward definitions of the two derivatives occurring in the equation as
| (3) |
Substitution of these definitions in the DEM equation (1), led us to obtain two different recursion relations in B(E2) connecting three neighboring even-even nuclei in (N,Z) space. These are
| (4) | |||||
| (5) |
We see that the first recursion relation (4) connects B(E2) values of the nuclei (N,Z), (N-2,Z) and (N,Z-2), while the second one (5) connects those of (N,Z), (N,Z+2) and (N+2,Z). It is also obvious to see that the first one relates B(E2) values of lower to higher mass nuclei while the second one relates higher to lower mass. Thus depending on the availability of data, one can use either or both of these two relations to obtain the corresponding unknown values of neighboring nuclei.
The validity of these equations at numerical level has been already demonstrateddem with the use of the experimental data set of Raman et al.rmn . More importantly, the goodness of the model predictions has been also showndem when compared with the latest experimental data set of Pritychenko et al.prt for all the isotopes of Cr, Fe, Ni and Zn.
III SCHEME OF B(E2) PREDICTIONS IN THE MODEL
Each of the two recursions relations (4) and (5) derived from the DEM Eq. (1) connects B(E2) values of three different neighboring nuclei as stated earlier. More importantly, each of these relations can be expressed in three different ways just by interchanging the three terms occurring in them from left to right and vice-verse. Thus altogether, these two relations in principle can act as six recursion relations as far as a particular nucleus is concerned, and consequently can generate up to six alternate values for the nucleus. Of course the exact number of alternate values for a given nucleus depends on the availability of the neighboring input data. Since each of these values is equally probable, the predicted value for a given nucleus is then obtained by the arithmetic mean of all those generated values so obtained.
Thus, following the procedure as laid down above, our scheme in the first step generates all possible B(E2) values of both known as well as the unknown neighboring even-even nuclides using the experimentally available data. These predictions so obtained in the first step may be termed as the first generation predictions. Then in the second step, these predictions along with the experimental data set are again used to obtain the second generation predictions. In principle, this scheme can be continued for all possible extrapolations. However in practice, this scheme cannot be continued for more number of extrapolations due to accumulation of errors in the predicted values. Accordingly one has to compromise in between the amount of error accumulation and the order of extrapolations.
It is desirable to calculate possible uncertainties or errors associated with the predictions of our model. Since the model basically uses the recursion relations involving the data points occurring in the right hand sides of the relations, the uncertainties associated with the predictions can be easily evaluated taking into account those of the data points following the usual error analysis procedure. Therefore to start with the predictions of the first generation, the experimental uncertainties of the input data points are taken into account in evaluating the corresponding associated errors. The same methodology is again followed for the subsequent extrapolations, taking into account the evaluated uncertainties of the previously generated DEM predictions along with those of the experimental data involved in the predictions. It is needless to say that errors associated with the predictions would obviously increase from generation to generation.
IV RESULTS AND DISCUSSIONS
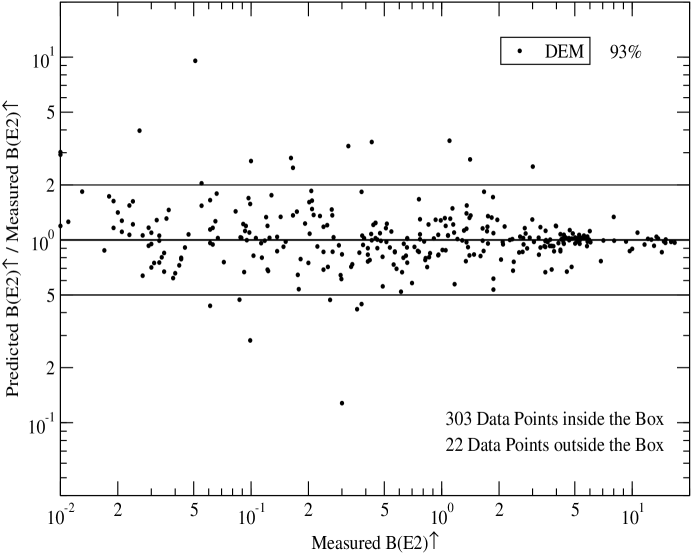
Following the scheme outlined in the previous section, we have evaluated the DEM predictions using the combined data set of Raman et al. rmn and Pritychenko et al. prt . It may be noted that Pritychenko et al. have recently compiled the adopted values for the isotopes of Cr, Fe, Ni and Zn using the latest experimental data. Therefore the old data set of Raman et al. rmn for these isotopes has been replaced by those of Pritychenko et al. prt . As a result, the combined data set comprises altogether 325 even-even nuclides spread over the nuclear landscape ranging from Ne to Cf ( Z=10 to 98). Our DEM predictions are also confined to all the possible even-even isotopes of the same isotope series with extrapolations up to almost 3 to 5 steps on either side of the known data base. Thus altogether, we have predicted the B(E2) values of another 251 nuclides going up to 3rd order of extrapolations. The DEM predictions along with the combined experimental data set where available, are presented in Table 1. For sake of analyzing the degree of agreement with experiment, we followed Raman et al. rmn in presenting our analysis in terms of the ratio of DEM values with those of the experiment in Fig. 1. As we can see from this figure, the percentage of agreement is 93% which is quite remarkable, and may be termed excellent as per the yardstick formulated by Raman et al. rmn . Accordingly, such excellent agreement of the DEM predictions with experiment obviously commands confidence in our other predictions given in Table 1.
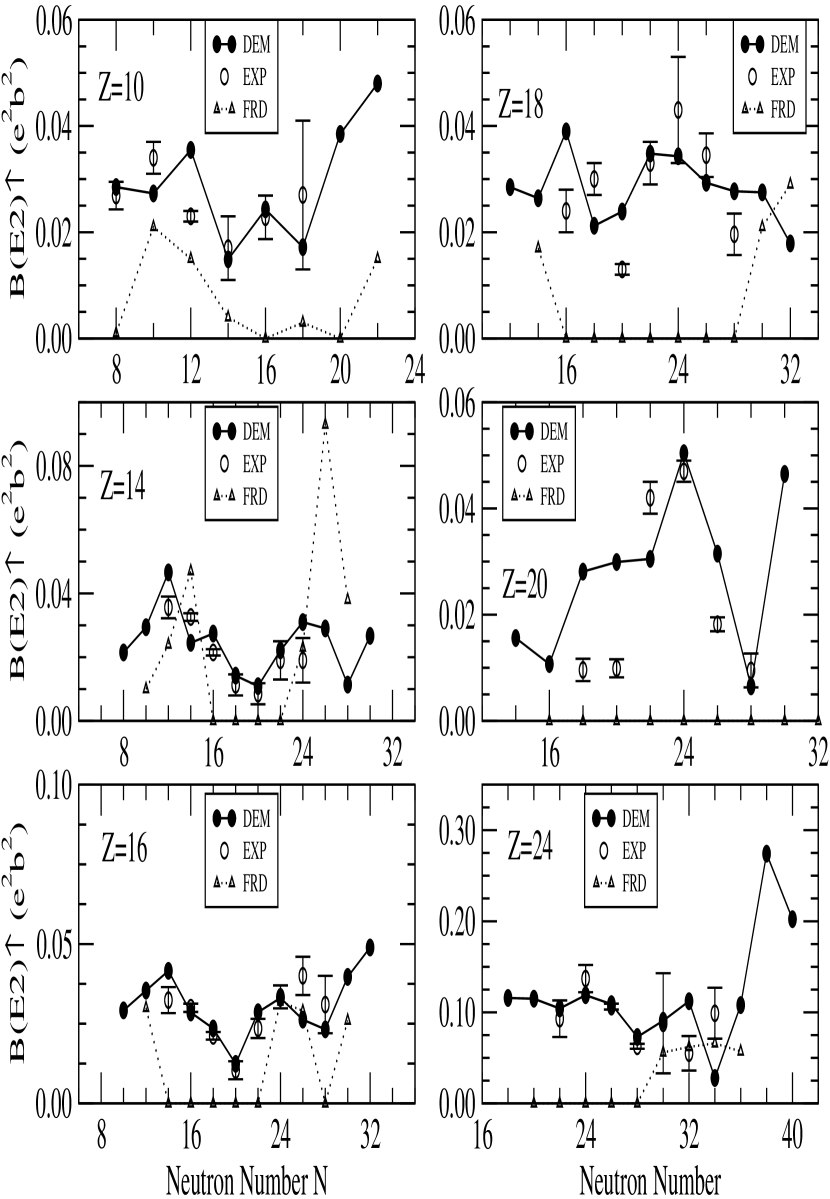
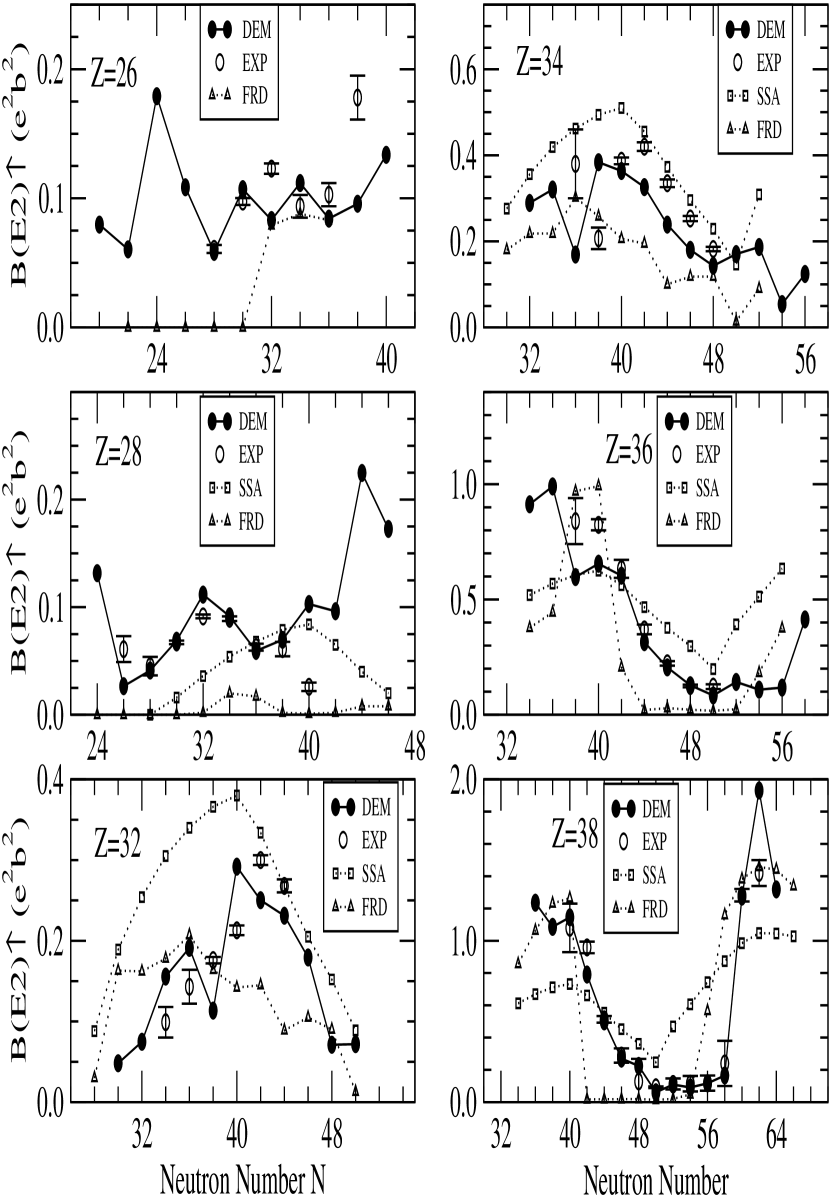
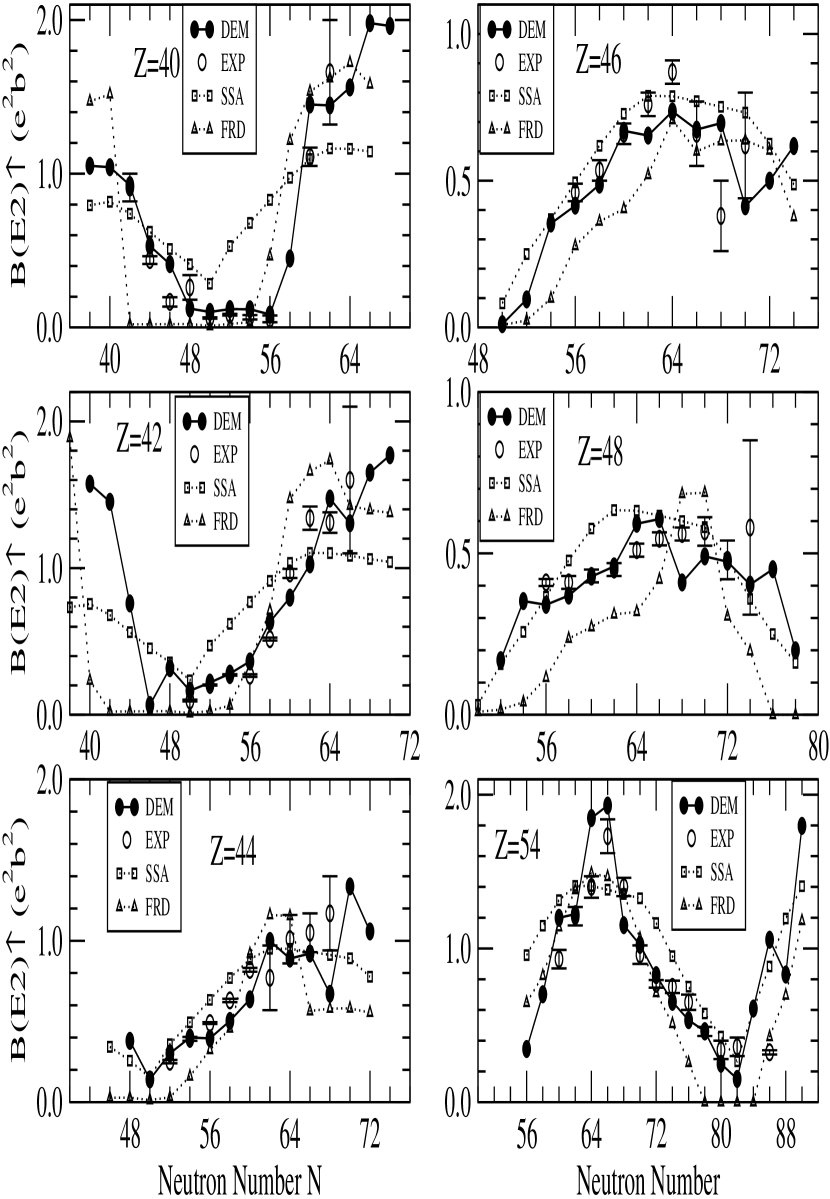
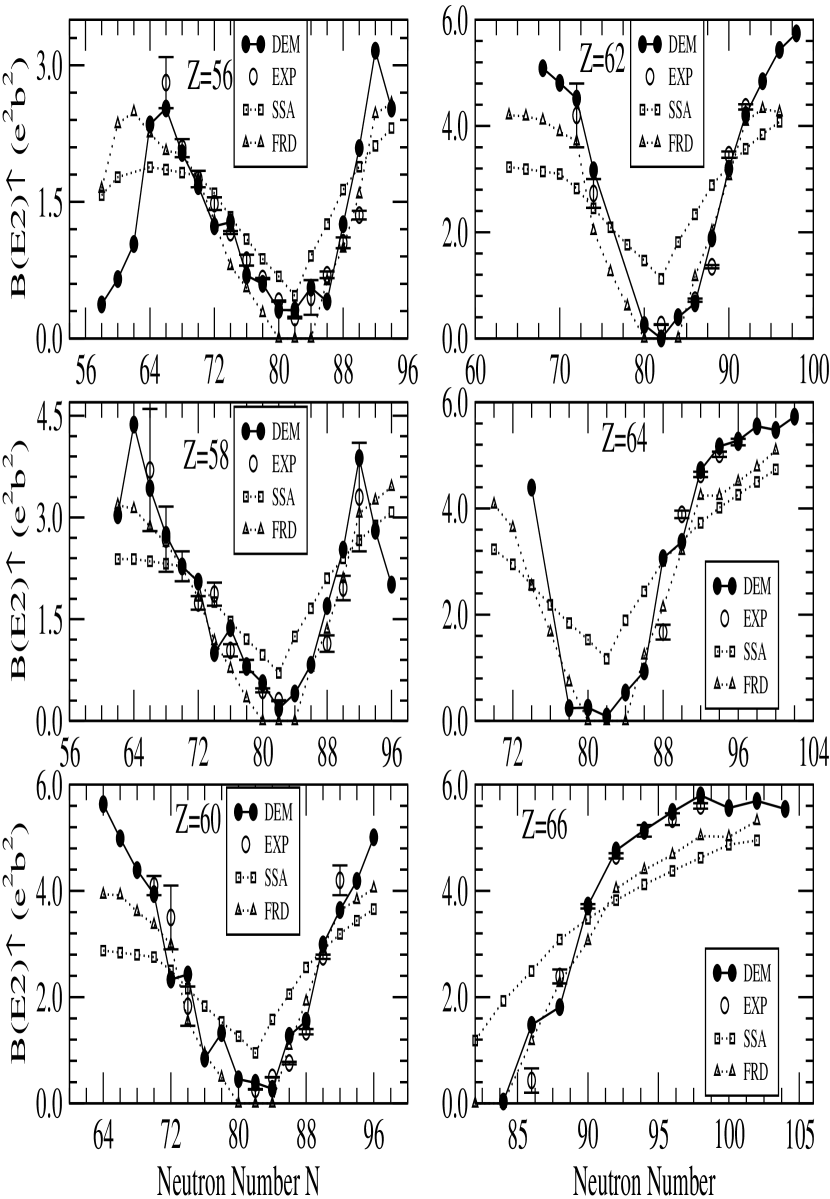
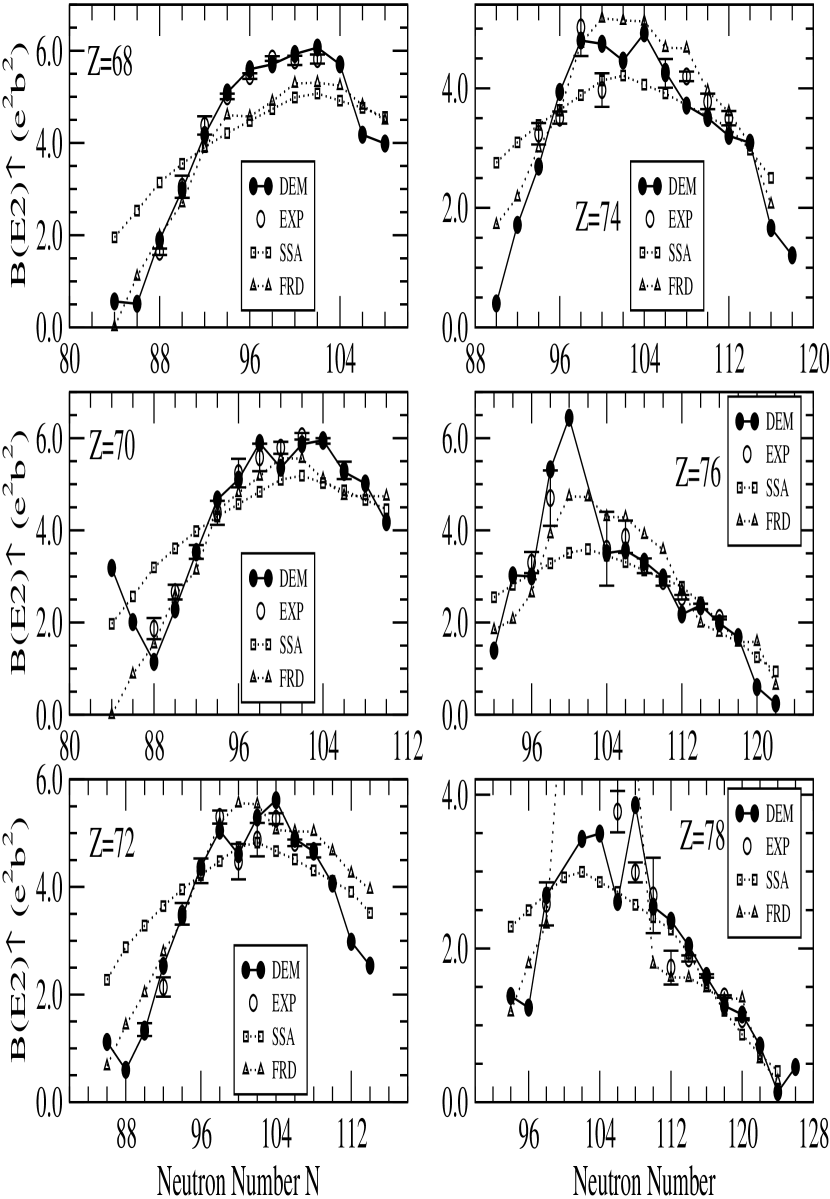
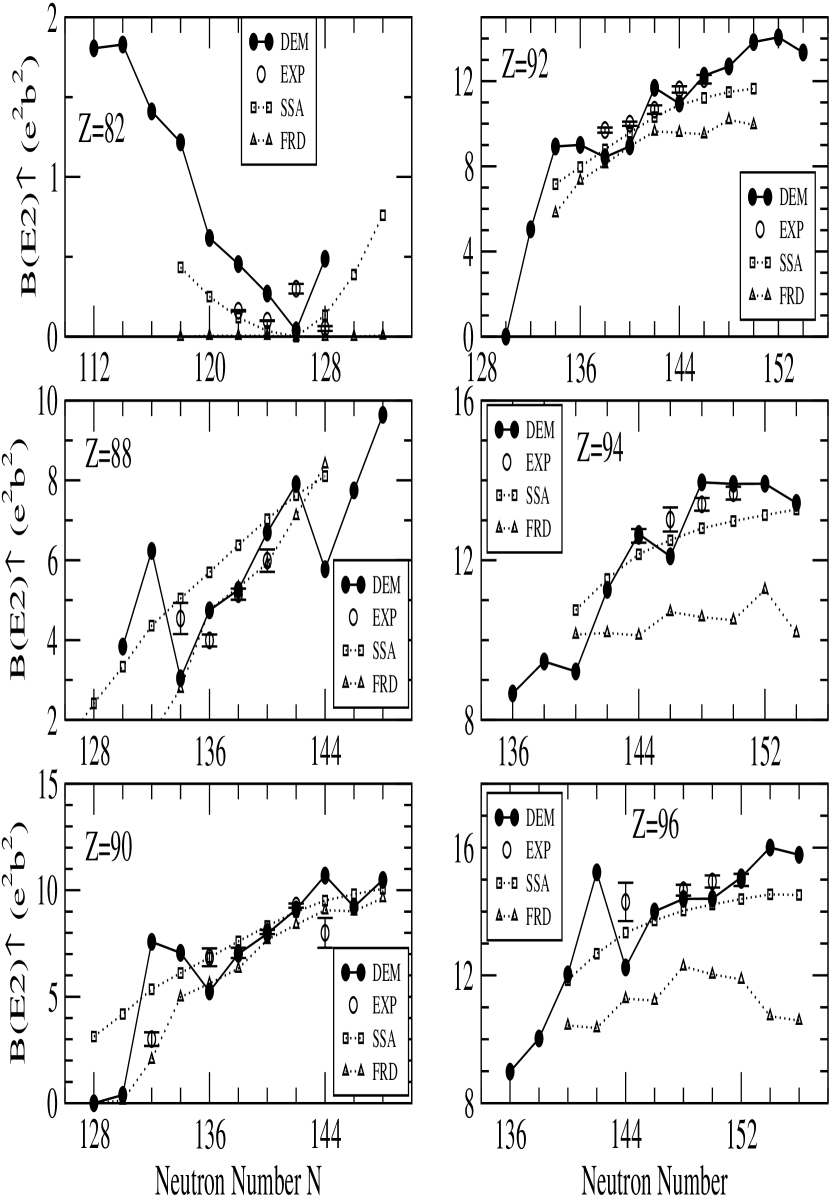
In order to provide a better perception of the DEM predictions in contrast to those of experiment, we also present them graphically in Figs. 2 to 7 for almost all those isotope series showing significant changes in nuclear structure. Also included in these figures, predictions of two other standard theoretical models namely SSANM ssa and FRDM frd for sake of good comparison. First of all one can see from these figures, the excellent agreement of our DEM predictions with those of the experimental data. Secondly, in most of the cases we see, that the DEM predictions almost follow the experimental trends. Even the sharply changing nuclear structures in most of the cases are well reproduced by our DEM predictions compared to the other two theoretical models SSANM ssa and FRDM frd .
References
- (1) S. Raman, C. W. Nestor, Jr, P. Tikkanen, At. Data and Nucl. Data Tables 78(2001)1-128
- (2) S. Raman, C. H. Malarkey, W. T. Milner, C. W. Nestor Jr., At. Data and Nucl. Data Tables 36(1987)1.
- (3) B. Pritychenko, J. Choquette, M. Horoi, B. Karamy and B. Singh , At. Data and Nucl. Data Tables 98(2012)798-811
- (4) C. K. Ross and R. K. Bhaduri, Nucl. Phys. A 196 (1972)369
- (5) R. Patnaik, R. Patra and L. Satpathy, Phys. Rev.C12 (1975) 2038
- (6) S. Raman, J. A. Sheikh and K. H. Bhatt, Phys. Rev.C 52 (1995) 1380
- (7) P. Moeller, and J. R. Nix, W. D. Myers and W. J. Swiatecki, Atom. Data and Nucl. Data Tables 59 (1995)185.
- (8) S. Pattnaik and R. C. Nayak, Int. Jou. of Mod. Phys. E 23 (2014)1450022
- (9) L. Satpathy, J.Phys.G13(1987) 761
- (10) L. Satpathy and R. C. Nayak , At. Data and Nucl. Data Tables 39 (1988) 213
- (11) R. C. Nayak and L. Satpathy, Atom. Data and Nucl. data Tables 73 (1999)213
- (12) R. C. Nayak and L. Satpathy, Atom. Data and Nucl. Data Tables 98 (2012)616
- (13) R. C. Nayak, Phys. Rev.C 60 (1999) 064305
- (14) S. Raman, C. W. Nestor, K. H. Bhatt, Phys. Rev. C 37(1988) 805
- (15) H. Monna, T. Otsuka, B. A. Brown, T. Mizusaki, Eur. Phys. J., A25 (Suppl. 1) (2005)499.
- (16) H. Monna, T. Otsuka, T. Mijusaki, M. Hojorth-Jensen, Phys. Rev. C 80 (2009)064323.
99
V EXPLANATION OF TABLE
| Proton number. The data table is ordered by increasing proton number. | |
| The corresponding name of each element is given in parenthesis. | |
| Neutron number. | |
| Mass number. | |
| B(E2) (DEM) | Predicted values of B(E2) s in the Differential Equation Model (DEM) of a nucleus (N,Z) followed by its model uncertainty in units of . |
| B(E2) (EXP) | Experimentally adopted values rmn ; prt of B(E2) of a nucleus (N,Z) followed by its uncertainty in units of . |
VI EXPLANATION OF FIGURES 2-7
Summary of Graphs of B(E2) Predictions for Ne to Cf (Z=10-98) Isotopes
These figures show plots of all the DEM predictions marked as DEM, and the experimentally adopted rmn ; prt data labeled as EXP where available, for most of the isotope series showing significant nuclear structure. Also included in them, the predictions of two standard theoretical models SSANMssa and FRDM frd labeled as SSA and FRD respectively just for sake of comparison.
VII TABLE
Predicted Values of (DEM) Compared to Experiment (EXP) Where Available