Present address: ]Sandia National Laboratories, Albuquerque, NM
Present address: ]Departamento de Física, Universidad de Las Palmas de Gran Canaria, 35017 Las Palmas de Gran Canaria, Spain
Present address: ]Lawrence Livermore National Laboratory, Livermore, CA
Direct asymmetry measurement of temperature and density spatial distributions in inertial confinement fusion plasmas from pinhole space-resolved spectra
Abstract
Two-dimensional space-resolved temperature and density images of an inertial confinement fusion (ICF) implosion core have been diagnosed for the first time. Argon-doped, direct-drive ICF experiments were performed at the Omega Laser Facility and a collection of two-dimensional space-resolved spectra were obtained from an array of gated, spectrally resolved pinhole images recorded by a multi-monochromatic x-ray imager. Detailed spectral analysis revealed asymmetries of the core not just in shape and size but in the temperature and density spatial distributions, thus characterizing the core with an unprecedented level of detail.
Inertial confinement fusion (ICF) is an approach that utilizes laser produced ablation pressure to compress a millimeter-sized spherical shell capsule containing fuel (e.g., deuterium and tritium) and drive the fuel temperature and density to conditions suitable for ignition Lindl et al. (2004). The key is a spherically symmetric and stable compression. While state-of-the-art hydrodynamics simulations have been used to design ignition implosions, the challenge of achieving a symmetric implosion experimentally has thus far prevented ICF from reaching the conditions required for successful ignition Landen et al. (2012). Hence, measuring the spatial asymmetry in the temperature and density distributions in the implosion core is crucial for understanding how to make it more symmetric.
Several diagnostics were developed in the last few decades in order to investigate implosion core conditions. K-shell line emission spectroscopy using Ar as a tracer has proved to be a powerful tool to extract space-averaged electron temperature, , and density, Griem (1992); Hammel et al. (1993); Bailey et al. (2004). However, two-dimensional (2-D) space-resolved spectra have never been extracted to study the asymmetries of and structures in the implosion core. X-ray pinhole imaging of ICF implosion cores has been used to study the shape and size of the core and, in particular, to characterize deviations from spherical symmetry Suter et al. (1994); Murphy et al. (1998). Nevertheless, these images do not reveal the implosion asymmetries in and distributions.
This Letter describes a new spectroscopic method that combines the ideas of Ar tracer spectroscopy and pinhole imaging to extract implosion core images in and without making symmetry assumptions. These pinhole images are extracted by analyzing a collection of 2-D space-resolved spectra obtained from an array of spectrally resolved core images. The direct measurement of temperature and density asymmetries in the core provides stringent constraints on what actually happens in implosion experiments and can be used to benchmark hydrodynamic simulations. The discussion here focuses on the application to ICF implosion core conditions; nevertheless, the ideas are general. The extraction and analysis of space-resolved spectra from spectrally resolved pinhole images opens up new possibilities for x-ray spectroscopy of high-energy density plasmas.
The spectroscopic data were recorded in a series of Ar-doped ICF implosion experiments performed at the Omega Laser Facility of the Laboratory for Laser Energetics. In the experiments, 60 OMEGA laser beams (, total energy , pulse-duration 2 ns) were used to irradiate the surface of spherical plastic shell (radius , shell thickness ) filled with 20 atm of . LILAC 1-D Delettrez et al. (1987) hydrodynamic simulations predict that the implosion core plasma conditions would range 1-3 keV in and in around the collapse of the implosion. Ar K-shell spectroscopy is appropriate to diagnose these conditions Griem (1992); Hammel et al. (1993); Bailey et al. (2004). Spectral line broadening of the Ar and (i.e., n=3 to 1 transitions in H-like and He-like Ar, respectively) is dominated by the Stark effect, which is sensitive to . The line intensity ratio of Ar to is dependent on . Thus, a tracer amount of Ar (0.18 % atomic concentration) was mixed into the fuel to infer the implosion core plasma conditions. Previous observations of space-integrated Ar K-shell spectra have uniquely determined and of implosion core plasmas by fitting the data with detailed spectral models Griem (1992); Hammel et al. (1993); Bailey et al. (2004). In order to investigate the asymmetry in and spatial distributions, the challenge is to record Ar line emission not just with spectral resolution, but also with 2-D spatial resolution.
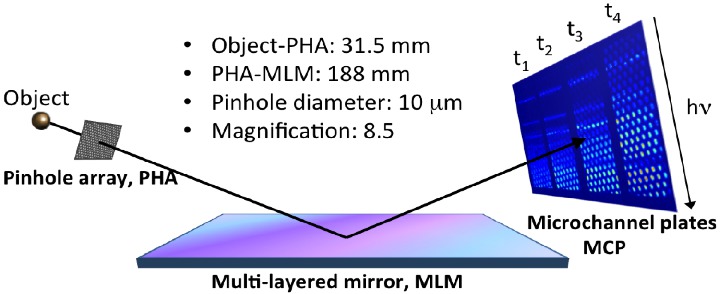
The multi-monochromatic x-ray imager (MMI)Tommasini et al. (2006) is a unique 2-D space-resolved x-ray spectrometer, which consists of a pinhole array (PHA), a multi-layered Bragg mirror (MLM), and microchannel plates (MCP) (Fig. 1). Characteristic parameters of the instrument are listed in the figure. For the experiments discussed here, the four MCP strips were triggered at different times with an interstrip delay of 100 ps, thus recording four snapshots of spectrally resolved 2-D implosion core image arrays (). Figure 2(a) shows a blow up of one MCP strip ( in Fig. 1). Photons passing through different pinholes have slightly different incident angles onto the mirror, which produces spectral resolving power, , of 150 in the horizontal direction of Fig. 2(a) (i.e., vertical direction of the MCP strip in Fig. 1). On the MCP, the and lines are approximately separated by 20 ps in time. More details about the instrument are described elsewhere Tommasini et al. (2006). These spectrally resolved images are rich in information, and can be processed to produce broad- and narrow-band images and the space-integrated spectrum Welser et al. (2003).
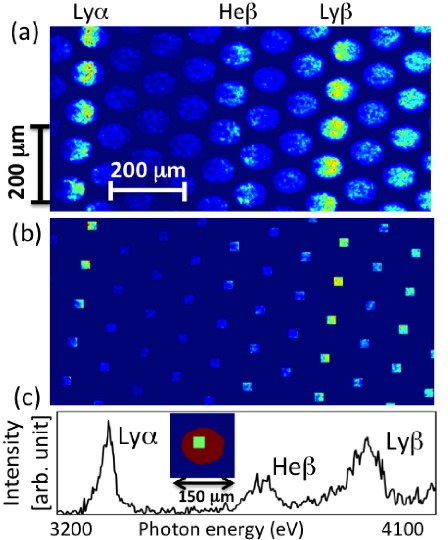
Recently, there have been major improvements in MMI data processing, including a more accurate and efficient technique for the determination of image centers Nagayama et al. (2011). The artifacts associated with the discrete nature of the data were significantly suppressed both on the space-integrated spectrum and quasi-monochromatic images. An implosion core mask was introduced to limit the background signal and to mitigate the spatial bias in the sampled points at each photon energy. This dramatically improved the quality of the space-integrated spectrum. In this Letter, we demonstrate for the first time that 2-D space-resolved spectra can be extracted from the spectrally resolved images. First, we define a mask associated to a sub-region of the core image whose location is specified relative to image center [e.g., the green square of Fig. 2(c)]. Then, we apply the sub-region mask to each individual core image on the original MMI data and pick out the data associated with the selected sub-region [Fig. 2(b)]. Finally, we compute the spectrum associated with this sub-region using the technique discussed in Ref. Nagayama et al. (2011). The resultant spectrum shown in Fig. 2(c) is a 2-D space-resolved spectrum formed by photons only from the selected sub-region of the core image. The size of the spatial region is limited by the spatial resolution of the instrument and signal-to-noise ratio (S/N).
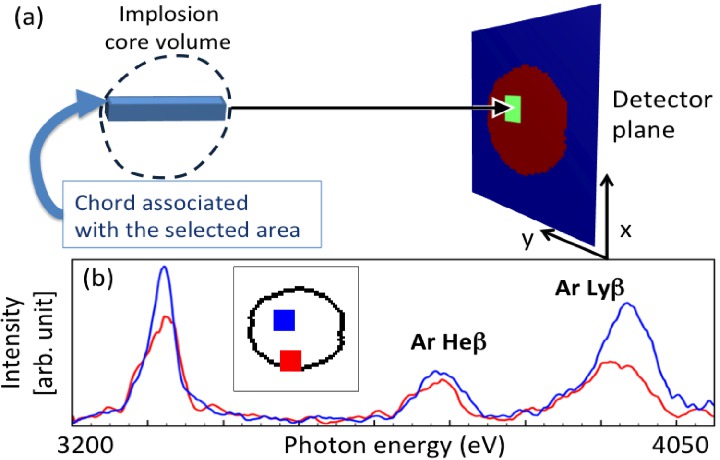
By repeating the same procedure for different sub-regions, one can extract a collection of space-resolved spectra, which are formed by radiation emitted from different sub-volumes (or chords of finite cross-section) in the implosion core. Figure 3(a) is a schematic to visualize the connection between a sub-region on the image plane and the corresponding sub-volume in the implosion core that produces the space-resolved spectrum extracted for the selected sub-region. The chord associated with a space-resolved spectrum can be defined by the intersection of the core volume (i.e., a volume indicated by a dashed line) and the projection of the spatial region along the line of sight [Fig. 3(a)]. This parallel ray tracing assumption is a good approximation. The rays collected by a single pinhole are parallel within arctan(/)0.02∘ where =10 m is the pinhole diameter and = cm is the object to pinhole distance. Signals through different pinholes deviate more from parallel. However, over the He and Ly regions of the MMI data, the pinholes are separated by less than (the separation between adjacent pinholes is 90 m). The rays going through pinholes separated by 400 m deviate from parallel by less than [i.e., arctan(400 m/)]. At maximum chord length (i.e., 100 m), this deviation results in an error on the magnification-corrected image plane of , which is much smaller than the spatial resolution of the instrument and thus negligible.
The photon mean-free-path of the diagnostic lines, Ar and , are typically larger than the core size. Hence, the analysis of the space-resolved spectrum gives the chord-averaged and characteristic of the sub-volume. Figure 3(b) shows a comparison of two space-resolved spectra extracted from two different core sub-regions. The spectra are slightly smoothed for discussion purposes. On one hand, the spectrum from a central region (i.e., blue) has a larger to ratio than that from the edge (i.e., red), which implies that chord-averaged is higher in the central region. On the other hand, the spectrum from the edge region shows larger broadening than that from the central which is consistent with the idea of higher densities in the outer region of the core.
To model these spectra in detail, the local emissivity and opacity of Ar were computed as a function of and using a collisional-radiative atomic kinetics model, ABAKO Florido et al. (2009) and detailed Stark-broadened line shapes Mancini et al. (1991). The optical depths of He and Ly are small; still neglecting the opacity effects in the level population kinetics and in the emergent spectra calculation would not produce the most accurate analysis results Keane et al. (1993); Nagayama et al. (2008). The opacity effect in the level population kinetics is important to compute reliable plasma emissivity and opacity. This effect was taken into account by an escape factor approximation for a spherical source that considers the local conditions of the plasma and the size of the core Mancini et al. (1987). The escape factor source radius is estimated by mass conservation based on the initial filling pressure and local density, . This approximation was tested by comparing with results from the self-consistent solution of atomic kinetics and radiation transport equation for the relevant plasma size and conditions Golovkin and Mancini (2000). The opacity effect in the emergent spectra is taken into account by integrating the radiation transport equation along a uniform chord, :
| (1) |
where and are the emissivity and opacity of Ar computed with the detailed atomic model at electron temperature, , and electron density, , of the chord, . is the chord length estimated by the implosion core volume extracted from the MMI data Nagayama et al. (2011). A global optimization, GALM, which consists of a genetic algorithm (GA) followed up by a Levenberg-Marquardt non-linear least squares minimization (LM) Nagayama et al. (2012), was used to objectively find the optimal and of the region that produce the best fits to the space-resolved spectrum. Since the GA is initialized by a random number generator, running it with different initial seeds for the same data checks the solution uniqueness. For each run, the GA solution is fine tuned by the LM. In this way GALM combines the complementary characteristics of the GA and the LM optimization algorithms.
To extract and spatial distributions, a total of 18 rectangular spatial regions were defined within the implosion core boundary and the collection of space-resolved spectra associated with each spatial region were extracted. As the sub-region size becomes smaller, one can extract finer details about the spatial structure. However, at the same time, the noise of the spectra becomes larger. As one selects a smaller and smaller sub-region, at some point, the uncertainties in the inferred conditions of the sub-region exceed the region-to-region variations, and the extracted spatial structure is not reliable. Thus, we selected the minimum sub-region size such that the space-resolved spectra had enough S/N and the extracted spatial structure is statistically meaningful. This threshold size depends on the MMI S/N, and we found this threshold to be 16 m for the data discussed here. Typical S/N for Ly and He for the extracted space-resolved spectra are 4.2 and 5.2, respectively. With better S/N, the threshold size can become as small as the spatial resolution of the instrument.
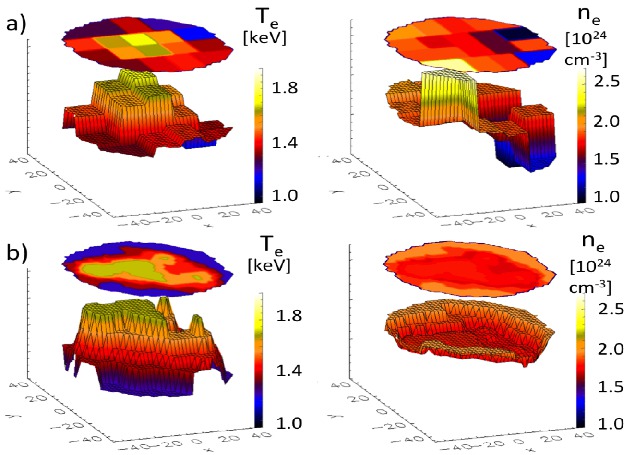
Each spectrum is independently analyzed using GALM coupled with the spectral model described above [Eq. (1)]. The collection of fits to the data have an average normalized of 1.12 with a standard deviation of 0.35. The uncertainties were determined by propagating the noise on the MMI data through the spectra extraction. The analysis results for the 2-D spatial distribution of and in the core are displayed in surface plots and contour images in Fig. 4(a). The overall shape of the core projected onto the image plane can be approximated by an ellipse of 9179 m in size. Within the core, we observe that the and distributions are counter correlated and have asymmetric distributions. The hot spot is shifted away from the core center by about 14 and has an asymmetric structure. Also, given and , we can assess how isobaric the implosion core is based on an ideal gas approximation (i.e., ). The implosion core is isobaric within 18%. The uncertainties in and inferred from the analysis were and , respectively, and thus the extracted spatial structure is statistically significant. We must note that these uncertainties do not include the uncertainty in the spectral model. Since the same model is used for all space-resolved spectra analyses, model uncertainties would affect the results systematically without significantly changing the relative spatial structure. We emphasize that these and values are chord-integrated, but they still reflect the asymmetries present in the core conditions achieved at the collapse of the implosion.
One can envision different ways of extracting the collection of space-resolved spectra since there is flexibility in the way in which the image sub-regions can be defined. The ratio of the two narrow-band images, to , is related to the temperature spatial structure Nagayama et al. (2008). Thus, another way to define sub-region masks is based on the contour levels of the Ar to ratio image. We emphasize that this ratio image is not used in the analysis, but used only to define image sub-regions for space-resolved spectra extraction. This alternative selection of image sub-regions results in irregular zones but captures spatial asymmetry effectively in fewer spatial regions with better S/N in the extracted spectra (i.e., 7.6 and 10.0 for Ly and He, respectively). Five contour-type spatial regions are defined and the corresponding space-resolved spectra were extracted and analyzed. The collection of fits to the data have an average normalized of 1.08 with a standard deviation of 0.47. The uncertainties in the temperatures and densities were improved to about 2% and 5%, respectively, due to better S/N in the spectra. Figure 4(b) shows the resultant and distributions. This analysis helps to study not only asymmetry in temperature but also the average densities in the corresponding equi-temperature regions, which better illustrates the and counter-correlation. Due to more space-averaging, the core pressure in this representation becomes more uniform (i.e., within 8%). The hot spot region in the core is approximated by an oval of 4421 m in size, i.e., an ellipse of larger eccentricity than that of the core shape. Furthermore, one can more clearly see that the hot spot is shifted away from center along the negative x-direction and not fully surrounded by symmetric, high density regions.
Since this experiment was a direct-drive implosion, the combination of laser non-uniformity, power imbalance, and target surface roughness are all possible seeds for asymmetry. In addition, there is a stalk that initially holds the capsule, and we noticed that its projection on to the detector plane was along the negative x-axis in Fig. 4. The connection between stalk (or fill tube) and core shape asymmetry has been reported previously based on broad-band emission image dataIgumenshchev et al. (2009); Langer et al. (2007); Hammel et al. (2011); Kline et al. (2013), but our results suggest that isolated defects due to the stalk could also correlate with the asymmetry in and . Time-resolution of the MMI data was provided by the MCP strips (Fig. 1), and the time-evolution of the asymmetry is under investigation.
The idea of extracting space-resolved spectra from an array of spectrally resolved images opens up a new way to analyze spatial structure of plasmas. We presented its application to OMEGA ICF experiments and extracted the implosion core and asymmetry for the first time. With a suitable selection of spectroscopic tracer, the same diagnostic method can be applied to NIF implosion experiments. The asymmetry was investigated with two different sub-region definitions, which provided consistent insights into the details of the spatial structure. While the space-resolved spectra obtained from rectangular sub-regions provides a general way to study asymmetry, the contour-type regions help to better visualize and interpret the asymmetry information. These two results illustrate the versatility and potential of MMI space-resolved spectra analysis as well as the flexibility in the sub-region selection. Finally, the extraction and analysis of space-resolved spectra from MMI data discussed here also provides the basis to implement a polychromatic tomography method Nagayama et al. (2012) to investigate the 3-D and distributions of laboratory high energy density plasmas, including ICF implosion cores.
This work was supported by DOE/NLUF Grants DE-FG52-09NA29042 and DE-NA0000859, and LLNL. RF was also partially supported by Grant No. ENE2009-11208 of the Spanish Ministry of Science and Innovation and the Keep-in-Touch Project of the EU.
References
- Lindl et al. (2004) J. D. Lindl, P. Amendt, R. L. Berger, S. G. Glendinning, S. H. Glenzer, S. W. Haan, R. L. Kauffman, O. L. Landen, and L. J. Suter, Physics of Plasmas 11, 339 (2004).
- Landen et al. (2012) O. L. Landen, R. Benedetti, D. Bleuel, T. R. Boehly, D. K. Bradley, J. A. Caggiano, D. A. Callahan, P. M. Celliers, C. J. Cerjan, D. Clark, G. W. Collins, E. L. Dewald, S. N. Dixit, T. Doeppner, D. Edgell, J. Eggert, D. Farley, J. A. Frenje, V. Glebov, S. M. Glenn, S. H. Glenzer, S. W. Haan, A. Hamza, B. A. Hammel, C. A. Haynam, J. H. Hammer, R. F. Heeter, H. W. Herrmann, D. G. Hicks, D. E. Hinkel, N. Izumi, M. Gatu Johnson, O. S. Jones, D. H. Kalantar, R. L. Kauffman, J. D. Kilkenny, J. L. Kline, J. P. Knauer, J. A. Koch, G. A. Kyrala, K. LaFortune, T. Ma, A. J. Mackinnon, A. J. Macphee, E. Mapoles, J. L. Milovich, J. D. Moody, N. B. Meezan, P. Michel, A. S. Moore, D. H. Munro, A. Nikroo, R. E. Olson, K. Opachich, A. Pak, T. Parham, P. Patel, H.-S. Park, R. P. Petrasso, J. Ralph, S. P. Regan, B. A. Remington, H. G. Rinderknecht, H. F. Robey, M. D. Rosen, J. S. Ross, J. D. Salmonson, T. C. Sangster, M. B. Schneider, V. Smalyuk, B. K. Spears, P. T. Springer, L. J. Suter, C. A. Thomas, R. P. J. Town, S. V. Weber, P. J. Wegner, D. C. Wilson, K. Widmann, C. Yeamans, A. Zylstra, M. J. Edwards, J. D. Lindl, L. J. Atherton, W. W. Hsing, B. J. MacGowan, B. M. Van Wonterghem, and E. I. Moses, Plasma Phys. Control. Fusion 54, 124026 (2012).
- Griem (1992) H. R. Griem, Physics of Fluids B: Plasma Physics 4, 2346 (1992).
- Hammel et al. (1993) B. A. Hammel, C. J. Keane, M. D. Cable, D. R. Kania, J. D. Kilkenny, R. W. Lee, and R. Pasha, Physical Review Letters 70, 1263 (1993).
- Bailey et al. (2004) J. E. Bailey, G. A. Chandler, S. A. Slutz, I. Golovkin, P. W. Lake, J. J. MacFarlane, R. C. Mancini, T. J. Burris-Mog, G. Cooper, R. J. Leeper, T. A. Mehlhorn, T. C. Moore, T. J. Nash, D. S. Nielsen, C. L. Ruiz, D. G. Schroen, and W. A. Varnum, Physical Review Letters 92, 085002 (2004).
- Suter et al. (1994) L. J. Suter, A. A. Hauer, L. V. Powers, D. B. Ress, N. Delameter, W. W. Hsing, O. L. Landen, A. R. Thiessen, and R. E. Turner, Physical Review Letters 73, 2328 (1994).
- Murphy et al. (1998) T. J. Murphy, J. M. Wallace, N. D. Delamater, C. W. Barnes, P. Gobby, A. A. Hauer, E. Lindman, G. Magelssen, J. B. Moore, J. A. Oertel, R. Watt, O. L. Landen, P. Amendt, M. Cable, C. Decker, B. A. Hammel, J. A. Koch, L. J. Suter, R. E. Turner, R. J. Wallace, F. J. Marshall, D. Bradley, R. S. Craxton, R. Keck, J. P. Knauer, R. Kremens, and J. D. Schnittman, Physical Review Letters 81, 108 (1998).
- Delettrez et al. (1987) J. Delettrez, R. Epstein, M. C. Richardson, P. A. Jaanimagi, and B. L. Henke, Phys. Rev. A 36, 3926 (1987).
- Tommasini et al. (2006) R. Tommasini, J. A. Koch, N. Izumi, L. A. Welser, R. C. Mancini, J. Delettrez, S. P. Regan, and V. Smalyuk, Advances in X-Ray/EUV Optics 6317, 631716 (2006).
- Welser et al. (2003) L. A. Welser, R. C. Mancini, J. A. Koch, S. Dalhed, R. W. Lee, I. E. Golovkin, F. Marshall, J. Delettrez, and L. Klein, Rev. Sci. Instrum. 74, 1951 (2003).
- Nagayama et al. (2011) T. Nagayama, R. C. Mancini, R. Florido, R. Tommasini, J. A. Koch, J. A. Delettrez, S. P. Regan, and V. A. Smalyuk, J Appl Phys 109, 093303 (2011).
- Florido et al. (2009) R. Florido, R. Rodríguez, J. M. Gil, J. G. Rubiano, P. Martel, E. Mínguez, and R. C. Mancini, Phys. Rev. E 80, 56402 (2009).
- Mancini et al. (1991) R. C. Mancini, D. P. Kilcrease, L. A. Woltz, and C. F. Hooper, Jr., Computer Physics Communications 63, 314 (1991).
- Keane et al. (1993) C. J. Keane, B. A. Hammel, D. R. Kania, J. D. Kilkenny, R. W. Lee, A. L. Osterheld, L. J. Suter, R. C. Mancini, C. F. Hooper, and N. D. Delamater, Physics of Fluids B: Plasma Physics 5, 3328 (1993).
- Nagayama et al. (2008) T. Nagayama, R. C. Mancini, R. Florido, R. Tommasini, J. A. Koch, J. A. Delettrez, S. P. Regan, V. A. Smalyuk, L. A. Welser-Sherrill, and I. E. Golovkin, Rev. Sci. Instrum. 79, 10E921 (2008).
- Mancini et al. (1987) R. C. Mancini, R. F. Joyce, and C. F. Hooper, Jr., J. Phys. B: At. Mol. Phys. 20, 2975 (1987).
- Golovkin and Mancini (2000) I. E. Golovkin and R. C. Mancini, Journal of Quantitative Spectroscopy and Radiative Transfer 65, 273 (2000).
- Nagayama et al. (2012) T. Nagayama, R. C. Mancini, R. Florido, D. Mayes, R. Tommasini, J. A. Koch, J. A. Delettrez, S. P. Regan, and V. A. Smalyuk, Physics of Plasmas 19, 082705 (2012).
- Igumenshchev et al. (2009) I. V. Igumenshchev, F. J. Marshall, J. A. Marozas, V. A. Smalyuk, R. Epstein, V. N. Goncharov, T. J. B. Collins, T. C. Sangster, and S. Skupsky, Physics of Plasmas 16, 082701 (2009).
- Langer et al. (2007) S. H. Langer, N. Izumi, T. R. Dittrich, and S. W. Haan, High Energ Dens Phys 3, 169 (2007).
- Hammel et al. (2011) B. A. Hammel, H. A. Scott, S. P. Regan, C. Cerjan, D. S. Clark, M. J. Edwards, R. Epstein, S. H. Glenzer, S. W. Haan, N. Izumi, J. A. Koch, G. A. Kyrala, O. L. Landen, S. H. Langer, K. Peterson, V. A. Smalyuk, L. J. Suter, and D. C. Wilson, Physics of Plasmas 18, 056310 (2011).
- Kline et al. (2013) J. L. Kline, D. A. Callahan, S. H. Glenzer, N. B. Meezan, J. D. Moody, D. E. Hinkel, O. S. Jones, A. J. Mackinnon, R. Bennedetti, R. L. Berger, D. Bradley, E. L. Dewald, I. Bass, C. Bennett, M. Bowers, G. Brunton, J. Bude, S. Burkhart, A. Condor, J. M. Di Nicola, P. Di Nicola, S. N. Dixit, T. Doeppner, E. G. Dzenitis, G. Erbert, J. Folta, G. Grim, S. Glenn, A. Hamza, S. W. Haan, J. Heebner, M. Henesian, M. Hermann, D. G. Hicks, W. W. Hsing, N. Izumi, K. Jancaitis, O. S. Jones, D. Kalantar, S. F. Khan, R. Kirkwood, G. A. Kyrala, K. LaFortune, O. L. Landen, L. Lagin, D. Larson, S. L. Pape, T. Ma, A. G. MacPhee, P. A. Michel, P. Miller, M. Montincelli, A. S. Moore, A. Nikroo, M. Nostrand, R. E. Olson, A. Pak, H.-S. Park, J. P. Patel, L. Pelz, J. Ralph, S. P. Regan, H. F. Robey, M. D. Rosen, J. S. Ross, M. B. Schneider, M. Shaw, V. A. Smalyuk, D. J. Strozzi, T. Suratwala, L. J. Suter, R. Tommasini, R. P. J. Town, B. Van Wonterghem, P. Wegner, K. Widmann, C. Widmayer, H. Wilkens, E. A. Williams, M. J. Edwards, B. A. Remington, B. J. MacGowan, J. D. Kilkenny, J. D. Lindl, L. J. Atherton, S. H. Batha, and E. Moses, Physics of Plasmas 20, 056314 (2013).