Fermi surface reconstruction in (Ba1-xKx)Fe2As2 (0.44 1) probed by thermoelectric power measurements
Abstract
We report in-plane thermoelectric power measurements on single crystals of (Ba1-xKx)Fe2As2 (0.44 1). We observe a minimum in the versus at 0.55 that can be associated with the change in the topology of the Fermi surface, a Lifshitz transition, related to the electron pockets at the center of point crossing the Fermi level. This feature is clearly observable below 75 K. Thermoelectric power also shows a change in the 0.8 - 0.9 range, where maximum in the thermoelectric power collapses into a plateau. This Lifshitz transition is most likely related to the reconstruction of the Fermi surface associated with the transformation of the hole pockets at the point into four blades as observed by ARPES measurements.
pacs:
74.70.Xa, 74.25.fg, 74.62.BfI Introduction
Since their discoveryKamihara et al. (2008), iron-based superconductors have been the subject of extensive theoretical and experimental research in order to better understand their physical properties and, more importantly, the origin of superconductivity. AEFe2As2 (AE - alkali earth) is one of the most studied structural families in part because it allows for the study of AE, Fe, and As site substitutions.Canfield and Bud’ko (2010); Mandrus et al. (2010); Ni and Bud’ko (2011) Among various members, (Ba1-xKx)Fe2As2 has the highest bulk of 38 KRotter et al. (2008a) and doping is done in the Ba-layers with the least perturbation to the FeAs layers, which are believed to be essential for superconductivity. Interestingly, in this series, the superconducting dome extends to, and includes, the end member, KFe2As2 with 3.5 K.Avci et al. (2012)
Learning about the Fermi surface (FS) is important for understanding of the mechanism of superconductivity.Mazin and Schmalian (2009); Kemper et al. (2010); Hirschfeld et al. (2011); Chubukov (2012) Based on the angle-resolved photoemission spectroscopy (ARPES) studies of (Ba1-xKx)Fe2As2,Liu et al. (2008); Sato et al. (2009); Yoshida et al. (2011); Xu et al. (2011); Nakayama et al. (2011); Richard et al. (2011); Okazaki et al. (2012); Malaeb et al. (2012); Xu et al. (2013); Ota et al. (2014) one or two Lifshitz transitionsLifshitz (1960) are expected between and = 1. One Lifshitz transition is associated with the disappearance of the electron pockets around the zone corner ( point)Malaeb et al. (2012) and second Lifshitz transition is associated with the transformation of the ellipsoid-like hole pockets at the point into small off- centered hole FS pocket lobesXu et al. (2013). Both Ref. Malaeb et al., 2012 and Ref. Xu et al., 2013 report a Lifshitz transition, albeit at different K-concentrations. Ref. Malaeb et al., 2012 claims the disappearance of the electron pocket at point. Ref. Nakayama et al., 2011 states that the shallow electron pocket is still present at point for = 0.7 and is expected to cross the Fermi energy upon further K-substitution in the rigid band approximation. Ref. Xu et al., 2013 claims the emergence of four small off--centered lobes with some, within error bars, intensity due to electron pocket at the point. These results seem contradictory and inconclusive.
Interestingly, an anomaly in the pressure derivatives and deviation from the , known as BNC scaling,Bud’ko et al. (2009) were observed at 0.7 by pressure dependent magnetization and specific heat measurements.Bud’ko et al. (2013); Stewart (2011) Moreover, an electronic topological (Lifshitz) transition was predicted at 0.9 for (Ba1-xKx)Fe2As2 by the band structure calculations.Khan and Johnson (2014) And a change in the superconducting gap symmetry was observed at by thermal conductivity and penetration depth measurements.Watanabe et al. (2014)
Thermoelectric power (TEP) can be very sensitive to the changes in the FS because, grossly speaking, TEP depends, in part, on the derivative of the density of states at the Fermi level. Hence, TEP measurements can be a good tool for probing the potential changes in the FS topology of (Ba1-xKx)Fe2As2. TEP was measured on polycrystalline samples of hole-doped (Ba,K)Fe2As2 Yan et al. (2010) and it was concluded that (300 K) as a function of K-concentration has a complex behavior and may manifest features consistent with the existence of strong spin fluctuations in heavy-doped K-samples. Although transport measurements on polycrystalline samples are useful, most of the time the anisotropic dependencies of the properties are averaged and subtle changes can be smeared and missed. Therefore, we performed TEP measurements on single crystals of (Ba1-xKx)Fe2As2 (0.44 1) with on a denser set of K-concentrations on the over-doped side of the phase diagram. We observe features at 0.55 and 0.8-0.9 that are consistent with the Lifshitz transitions that have been associated with the shift of the electron pockets at the point above the Fermi level and the transformation of the hole pockets near the point into ”four blades” as observed by ARPES measurementsXu et al. (2013); Malaeb et al. (2012).
II Experimental Details
(Ba1-xKx)Fe2As2 single crystals were grown following the procedure outlined in detail in Ref. Liu et al., 2014. An 0.55 batch of (Ba1-xKx)Fe2As2 single crystals was grown using Fe and As rich melt with an initial elemental composition of Ba:K:Fe:As = :3:4:5. A K- and As-rich melt was used to grow heavily K-doped (Ba1-xKx)Fe2As2 ( = 0.65, 0.80, 0.82, 0.92, and 1) batches of single crystals with initial elemental compositions of Ba:K:Fe:As = :5:2:6 ( = 0.1, 0.2, and 0.3). The elements were loaded into an alumina crucible, and then sealed in a tantalum tube by arc welding. Different soaking temperatures of = 920, 1000, and 1050 0C were used to grow heavily K-doped (Ba1-xKx)Fe2As2 single crystals. The soaking temperature of = 920 0C works well for growing (Ba1-xKx)Fe2As2 ( = 0.92 and 1) single crystals. However, it was found that higher soaking temperatures of = 1000 and 1050 0C and the temperature window 900 0C 1050 0C are useful to grow high quality crystals with a sharp superconducting transition for the samples with = 0.65 and 0.80.
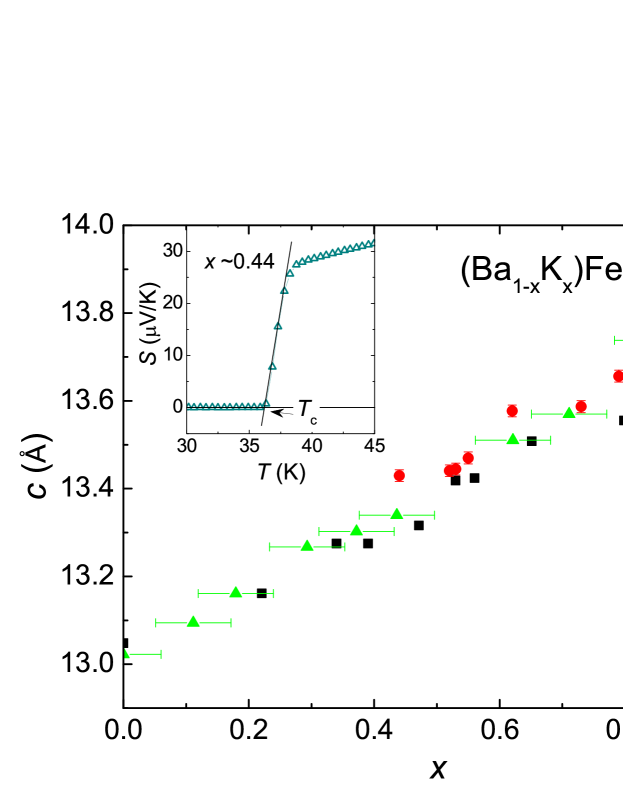
From the earliest growth of (Ba1-xKx)Fe2As2 single crystalsNi et al. (2008), it was been appreciated that the degree of K-substitution can vary within the batch or even within the different layers of the same crystal. Indeed in this study, the single crystals picked from the same batch had different values. That is why the concentrations of potassium for the specific samples used in this paper were inferred by matching the values obtained from the offset criterion, shown in the inset to Fig. 1, in the thermoelectric power (TEP) measurements to that in the published phase diagram Avci et al. (2012). Defining the K-concentration this way poses a difficulty in determining the error bars in the K-concentration. However, based on the sharpness of , we expect the error bars associated with the value of determined this way to be smaller than 0.05.
The concentrations of K as determined by this criterion were also checked by measuring the -lattice parameters of the same samples that where used for the TEP measurements. After the sample was dismounted from the TEP measurement set-up, the ends containing silver paste were carefully cut off and the tiny sample ( 1-2 mm long and 0.1 mm wide) was placed in the center of the zero-background powder x-ray diffraction holder. The sample was then oriented manually to give the best reflection conditions at 2 corresponding to (002) set of planes. After that, the x-ray diffraction pattern, containing five to seven sets of (00) planes in the 100 1100 range, were collected on the single crystal at room temperature using Rigaku MiniFlex powder diffractometer (Cu radiation). The -lattice parameters were refined by the LeBail method using Rietica software. rie The lattice parameters as a function of the K-concentrations (determined using criterion shown in the inset to Fig. 1) are presented in Fig. 1. We also plotted the data from Refs. [Liu et al., 2014] (squares) and [Rotter et al., 2008b] (triangles) for comparison. The agreement between our data and the literature is quite good.
Thermoelectric power measurements were performed using a dc, alternating heating (two heaters and two thermometers) technique Mun et al. (2010) by utilizing Quantum Design Physical Property Measurement System (PPMS®) to provide the temperature environment between 2 and 300 K. The samples were cleaved to get the surface of the samples as clean from the residual flux as possible. The samples were then cut and mounted directly on the surface of the SD package of the Cernox thermometers using Du-Pont 4929N silver paste to ensure thermal and electrical contact. The silver paste was allowed to cure at room temperature and 1 atm of air for about 24 h in a desiccator Hodovanets et al. (2013). The samples were mounted so that the thermal gradient was applied in the -plane. It should be noted that a small feature at 100 K in the data sets for all of the samples measured, independent of -value, is probably associated with switching between two temperature ranges of the Cernox thermometer calibration curves. Two data points markedly different from the neighboring data points due to this artifact in this temperature region were removed.
III Results
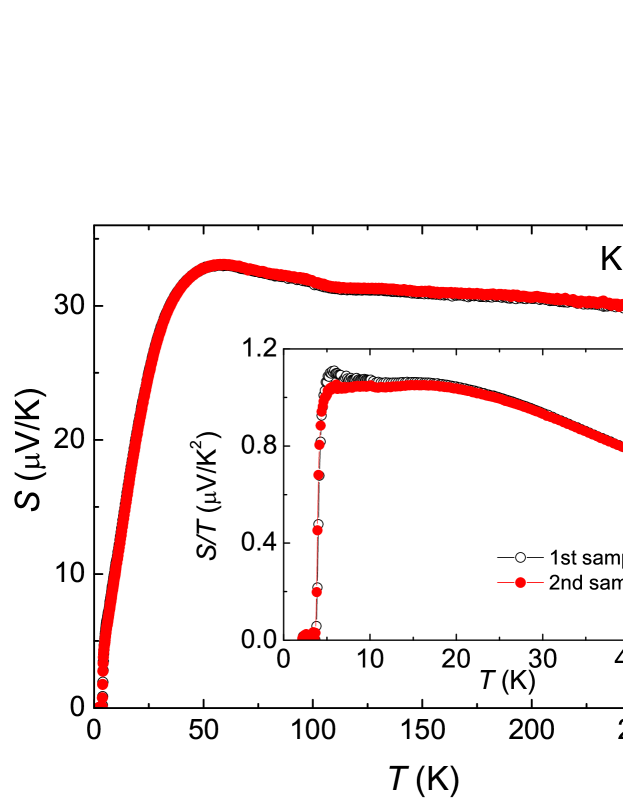
Thermoelectric power and data as a function of temperature for two single crystals of KFe2As2 are plotted in Fig. 2. The data for these two samples are very similar except in the for the first sample a difference of 6 is observed between 5 K (above the 4 K) and 20 K. It is worth pointing out that const above signifying Fermi-liquid-like behavior, which is consistent with the resistivity and thermal expansion measurementsHardy et al. (2013); Taufour et al. ; Liu et al. (2014).
Given that the Debye temperature for KFe2As2 is rather low, = 177 K,Hardy et al. (2013) the origin of the peak at 60 K seems unlikely to be due to phonon drag (expected at 0.1 - 0.3 Blatt et al. (1976)) but rather is probably of an electronic nature. For KFe2As2, a broad feature above 100 K has also been observed in the resistivity measurements, especially in the resistivity measured along the -direction,Terashima et al. (2009); Liu et al. (2013) and thermal expansion measurementsHardy et al. (2013). The origin of this feature might be associated with a coherence-incoherence crossover due to the scattering of the conduction electronsHardy et al. (2013). Whether the 60 K feature in the TEP is associated with this crossover or not is currently unclear.
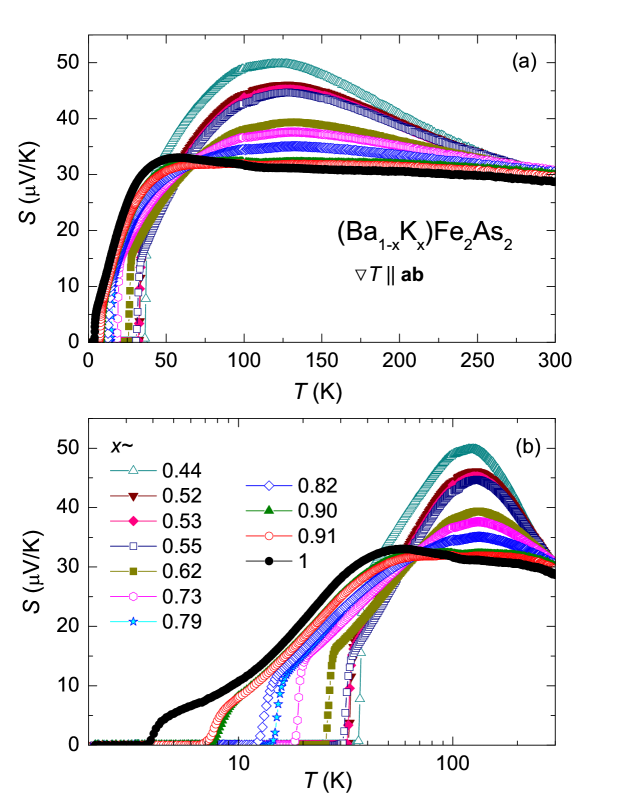
Figures 3(a) and (b) show temperature-dependent, in-plane thermoelectric power data of (Ba1-xKx)Fe2As2 (0.44 1) single crystals on linear and semi-log scales respectively. The superconducting state for all of the samples measured can be seen as a drop to zero value in the TEP data. Above 100 K, as the concentration of K increases, the value of the broad maximum in the TEP is decreasing in a roughly monotonic way and the position of the maximum at 125 K for 0.44 moves to slightly higher temperatures of 130 K for 0.82. After 0.82, for the next two potassium concentrations (0.9), the maximum collapses into a broad plateau followed by a maximum at 60 K for pure KFe2As2.
The behavior of the TEP as the concentration of K is increased is more complex below 100 K. The change in the TEP with increasing can be better seen on a semi-log plot given in Fig. 3(b). As K-concentration is increased, the value of decreases until 0.55, where the value of dips and is the smallest, below 75 K, of all the samples measured. As the K-concentration is further increased, the low-temperature values increase again.
It should be noted that the values of the TEP that we obtained by our measurements on single crystals are larger for heavy K-doped samples ( 0.8) than those reported for the polycrystalline samplesYan et al. (2010). The difference increases as the K-concentration is increased, most likely reflecting the anisotropies in the scattering that are associated with the 2D character of most of the Fermi surfaces of the KFe2As2Yoshida et al. (2011) as opposed to the significantly 3D character of the Fermi surfaces of the optimally-doped Ba0.6K0.4Fe2As2Xu et al. (2011). Indeed, the anisotropies of upper critical field and the normal state resistivity are also the largest for KFe2As2. Liu et al. (2014)
IV Discussion
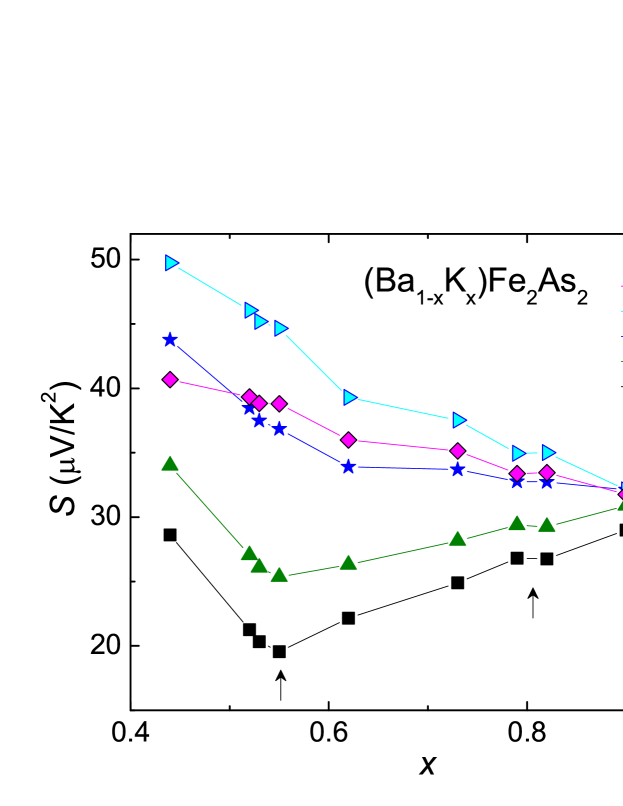
Clear features in vs can often be associated with the Lifshitz transitionsLifshitz (1960); Blanter et al. (1994); Varlamov et al. (1989) and indeed were observed in the TEP measured on Ba(Fe1-xCox)2As2 single crystals Hodovanets et al. (2011, 2013); Mun et al. (2009). To investigate the possibility of a Lifshitz transition in (Ba1-xKx)Fe2As2 single crystals, the data for is plotted as a function of K-concentration at constant temperatures in Fig. 4. Here we used 40 K as the lowest temperature which is above for all -values studied. Notably a minimum is clearly observable at 0.55 for the two lowest temperature cuts. As the temperature is increased above 75 K, this feature becomes less pronounced and ultimately disappears. This is consistent with ARPES measurements that pointed out 0.6 as a concentration where the electron FS pockets at the center of point disappear.Malaeb et al. (2012) A multi-carrier model of the TEP could possibly explain such a change in the data. However, it seems that computation of the scattering parameters and the TEP based on realistic band structure calculations that would also incorporate chemical substitution is beyond the capability of the present theory, especially for the correlated materials. Another, more subtle, feature, a slope change, is seen at 0.8. The weakness of this feature in the vs at 0.8 - 0.9 implies that there is no sharp change in the density of states at the Fermi level. The Fermi surface of (Ba,K)Fe2As2 is complicated. The theory of the Lifshitz transition as observed by the TEP measurements (Refs. Blanter et al., 1994 and Varlamov et al., 1989) despite being extended to include the impurity effect (the dirty case) and be valid at 0, is still only developed for the two generic types of Lifshitz transitions (void-formation and neck disruption) in a single band metal. The TEP depends not only on the derivative of the density of states at the Fermi level (the topology of the Fermi surface), but also on a type of charge carries, their mobilities and the type of scattering that they undergo, which change with temperature as well. All of this is hard to take into account when evaluating the functional dependence of the TEP near particular Lifshitz transition, especially in the multi band material. Perhaps that is why there is no general theory for the Lifshitz transitions in multiband materials, such as (Ba,K)Fe2As2, and no prediction on how strong or weak the feature in the TEP associated with Lifshitz transition should be. Not surprisingly, depending on the specific details of changes in the FS, the feature associated with the Lifshitz transition seen in the TEP measurements will be different. This might be especially pertinent for (Ba1-xKx)Fe2As2, where at 0.8-0.9, hole pockets at the zone corner simultaneously transform into ”four lobes”Xu et al. (2013).
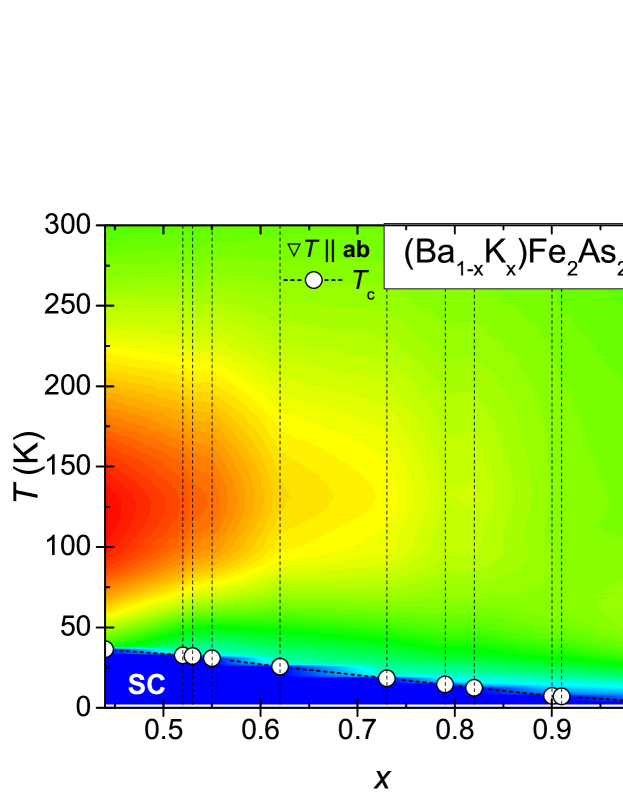
To visualize the change in at 0.8-0.9 more clearly, we can look at more than just isothermal cuts; we can create a broader overview by interpolating or extrapolating our data and create a 2D contour plot,Ori Fig. 5, where is a function of temperature and K-concentration. The phase diagram and the dotted lines indicating the concentrations of the measured samples were also added to the plot. It is notable that the red-yellow hight region evolves into a green region in at roughly 0.8 - 0.9, and indicates, as we discussed above, that the broad maximum in evolves into a plateau.
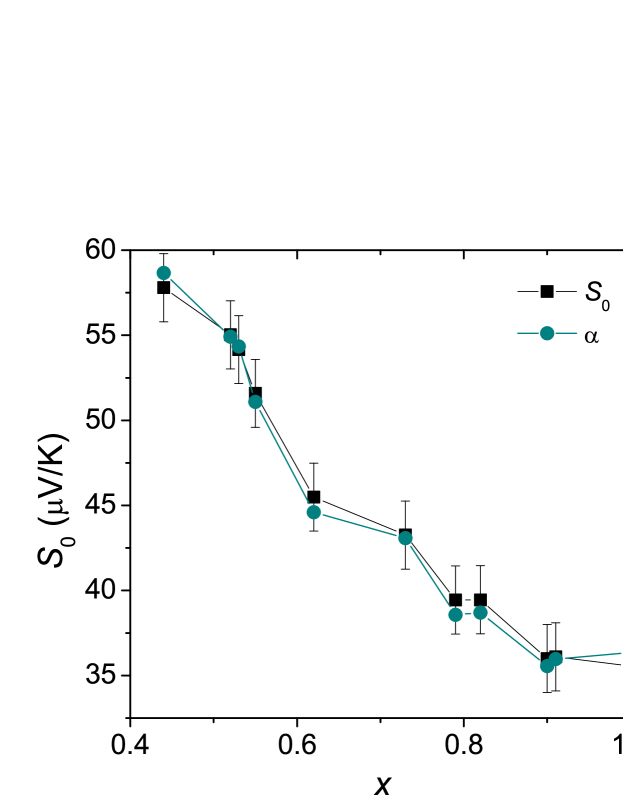
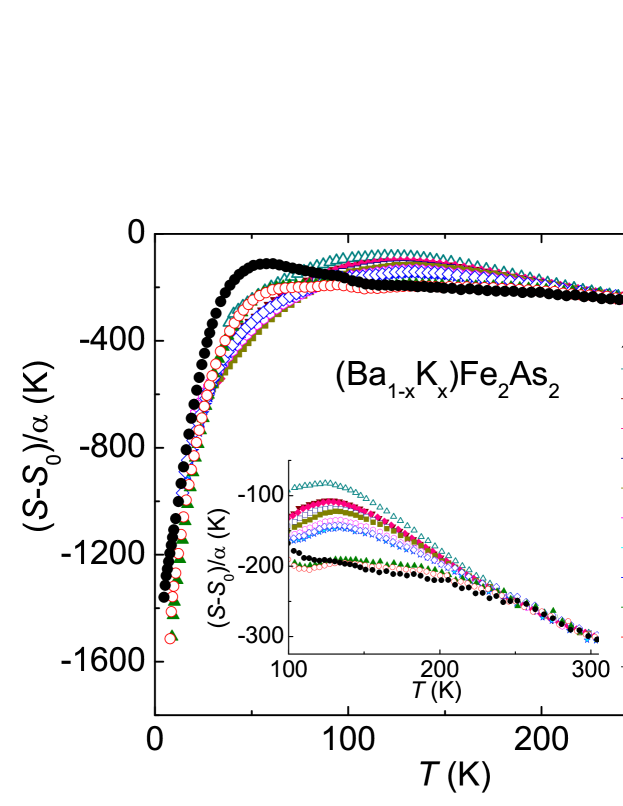
The TEP data above can be analysed in a yet another way: for example, for high- cupratesMandal et al. (1996); Kim et al. (2004), the scaling of the data based on the linear fit of the high temperature TEP data was done. In order to scale the data in a manner similar to high- cuprates, we performed a linear fit, = - , to the vs data over the temperature range 250 K 300 K. Figure 6 shows and as a function of K-concentration. The evolutions of and the slope with the increase of K content are similar and rather monotonic. However, two breaks in the slope at 0.6 and 0.9 can be seen and are at similar -values discussed above. The scaling of the data to the high-temperature slope, , is shown in Fig. 7. It worth noting that below 250 K, the data are split into two manifolds at 0.8 - 0.9, again emphasizing some change in the TEP associated with this doping level. This split into two manifolds further supports the conclusion that 0.8-0.9 is a critical concentration range. We think that these observations indicate a change in the Fermi surface topology and are consistent with or related to the BNC scaling deviationBud’ko et al. (2013) that was observed in the specific heat measurements, prediction of the Lifshitz transition by the band structure calculationsKhan and Johnson (2014), ARPES measurementsXu et al. (2013); Ota et al. (2014) and with the change in the superconducting gap symmetry as observed by thermal conductivity and penetration depthWatanabe et al. (2014) measurements.
V Conclusion
We measured thermoelectric power on (Ba1-xKx)Fe2As2 single crystals in the over-doped side of the phase diagram, 0.44 1. We observe a minimum in the vs at 0.55 that can be associated with the change in the topology of the Fermi surface, significant changes in the electronic structure, correlations, and/or scattering. This feature is clearly observable below 75 K and a higher temperature smears it out. Also, shows a change in the 0.8 - 0.9 range, where a broad maximum in evolves into a plateau, seen better in the contour plot of as an evolution of the red-yellow high region into a green region. In addition, the scaled thermoelectric power data are separated into two manifolds at high temperature at 0.8 - 0.9 range as well. The features seen in the TEP measurement are consistent with the Lifshitz transitions observed by ARPES measurements,, the Lifshitz transition at 0.55 may be associated with the shift of the electron pockets at the point above the Fermi levelMalaeb et al. (2012) and the Lifshitz transition at 0.8 - 0.9 may be associated with the transformation of the hole pockets near the point into ”four blades”Xu et al. (2013) or other significant changes of the electronic structure or correlations might occur.
VI ACKNOWLEDGEMENTS
The authors would like to thank R. Prozorov and M. A. Tanatar for bringing our attention to the possibility of these measurements; B. Coles for pointing out the versatility of this measurement technique; H. Kim, V. Taufour and M. Sailer for useful discussions. This work was supported by the U.S. Department of Energy (DOE), Office of Science, Basic Energy Sciences, Materials Science and Engineering Division. The research was performed at the Ames Laboratory, which is operated for the U.S. DOE by Iowa State University under contract DE-AC02-07CH11358. E. Mun was supported by the AFOSR-MURI grant No. FA9550-09-1-0603.
References
- Kamihara et al. (2008) Y. Kamihara, T. Watanabe, M. Hirano, and H. Hosono, J. Am. Chem. Soc. 130, 3296 (2008).
- Canfield and Bud’ko (2010) P. C. Canfield and S. L. Bud’ko, Annu. Rev. Condens. Matter Phys. 1, 27 (2010).
- Mandrus et al. (2010) D. Mandrus, A. S. Sefat, M. A. McGuire, and B. C. Sales, Chem. Mater. 22, 715 (2010).
- Ni and Bud’ko (2011) N. Ni and S. L. Bud’ko, MRS Bulletin 36, 620 (2011).
- Rotter et al. (2008a) M. Rotter, M. Tegel, and D. Johrendt, Phys. Rev. Lett. 101, 107006 (2008a).
- Avci et al. (2012) S. Avci, O. Chmaissem, D. Y. Chung, S. Rosenkranz, E. A. Goremychkin, J. P. Castellan, I. S. Todorov, J. A. Schlueter, H. Claus, A. Daoud-Aladine, D. D. Khalyavin, M. G. Kanatzidis, and R. Osborn, Phys. Rev. B 85, 184507 (2012).
- Mazin and Schmalian (2009) I. Mazin and J. Schmalian, Physica C 469, 614 (2009).
- Kemper et al. (2010) A. F. Kemper, T. A. Maier, S. Graser, H.-P. Cheng, P. J. Hirschfeld, and D. J. Scalapino, New J. Phys. 12, 073030 (2010).
- Hirschfeld et al. (2011) P. J. Hirschfeld, M. M. Korshunov, and I. I. Mazin, Rep. Prog. Phys. 74, 124508 (2011).
- Chubukov (2012) A. Chubukov, Ann. Rev. Cond. Matt. Phys. 3, 57 (2012).
- Liu et al. (2008) C. Liu, G. D. Samolyuk, Y. Lee, N. Ni, T. Kondo, A. F. Santander-Syro, S. L. Bud’ko, J. L. McChesney, E. Rotenberg, T. Valla, A. V. Fedorov, P. C. Canfield, B. N. Harmon, and A. Kaminski, Phys. Rev. Lett. 101, 177005 (2008).
- Sato et al. (2009) T. Sato, K. Nakayama, Y. Sekiba, P. Richard, Y.-M. Xu, S. Souma, T. Takahashi, G. F. Chen, J. L. Luo, N. L. Wang, and H. Ding, Phys. Rev. Lett. 103, 047002 (2009).
- Yoshida et al. (2011) T. Yoshida, I. Nishi, A. Fujimori, M. Yi, R. Moore, D.-H. Lu, Z.-X. Shen, K. Kihou, P. Shirage, H. Kito, C. Lee, A. Iyo, H. Eisaki, and H. Harima, J. Phys. Chem. Solids 72, 465 (2011).
- Xu et al. (2011) Y.-M. Xu, Y.-B. Huang, X.-Y. Cui, E. Razzoli, M. Radovic, M. Shi, G.-F. Chen, P. Zheng, N.-L. Wang, C.-L. Zhang, P.-C. Dai, J.-P. Hu, Z. Wang, and H. Ding, Nat. Phys. 7, 198 (2011).
- Nakayama et al. (2011) K. Nakayama, T. Sato, P. Richard, Y.-M. Xu, T. Kawahara, K. Umezawa, T. Qian, M. Neupane, G. F. Chen, H. Ding, and T. Takahashi, Phys. Rev. B 83, 020501 (2011).
- Richard et al. (2011) P. Richard, T. Sato, K. Nakayama, T. Takahashi, and H. Ding, Rep. Progr. Phys. 74, 124512 (2011).
- Okazaki et al. (2012) K. Okazaki, Y. Ota, Y. Kotani, W. Malaeb, Y. Ishida, T. Shimojima, T. Kiss, S. Watanabe, C.-T. Chen, K. Kihou, C. H. Lee, A. Iyo, H. Eisaki, T. Saito, H. Fukazawa, Y. Kohori, K. Hashimoto, T. Shibauchi, Y. Matsuda, H. Ikeda, H. Miyahara, R. Arita, A. Chainani, and S. Shin, Science 337, 1314 (2012).
- Malaeb et al. (2012) W. Malaeb, T. Shimojima, Y. Ishida, K. Okazaki, Y. Ota, K. Ohgushi, K. Kihou, T. Saito, C. H. Lee, S. Ishida, M. Nakajima, S. Uchida, H. Fukazawa, Y. Kohori, A. Iyo, H. Eisaki, C.-T. Chen, S. Watanabe, H. Ikeda, and S. Shin, Phys. Rev. B 86, 165117 (2012).
- Xu et al. (2013) N. Xu, P. Richard, X. Shi, A. van Roekeghem, T. Qian, E. Razzoli, E. Rienks, G.-F. Chen, E. Ieki, K. Nakayama, T. Sato, T. Takahashi, M. Shi, and H. Ding, Phys. Rev. B 88, 220508 (2013).
- Ota et al. (2014) Y. Ota, K. Okazaki, Y. Kotani, T. Shimojima, W. Malaeb, S. Watanabe, C.-T. Chen, K. Kihou, C. H. Lee, A. Iyo, H. Eisaki, T. Saito, H. Fukazawa, Y. Kohori, and S. Shin, Phys. Rev. B 89, 081103 (2014).
- Lifshitz (1960) I. M. Lifshitz, Sov. Phys. JETP 11, 1130–1135 (1960).
- Bud’ko et al. (2009) S. L. Bud’ko, N. Ni, and P. C. Canfield, Phys. Rev. B 79, 220516 (2009).
- Bud’ko et al. (2013) S. L. Bud’ko, M. Sturza, D. Y. Chung, M. G. Kanatzidis, and P. C. Canfield, Phys. Rev. B 87, 100509 (2013).
- Stewart (2011) G. R. Stewart, Rev. Mod. Phys. 83, 1589 (2011).
- Khan and Johnson (2014) S. N. Khan and D. D. Johnson, Phys. Rev. Lett. 112, 156401 (2014).
- Watanabe et al. (2014) D. Watanabe, T. Yamashita, Y. Kawamoto, S. Kurata, Y. Mizukami, T. Ohta, S. Kasahara, M. Yamashita, T. Saito, H. Fukazawa, Y. Kohori, S. Ishida, K. Kihou, C. H. Lee, A. Iyo, H. Eisaki, A. B. Vorontsov, T. Shibauchi, and Y. Matsuda, Phys. Rev. B 89, 115112 (2014).
- Yan et al. (2010) Y. J. Yan, X. F. Wang, R. H. Liu, H. Chen, Y. L. Xie, J. J. Ying, and X. H. Chen, Phys. Rev. B 81, 235107 (2010).
- Liu et al. (2014) Y. Liu, M. A. Tanatar, W. E. Straszheim, B. Jensen, K. W. Dennis, R. W. McCallum, V. G. Kogan, R. Prozorov, and T. A. Lograsso, Phys. Rev. B 89, 134504 (2014).
- Ni et al. (2008) N. Ni, S. L. Bud’ko, A. Kreyssig, S. Nandi, G. E. Rustan, A. I. Goldman, S. Gupta, J. D. Corbett, A. Kracher, and P. C. Canfield, Phys. Rev. B 78, 014507 (2008).
- (30) ftp://ftp.ansto.gov.au/pub/physics/neutron/rietveld/RieticaLHPM95 .
- Rotter et al. (2008b) M. Rotter, M. Pangerl, M. Tegel, and D. Johrendt, Angew. Chem. Int. Ed. 47, 7949 (2008b).
- Mun et al. (2010) E. Mun, S. L. Bud’ko, M. S. Torikachvili, and P. C. Canfield, Meas. Sci. Technol. 21, 055104 (2010).
- Hodovanets et al. (2013) H. Hodovanets, A. Thaler, E. Mun, N. Ni, S. L. Bud’ko, and P. C. Canfield, Phil. Mag. 93, 661 (2013).
- Hardy et al. (2013) F. Hardy, A. E. Böhmer, D. Aoki, P. Burger, T. Wolf, P. Schweiss, R. Heid, P. Adelmann, Y. X. Yao, G. Kotliar, J. Schmalian, and C. Meingast, Phys. Rev. Lett. 111, 027002 (2013).
- (35) V. Taufour, N. Foroozani, J. Lim, M. A. Tanatar, U. Kaluarachchi, S. K. Kim, Y. Liu, T. A. Lograsso, V. G. Kogan, R. Prozorov, S. L. Bud’ko, J. S. Schilling, and P. C. Canfield, arXiv:1402.7054 .
- Blatt et al. (1976) F. J. Blatt, P. A. Schroeder, C. L. Foiles, and D. Greig, Thermoelectric Power of Metals (Plenum Press, New York, 1976).
- Terashima et al. (2009) T. Terashima, M. Kimata, H. Satsukawa, A. Harada, K. Hazama, S. Uji, H. Harima, G.-F. Chen, J.-L. Luo, and N.-L. Wang, J. Phys. Soc. Jpn. 78, 063702 (2009).
- Liu et al. (2013) Y. Liu, M. A. Tanatar, V. G. Kogan, H. Kim, T. A. Lograsso, and R. Prozorov, Phys. Rev. B 87, 134513 (2013).
- Blanter et al. (1994) Y. Blanter, M. Kaganov, A. Pantsulaya, and A. Varlamov, Phys. Rep. 245, 159 (1994).
- Varlamov et al. (1989) A. Varlamov, V. Egorov, and A. Pantsulaya, Adv. Phys. 38, 469 (1989).
- Hodovanets et al. (2011) H. Hodovanets, E. D. Mun, A. Thaler, S. L. Bud’ko, and P. C. Canfield, Phys. Rev. B 83, 094508 (2011).
- Mun et al. (2009) E. D. Mun, S. L. Bud’ko, N. Ni, A. N. Thaler, and P. C. Canfield, Phys. Rev. B 80, 054517 (2009).
- (43) http://www.originlab.com/index.aspx?go=Products/Origin/Graphing/Contour .
- Mandal et al. (1996) J. B. Mandal, A. N. Das, and B. Ghosh, J. Phys. Cond. Matter 8, 3047 (1996).
- Kim et al. (2004) J. Kim, B. Kim, D. Kim, and Y. Park, J. Supercond. 17, 151 (2004).