Extraction Method of Fine Granular Performance from Scintillator Strip Electromagnetic Calorimeter
Abstract
We describe an algorithm which has been developed to extract fine granularity information from an electromagnetic calorimeter with strip-based readout. Such a calorimeter, based on scintillator strips, is being developed to apply particle flow reconstruction to future experiments in high energy physics. Tests of this algorithm in full detector simulations, using strips of size 45 5 mm2 show that the performance is close to that of a calorimeter with true 5 5 mm2 readout granularity. The performance can be further improved by the use of 10 10 mm2 tile-shaped layers interspersed between strip layers.
1 Introduction
In the experiments being designed for next generation electron-positron colliders, the particle flow approach (PFA)[1, 2] is the leading candidate to achieve the excellent jet energy resolution required to fully exploit the possibilities afforded by the colliders’ well-defined initial and clean final states. In PFA, the energy of charged particles is measured by the tracking system, which has a much better momentum resolution than the energy resolution of calorimeters. The calorimeters are used to estimate the energy of only neutral particles. In order to apply this approach, the calorimetric showers of each particle must be individually reconstructed. The granularity of calorimeter readout is therefore a key issue.
As an example, the sampling electromagnetic calorimeter (ECAL) being designed for the International Large Detector (ILD, a detector being designed for use at the International Linear Collider (ILC) [3]) is required to have a lateral segmentation of 5 5 mm2 and 20 - 30 longitudinal samplings, giving a total of readout channels. One technology being developed to achieve this high calorimeter granularity is based on plastic scintillator strips individually read out by miniature photon detectors, for example pixelated photon detectors (PPD).
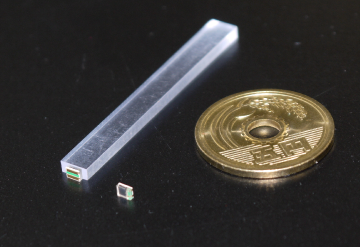
The use of long scintillator strips rather than tiles of size 5 5 mm2 makes the design of such an ECAL more feasible, and reduces its cost, due to the reduced number of readout channels. Successive ECAL layers have orthogonally aligned strips, giving an effective granularity close to the strip width. The CALICE collaboration has developed and constructed ECAL prototypes based on this technology, using scintillator strips of length 45 mm and width 5 or 10 mm, individually read out by PPDs [4, 5].
This paper presents a reconstruction method which can be used to extract close to 5 5 mm2 effective granularity from such long scintillator strips, and reports on measurements of its performance using events fully simulated in ILD. Details of this detector are given in the next section, the reconstruction procedure is explained in section 3, and section 4 describes the calibration procedure. The position resolution achieved by this method is reported in section 5. Particle separation abilities are reported on and discussed in section 6, and the achieved jet energy resolution in two-jet events is reported and discussed in section 7. Finally we discuss the results in section 8 and summarize this study in section 9.
2 Detector model
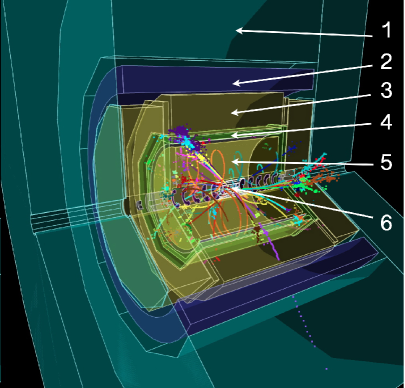
Starting from the interaction point, the ILD consists of a vertex detector, silicon tracking layers, a large time projection chamber (TPC) surrounded by additional silicon tracking detectors, a calorimeter system consisting of electromagnetic and hadronic sections, all placed within a solenoidal magnetic field of strength 3.5 T. The steel return yoke is instrumented to provide muon identification. The basic structure consists of a central, “barrel”, region aligned along the beam axis, closed by two “endcaps” in the forward regions. The ECAL barrel detector has an octagonal cross-section, a length of around 5 m, and an inner radius of 1.85 m. More details of the ILD design can be found in [3]. The ILD is simulated in Mokka [6], a Geant4-based simulation tool [7]. Figure 1 left shows a multiple-jet event simulated in ILD.
The ILD strip-scintillator ECAL (strip-ScECAL) is a sampling calorimeter. In the simulation model used in this study, thirty sensitive layers are interleaved with tungsten plates of thickness 2.1 (4.2) mm in the inner twenty (outer nine) layers. The sensitive layers are tiled with scintillator strips of thickness 1 mm. Strips are aligned orthogonally in successive layers. A dead volume of size mm3 is implemented at the edge of each scintillator to represent the volume occupied by the PPD. In the case of strips shorter than 45 mm, used as references, the PPD thick was scaled by the strip length to avoid large effect due to dead volumes. Each strip is enveloped by a reflective film of thickness 57 m. Printed circuit boards housing the front end electronics and copper heat radiators are included in each layer. The total thickness of such an ECAL is around 200 mm.
Four different scintillator tile configurations were used in this study:
-
1.
5 5 mm2 tiles (“55”);
-
2.
45 5 mm2 strips (“455”);
-
3.
alternating layers of 5 5 mm2 tiles and 45 5 mm2 strips (“”); and
-
4.
alternating layers of 10 10 mm2 tiles and 45 5 mm2 strips (“”).
Successive strip layers were always orthogonally aligned. An HCAL based on forty layers of 30 mm 30 mm 3 mm scintillator tiles interleaved with 20 mm iron absorbers was simulated in this study.
3 Strip Splitting Algorithm
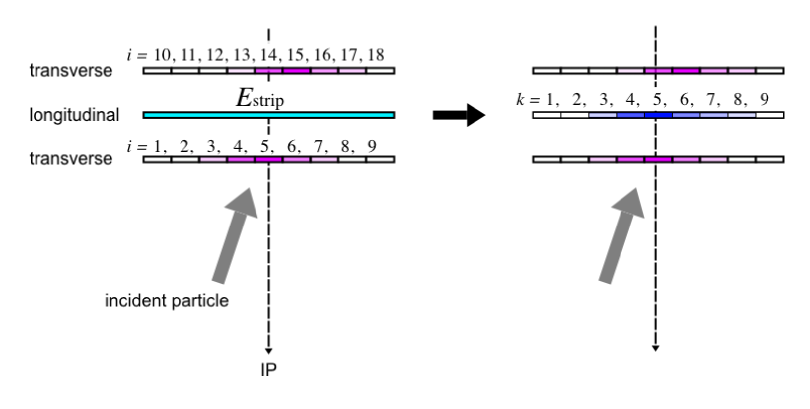
A simple algorithm, the Strip Splitting Algorithm (SSA), has been developed to extract fine granularity information from long strip geometry. Each strip is split into virtual cells along its length; is chosen to result in approximately square virtual cells, as an example, a 45 5 mm2 strip is split into nine 5 5 mm2 cells. The total energy detected by the strip is then distributed among the virtual cells according to the weights estimated by using the energy deposited on the strips in immediately neighboring layers, having intersection with the strip being considered, when seen from the interaction point of ILD. Consequently, the energy deposited on the virtual cell is estimated as,
| (1) |
where is the index of the virtual cell within the strip, is the index of neighboring intersecting strips, and is the energy deposited in the strip having intersection in the range of virtual cell . Figure 2 shows a schematic of the SSA procedure.
In the case of the model, the 10 10 mm2 tile is first split into virtual cells. The neighboring strip layers are used to decide how to partition the tile’s energy among the virtual cells. In a second step, these virtual cells (originating from the 10 10 mm2 tiles) are used to decide the partitioning of energy among strips’ virtual cells. Although the use of 5 5 mm2 interleaving layers means that the presence of orthogonally aligned strip layers is no longer used, it is used again when tiles are larger than 5 5 mm2 in this way.
Events were analyzed using a particle flow reconstruction algorithm. In the results presented later in this paper, the PandoraPFA algorithm[1, 8] was used to analyze events, together with other standard ILD reconstruction programs (e.g. for tracking) in the MarlinReco[9] package. PandoraPFA uses as input the energy and position of calorimeter deposits. When SSA was used, the centre of each virtual cell and its assigned energy were used; when no SSA was used, the central position and total energy of each strip were used.
4 Calibration
The calorimeter was calibrated by studying the energy deposited by 10 GeV photons for the electromagnetic response, and 10 GeV neutral long lived Kaons () for the hadronic response. Particles were injected from the IP in a direction almost perpendicular to the beam-line (in order to avoid the central electrode of TPC) and uniformly distributed in azimuth. The calibration factors used to convert between the energy deposited in the scintillator and that deposited in the whole calorimeter were chosen to give a mean energy, after PFA reconstruction, equal to the incident particle energy.
Hadronic showers can start in ECAL, because the ScECAL has a nuclear interaction length of 0.8 , and electromagnetic showers can have tail in HCAL. In those cases hadrons deposit the shower energy in ECAL with a ratio different from the electromagnetic shower, and vice versa. Thus the correction factors are defined for ECAL and HCAL respectively and optimized to give a best jet energy resolution [10].
The ECAL was re-calibrated for each ECAL configuration, while a single HCAL calibration was used for all configurations.
5 Position of clusters
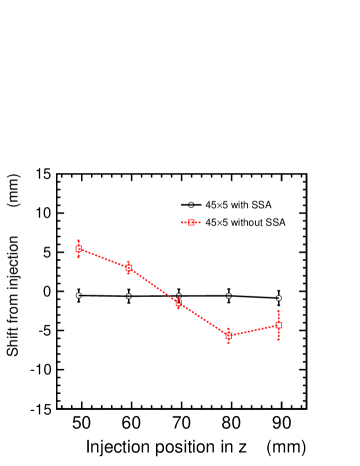
The precise reconstruction of cluster positions is important in PFA analysis to ensure good matching between tracks and calorimeter clusters. In this study, 10 GeV photons were fired into the 455 ECAL from the IP, varying the ECAL injection position along the direction, where we use a cylindrical coordinate system with its axis aligned along the beam line. The injected position was taken to be the intersection on the ECAL front face of the line joining the reconstructed cluster position222 The position of a calorimetric cluster is defined as the energy-weighted mean position of its constituent hits. and the IP. Figure 3 shows the difference between the reconstructed and true photon injection positions, as a function of the injected position. The size of the vertical error bars reflects the width of the reconstructed position distribution.
When SSA is not used, a strong position-dependent bias of up to 5 mm is observed, corresponding to cases when the photon shower passes near the ends or centre of a strip ( mm corresponds to the centre of strips aligned along the axis). When SSA is used, these biases are almost completely removed, and cluster positions are reconstructed to better than 1 mm.
6 Two-particle separation
6.1 - separation
Di-muon events provide a sensitive system for measuring two-particle separation in different ScECAL designs. Two like-sign muons of momentum 10 GeV with identical small differences in azimuthal and polar angles were injected into the detector at almost normal incidence to the beam-line. The resulting simulated events were analyzed using SSA and PandoraPFA.
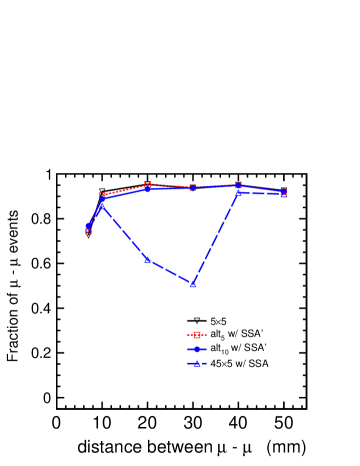
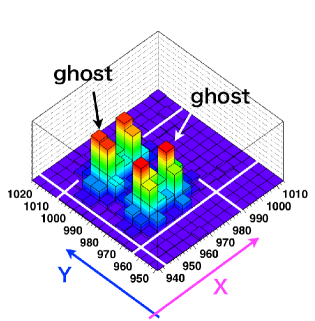
Figure 4 left shows the fraction of such events in which two muons were correctly identified, as a function of the distance between the entry points of the two muons into the ScECAL. Apart from the 455 strip-ScECAL with the use of SSA, all types of ScECAL have greater than 90% of correctly reconstructed events when the distance between the two muons is larger than 10 mm. In the case of the 455 strip-ScECAL with the use of SSA, the fraction depends strongly on the position, with a minimum at a distance of 30 mm. This is due to the formation of ghost tracks: the possibility of two-fold ambiguities arising in reconstruction when two particles enter a square region with size smaller than the strip length. Such cases can lead to the formation of “ghost” clusters. Figure 4 right illustrates such a case in which two injected photons have produced two additional ghost clusters. At a separation of 30 mm, around 25% of di-muon events in the 455 strip-ScECAL have a single additional reconstructed ghost track, and a further 25% have two ghost tracks. At distances below 30 mm, ghost tracks become more difficult to resolve, and are more often combined with a true track. At a separation of 7 mm, the correctly identified fraction drops to around 70% for all ScECAL configuration due to the merging of nearby clusters.
The use of interleaved tile layers removes the ambiguities leading to ghosts, and dramatically improves the situation, giving a performance comparable to that of a tile-based ScECAL.
6.2 reconstruction to study two-photon separation
A meson decays almost immediately into two photons, which can be reconstructed using only calorimeter information. The energy has a strong influence on the opening angle between the two photons, and variations in the decay angle give rise to different photon energies in the laboratory frame. Sample of decays at different energies are therefore a powerful tool to measure ECAL performance, both in terms of pattern recognition (the ability to identify two clusters), and energy resolution (by considering the invariant mass of identified clusters).
Figure 5 shows the fraction of events in which one, two, and more than two photons are reconstructed in the ScECAL. The number of events with no reconstructed photons is less than 0.5% for all energies. In around nine percent of events, at least one of the photons from decay converts before reaching the ECAL. All ScECAL geometries, including the 55 ScECAL, show similar behavior. This indicates that the increasing rate of mis-reconstruction with energy is due to both the merging of photons into a single cluster and the fragmentation of photon clusters.
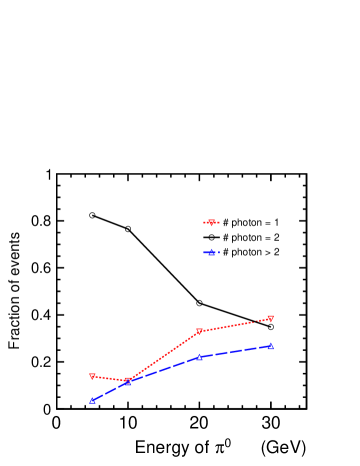
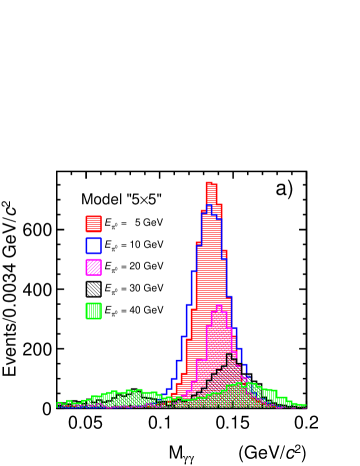
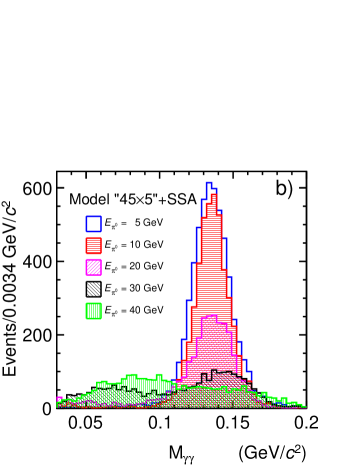
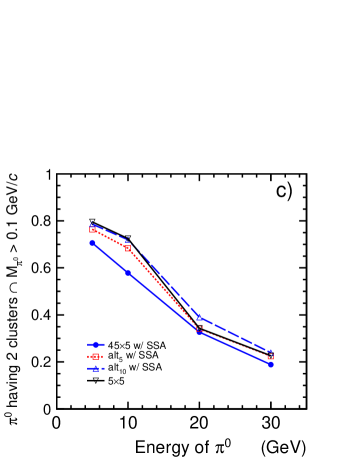
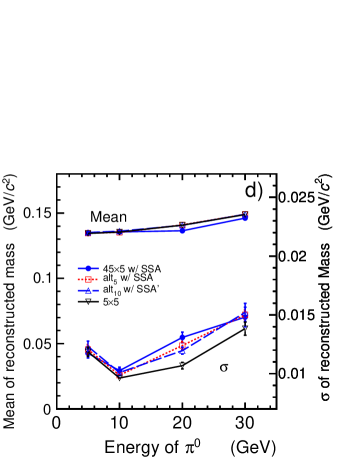
Figure 6 shows various characteristics of events in which exactly two photon-like clusters were identified. Figure 6a (6b) shows the reconstructed invariant mass of such events at different energies in a 55 tile-ScECAL (455 strip-ScECAL with SSA). Figure 6c shows the fraction of events which have exactly two identified photon-like clusters with a reconstructed invariant mass greater than 0.1 GeV/, for the four ScECAL geometries considered. The use of alternate tile layers improves the performance compared to a purely strip-based geometry, as was also seen in the case of di-muon events.
Figure 6d shows the means and standard deviations of Gaussian fits to the M spectra for of different energies, reconstructed in different ScECAL geometries. SSA was used in all models except the 55 tile-ScECAL.
These studies show that some level of reconstruction is possible at energies of up to 30 GeV. No large performance differences were seen between the four considered ECAL geometries.
7 Jet energy resolution
7.1 Energy spectrum
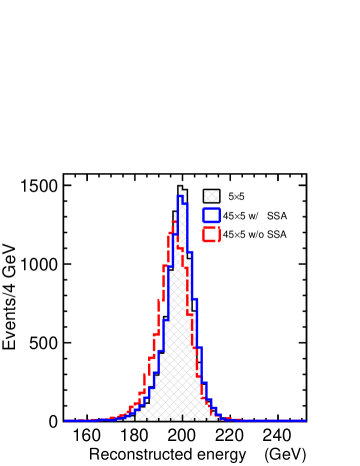
The jet energy resolution was measured by analyzing () events generated at centre-of-mass energies of 91.2, 200, 360, and 500 GeV. These events were fully simulated in the ILD simulation described earlier, and reconstructed using MarlinReco, including SSA and PandoraPFA. Figure 7 shows the total reconstructed energy () at a center-of-mass energy of 200 GeV when using the 55 and 455 Sc-ECAL models, with and without the use of SSA. The shape of the energy spectrum for the 455 Sc-ECAL is noticeably improved by the use of SSA, and comes close to that of the 55 model.
To estimate the jet energy resolution, the “RMS90” measure is used. Only events in the barrel region (absolute values of cosine of the angle between original quarks known from the simulation information and beam line 0.7) are considered, and “RMS90” is defined as the root mean square of the events lying within the smallest range of which contains 90% of events.
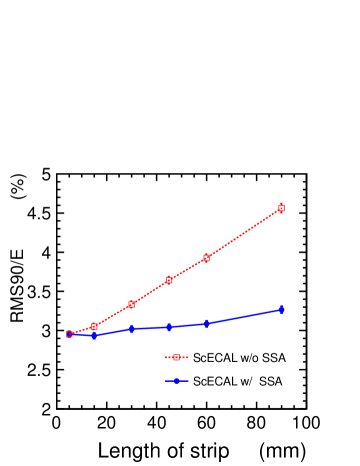
7.2 Dependence on strip length
The dependence of the jet energy resolution at a center-of-mass energy of 200 GeV on the strip length is shown in Fig. 8. The same strip width of 5 mm was used in all models. The strong degradation in performance seen when SSA is not used is almost completely mitigated by the use of SSA. The difference in jet energy resolution between an ScECAL using 55 tiles and one using strips of length up to 60 mm is almost negligible.
7.3 Comparison of 55, 455, and 1515 ScECAL models
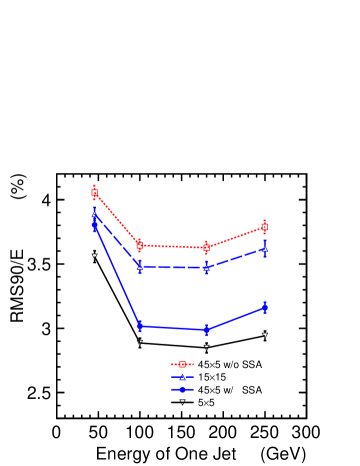
Figure 9 shows the jet energy resolution as a function of jet energy for a 455 strip-ScECAL without and with SSA, and 1515 and 55 tile-ScECAL models. At smaller jet energies, below 100 GeV, the jet energy resolution is dominated by the intrinsic single-particle resolution, giving a resolution which improves with increasing energy333 of 3.5% at 50 GeV and 2.9% at 100 GeV is not consistent with behavior. Probably, the confusion term starts to significant even below 100 GeV. . At energies above 100 GeV, the confusion between charged and neutral calorimeter clusters starts to become significant, leading to a degradation of resolution with increasing energy [1]. This behavior is seen for all ScECAL geometries. The jet energy of the 455 strip-ScECAL is significantly improved by using SSA, especially at energies above 100 GeV, indicating that the confusion is decreased by SSA. A tile of 1515 has the same area as a 455 strip, however it is clear that the jet energy resolution when using the strip geometry is significantly better (by up to 0.5%), demonstrating the real merit of a strip-based geometry used in conjunction with SSA. The degradation in jet energy resolution between the 55 and 455 (with SSA) models is rather small, less than 0.25% for 45 GeV jets, and around 0.1% for jets between 100 and 200 GeV.
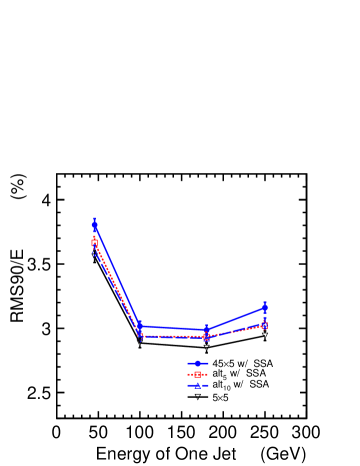
7.4 Jet energy resolution of strip-tile-ScECAL
As discussed in section 6.1, the major problem faced by a strip-based ECAL is the formation of ghost clusters. Therefore, the use of interleaving tile layers is expected to improve the jet energy resolution.
Figure 10 compares the jet energy resolutions of 455, , and models. The performance of the and models are almost identical. At jet energies of up to 100 GeV, they give almost the same performance as the 55 model, while at higher energies the performance lies approximately half way between the 55 and 455 models.
8 Discussion
SSA successfully extracts fine granularity information, at an effective scale close to that of the strip width, from a strip-based calorimeter. The small degradation in jet energy resolution, around 0.2%, when going from a 55 tile-ScECAL to a 455 strip-ScECAL can be almost completely recovered by the use of tile layers interleaved between the strip layers. These tile layers prevent the formation of ghost hits, as has been demonstrated in the reconstruction of a simple di-muon system.
Tile layers with a granularity of 10 10 mm2 have been shown to work well. The use of such a tile size is technically feasible. The use of 1515 mm2 tiles, which have the same area as the 45 5 mm2 strips currently being used in a prototype ScECAL, and therefore the same density of readout electronics, are certainly technically feasible. Studies of reconstruction performance with such larger tiles are continuing. The use of scintillator-based 5 5 mm2 layers is technically difficult at present, but a different technology, such as the silicon readout ECAL being developed by CALICE [11], could be used.
The strip scintillator technology for ECAL presented in this paper could also be applicable for the hadron calorimeter. It must be a challenging and worthwhile research to apply this method to more complicated topology of hadronic showers.
9 Summary
An algorithm (“SSA”) to extract fine granularity from scintillator strips was developed and tested. The energy resolution for jets of up to 250 GeV was compared among several types of ScECAL: ScECAL with 45 5 mm2 scintillator strips, and with such layers alternately replaced with 5 5 mm2 or 10 10 mm2 tile layers. Differences in the obtained jet energy resolutions when using a 55 tile-ScECAL and 455 strip-ScECAL with SSA reconstruction ranged from 0.15% to 0.25%. This difference can be removed for jet energies below 100 GeV, or decreased to 0.1% for jet energies in the range 150 - 250 GeV, by alternately replacing strip layers with tile layers.
Acknowledgments
The authors would like to thank to ILD group for providing essential simulation (Mokka) and analysis tools (Marlin and PandoraPFA), and for useful discussions. John Marshall has given invaluable advice on the tuning and calibration of the PandoraPFA algorithm. Members of the CALICE collaboration, in particular the CALICE-ASIA group, have also contributed to many important discussions. This work is supported in part by ‘grant-in-aid for specially promoted research: a global research and development program of a state-of-the-art detector system for the ILC’ of the Japan Society for Promotion of Science (JSPS).
References
- [1] M. Thomson, NIM, A611, 25 (2009).
- [2] Jean-Claude Brient and Henri Videau. The Calorimetry at the future e+ e- linear collider. eConf, C010630:E3047, 2001.
- [3] Ties Behnke, James E. Brau, Philip N. Burrows, Juan Fuster, Michael Peskin, et al. The International Linear Collider Technical Design Report - Volume 4: Detectors. 2013.
- [4] CALICE Collaboration, arXiv:1311.3761 to be published in NIM-A.
- [5] K. Kotera, Procceedings of LCWS2011, Granada: arXiv:1201.6098v2.
- [6] Mokka Homepage, http://polzope.in2p3.fr:8081/MOKKA.
- [7] S. Agostinelli et al., NIM, A506, 250 (2003).
- [8] J. Marshall and M. Thomson, Procceedings of CHEF2013, Paris: arXiv:1308.4537.
- [9] MarlinReco Homepage, http://ilcsoft.desy.de/portal/software/packages/marlinreco.
-
[10]
J. Marshall, http://indico.cern.ch/getFile.py/access?contribId=11
&sessionId=8&resId=0&materialId=slides&confId=267137. - [11] C. Adloff et al., NIM, A608, 372 (2009).