Influence of conformational molecular dynamics on matter wave interferometry
Abstract
We investigate the influence of thermally activated internal molecular dynamics on the phase shifts of matter waves inside a molecule interferometer. While de Broglie physics generally describes only the center-of-mass motion of a quantum object, our experiment demonstrates that the translational quantum phase is sensitive to dynamic conformational state changes inside the diffracted molecules. The structural flexibility of tailor-made hot organic particles is sufficient to admit a mixture of strongly fluctuating dipole moments. These modify the electric susceptibility and through this the quantum interference pattern in the presence of an external electric field. Detailed molecular dynamics simulations combined with density functional theory allow us to quantify the time-dependent structural reconfigurations and to predict the ensemble-averaged square of the dipole moment which is found to be in good agreement with the interferometric result. The experiment thus opens a new perspective on matter wave interferometry as it demonstrates for the first time that it is possible to collect structural information about molecules even if they are delocalized over more than hundred times their own diameter.
pacs:
03.75.Dg, 03.65.VfMolecule interferometry is a natural extension of earlier coherence experiments with electrons Hasselbach (2010), neutrons Rauch and Werner (2000) or atoms Estermann and Stern (1930); Cronin et al. (2009). A quest for potential limits of the quantum superposition principle Arndt and Hornberger (2009) has recently led to the development of near-field interferometers for complex molecules Clauser and Li (1994); Brezger et al. (2002); Gerlich et al. (2007). The term de Broglie interference usually describes the physics of the center-of-mass motion of a quantum particle. This is why earlier work often emphasized the need for an effective decoupling of the internal states from the external motion Kokorowski et al. (2001); Hackermüller et al. (2004).
The phase of the translational wavefunction can, however, also be influenced by the interaction between the particle’s electromagnetic properties and the environment: Matter waves were successfully used for characterizing the van der Waals forces in the diffraction of atoms Brühl et al. (2002); Perreault and Cronin (2005) and molecules Nairz et al. (2003) at nanofabricated gratings. The combination of electric beam deflection Antoine et al. (1999); Knickelbein (2001) with quantum interference Brezger et al. (2002) also showed a new way to measure, for instance, the scalar static Berninger et al. (2007) and optical polarizability of large molecules Hackermüller et al. (2007); Gerlich et al. (2008).
In our present work we demonstrate the influence of the internal configurational dynamics of floppy long molecules on the interference fringe shift inside a near-field matter-wave interferometer. We investigate, in particular, the relevance of the thermally activated internal dynamics for the de Broglie phase evolution in an inhomogeneous electric field.
The general outline of the experiment is as follows: Perfluoroalkyl-functionalized azobenzenes, C30H12F30N2O4, were tailor-made to prepare objects of high mass, high vapor pressure and high structural flexibility. The purified compound was characterized by nuclear magnetic resonance spectroscopy, mass spectrometry and UV/vis and IR-spectroscopy Gerlich et al. (2007). The neutral molecules are then evaporated in an effusive source at K which determines the mean velocity, the average internal energy and the molecular folding dynamics in the beam. We use a gravitational filtering scheme Nairz et al. (2000) to select a near-Gaussian velocity distribution that corresponds to a central de Broglie wavelength within the range of pm.
The particles then pass through a Kapitza-Dirac-Talbot-Lau interferometer which consists of a series of three gratings, G1 through G3. The first and third mask are vertical arrays of 75 nm wide slits, etched with a period of about d=266 nm into the supporting SiNx membrane 111grating fabrication: Dr. Tim Savas, MIT Cambridge. The membrane has a thickness of only 190 nm and the two material masks are separated by 210 mm. The diffracting second grating, G2, is realized by a focused standing light wave, i.e. by a retro-reflected laser beam with a wavelength of 532 nm. The diffraction grating imposes a spatially periodic phase onto the matter wave, which is proportional to the product of the laser power and the optical polarizability at the laser frequency Hornberger et al. (2009). This phase is responsible for the interference effect and the observed fringe contrast. The laser beam divides the distance between the two SiNx gratings exactly in half and intersects the molecular beam under 90 degrees with an angular uncertainty of better than 500 rad.
The first grating provides the transverse coherence that is required for near-field interference behind the second grating. The coherent molecular evolution around G2 leads to a particle density pattern, i.e. the interferogram, at the location of G3. An interferogram is then sampled by scanning the position of G3 in steps of nm across the molecular beam while counting all transmitted particles in a quadrupole mass spectrometer. We fit the resulting signal pattern by the theoretically expected , where is the offset of the interference fringe. We determine the experimental quantum fringe visibility as the ratio . But even more importantly we can quantify with rather high accuracy the shift of the fringe , which allows us to extract valuable information about parameters characterizing the internal molecular state distribution. However, it is not allowed to probe the particles in any way that would reveal their position, as this would destroy the interference pattern.
We therefore apply a conservative force and expose the molecules to an external electric field , which is constant in time but inhomogeneous in space. The potential difference across two neighboring interferometer paths imprints a position dependent phase on the matter wave. This results in a shift of the interference pattern at the third grating which reads , where and are the mass and the velocity of the particle. The field is created by a voltage applied to a pair of electrodes between G1 and G2 whose shapes are carefully designed to ensure that is constant within 1 % over the diameter of the molecular beam. Within this region, a particle of electric polarizability will experience the constant force . The quantum fringe shift corresponds quantitatively to the classical beam envelope shift induced by the electric force field. It is, however, important to note that the classical prediction of Moiré-type fringes is negligible in the parameter regime of our experiment with nanostructured grating masks. The observations of the present experiment can therefore only be explained by including the full quantum treatment for the molecular center-of-mass motion.
In the past, the described setting was used to determine static molecular properties of rigid molecules, such as the polarizability of fullerenes Berninger et al. (2007). The present study tackles a more complex phenomenon since we are dealing with extended, structurally flexible particles whose thermally driven configuration dynamics must be accounted for to understand the center-of-mass phase evolution.
As already seen in earlier classical experiments Compagnon et al. (2002) thermally activated vibrations may induce dynamic electric dipole moments even in molecules that are point-symmetric and non-polar in their thermal ground state. If the number of accessible internal states is large the total linear response of the molecule to the E-field is no longer described by the polarizability but rather by the van Vleck expression Van Vleck (1965); Bonin and Kresin (1997) for the electric susceptibility Here, is thermally averaged over the energy landscape that is accessible to the vibronic motion in the absence of the external field at an internal temperature T. As we operate an effusive beam source it is well justified to assume that this rotational and vibrational temperature equals the source temperature of K.
In order to get an estimate for the dependence of the polarizability and dipole moment on the molecular conformation, electronic structure calculations were performed using density functional theory (DFT). The underlying conformational structures were generated by a molecular dynamics simulation (MDS) using the GROMOS package van Gunsteren et al. (1996) and a tailor-made force field 222see supplementary material at DOI: 10.1103/PhysRevA.81.031604 based on a recent parametrization for azobenzene derivatives Böckmann et al. (2007). During the simulation, a single molecule was propagated for a total of 100 ns with a time step of 1 fs following a 100 ps equilibration period. The simulated temperature was controlled by a Berendsen thermostat with a coupling constant of 0.1 ps. Assuming that the MDS time evolution covers the entire conformational phase space, its trajectory represents the statistical ensemble of conformations in the hot molecular beam. Along the trajectory, the molecular structure was extracted every 5 ns and fed into a DFT (B3LYP/6-31+G*) calculation using the Gaussian package Frisch et al. (2003) to obtain the electronic polarizability and the absolute value of the dipole moment.
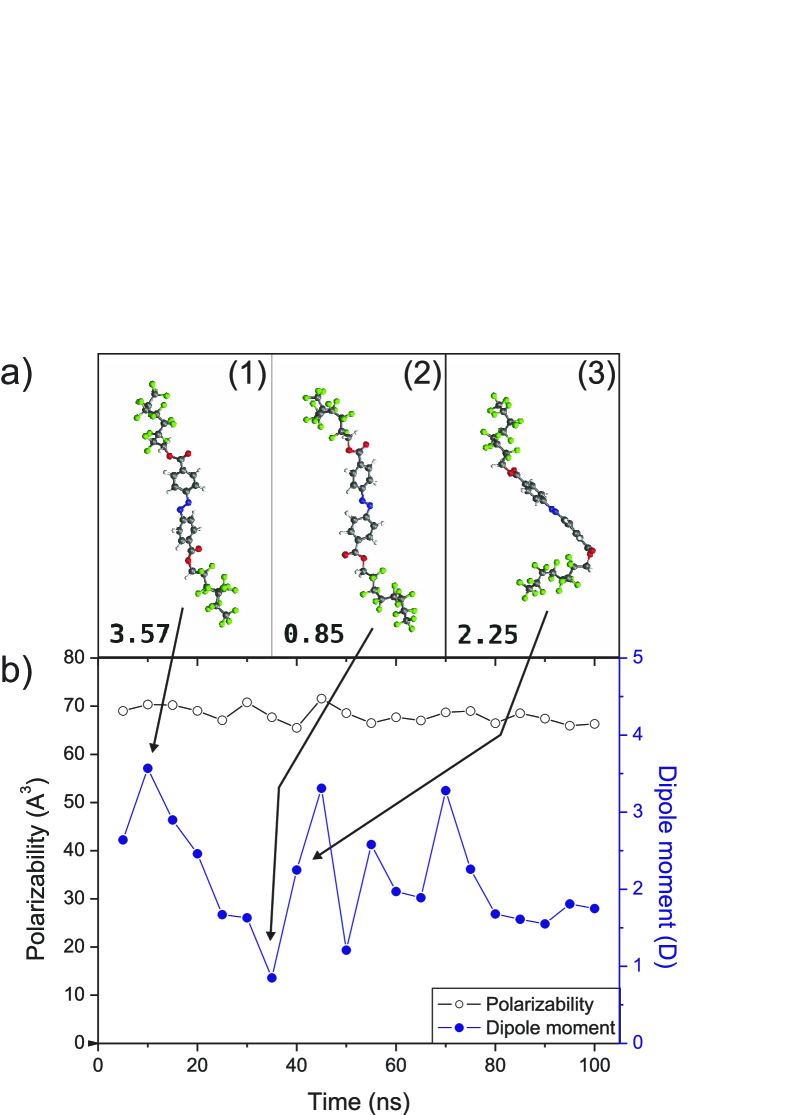
Three of the snapshots are depicted in Fig. 1a together with their total dipole moments. The computed polarizabilities and moments of 20 molecular structures, taken in time steps of 5 ns, are displayed in Fig. 1b. While the polarizability is only mildly affected by the large conformational changes, with an average value of Å, the dipole moment fluctuates strongly between Debye (D) and D. The most relevant structural changes are due to a rotation of the aromatic rings around the N-C bond and a rotation of the alkyl chain around the C-O axis. The simulated values displayed in Fig. 1b thus sum up to a thermally averaged polarizability of Å and a total electric susceptibility of Å.
We estimate the uncertainty of the mean values from our computational sample of size using a t-test where we assume normally distributed variables over the whole MDS trajectory. The true thermal averages of and are contained in the confidence intervals Å3 and Å3 around their respective sample averages. The total confidence interval for the susceptibility is given by Å at a statistical significance level of . The calculation reveals that the molecular susceptibility is substantially larger than the static polarizability alone and that it should be possible to get quantitative information about thermodynamically driven internal molecular dynamics through the van Vleck formula, if both and can be measured independently.
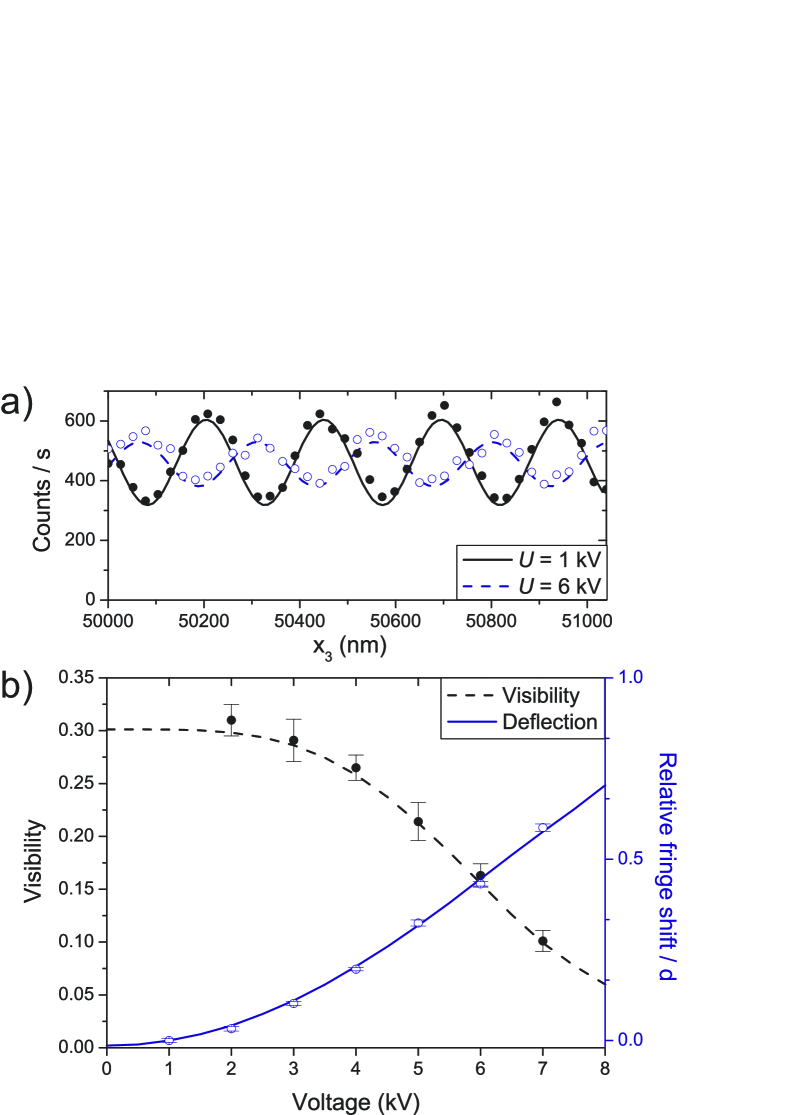
The outcome of the deflection experiment is summarized in the lower panel of Fig. 2 where the mean visibility and the shift of the interference pattern are plotted against the electrode voltage.
After a calibration of the experimental geometry factors using fullerenes Berninger et al. (2007), a fit of the expected and measured fringe shift as a function of the electrode voltage allows us to determine the total susceptibility for the functionalized azobenzenes. We find an experimental value of Å where the first and second uncertainty value represent the statistical and the systematic error respectively. The experimental result is in good agreement with the MDS value Å.
It is important to see that the velocity distribution of the selected thermal beam affects the result in two ways: on the one hand, slow molecules experience a larger phase shift of the fringes than the fast ones. This also explains the slight deviation of the experiment from the quadratic expectation. On the other hand, the dispersiveness of the phase shift also affects the fringe visibility, as shown by the dashed line in the same panel. Both can be accounted for in a quantum calculation based on Hornberger et al. (2009), which is in very good agreement with the observation. The velocity distribution in Fig. 2 is centered on m/s with a width of m/s.
Our setup now also offers, in addition, a unique way for separately measuring the electronic contribution to . In the optical field of the light grating the response of the molecules is no longer influenced by changes in the molecular structure. The nuclear motion is too slow to follow the rapid field oscillations. All structural dipole contributions will therefore be averaged out. Our Kapitza-Dirac-Talbot-Lau interferometer thus allows us to determine the optical molecular polarizability at the grating laser frequency Gerlich et al. (2007).
In atoms is strongly frequency-dependent and differs substantially from the static value. However, in large molecules and in particular in those used here, all molecular absorption lines are concentrated in the ultra-violet region. Hence, the static polarizability is well approximated by the optical polarizability , as also known, for instance, for the case of fullerenes Dresselhaus et al. (1998). We extract from a fit of the theoretical expectation to the measured -curve, i.e. from a plot of the interference fringe visibility as a function of the laser power .
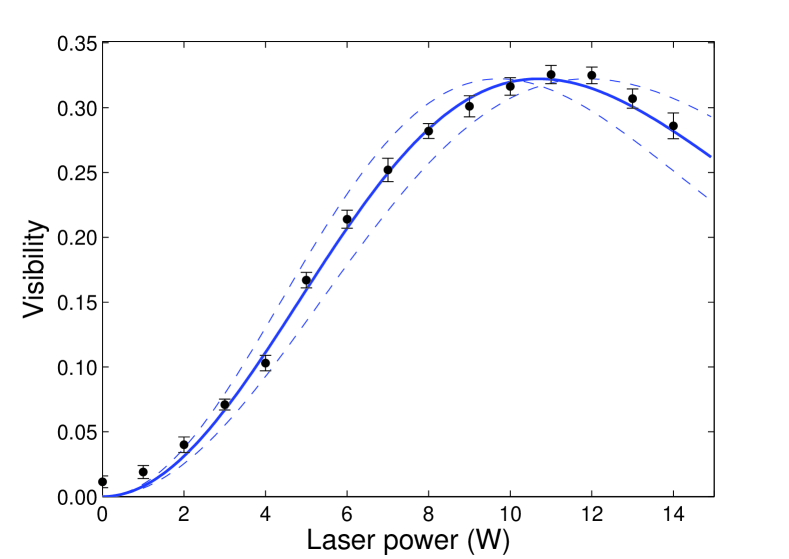
The experimental result is shown as full circles in Fig. 3. It is well reproduced by a quantum calculation Hornberger et al. (2009) which contains the optical polarizability as the only free parameter (solid line). An additional fit that includes a finite optical absorption cross section as a second parameter is consistent with the result cm2, and justifies the omission of this factor. This procedure yields a value of . This agrees, again, with the numerical simulation for the static polarizability, shown in Fig. 1, within the experimental uncertainty. The uncertainty is composed of a statistical (first) and a systematic contribution (second). The first value represents the standard deviation of the experimental scatter in three independent experiments, each composed of two or three measurement runs. The systematic part is determined by possible uncertainties in the overlap between the laser field and the molecular beam, in the velocity distribution and the measurement of the laser power which is known to within . The dashed curves in Fig. 3 simulate the expected power dependence of the fringe visibility for optical polarizabilities 10% above and below the best fit.
Knowing the total susceptibility and the static polarizability we are now able to identify the presence of a dipolar contribution to the total susceptibility. Its value is in good quantitative agreement with the theoretical prediction.
In conclusion, our work shows for the first time, that even pure de Broglie interference allows us to get access to thermally activated time-averaged internal dynamics of molecules.
Our work has been supported by the Austrian Science Funds FWF within the Wittgenstein program Z149-N16 and the doctoral program W1210 CoQuS as well as by the ESF EUROQUASAR Program MIME. The synthesis of the molecular compounds has been supported by the Swiss National Science Foundation (SNSF) and the Innovation Promotion Agency (CTI). MB is funded by the VW Foundation.
References
- Hasselbach (2010) F. Hasselbach, Rep. Prog. Phys. 73, 016101 (2010).
- Rauch and Werner (2000) H. Rauch and A. Werner, Neutron Interferometry: Lessons in Experimental Quantum Mechanics (Oxford University Press, 2000).
- Estermann and Stern (1930) I. Estermann and O. Stern, Z. Phys. 61, 95 (1930).
- Cronin et al. (2009) A. D. Cronin, J. Schmiedmayer, and D. E. Pritchard, Rev. Mod. Phys. 81, 1051 (2009).
- Arndt and Hornberger (2009) M. Arndt and K. Hornberger, in Proceedings of the International School of Physics ”Enrico Fermi”, Vol. 171, edited by B. Deveaud-Plédran, A. Quattropani, and P. Schwendimann (IOS Press, Amsterdam, 2009) p. 103.
- Clauser and Li (1994) J. F. Clauser and S. Li, Phys. Rev. A 49, R2213 (1994).
- Brezger et al. (2002) B. Brezger, L. Hackermüller, S. Uttenthaler, J. Petschinka, M. Arndt, and A. Zeilinger, Phys. Rev. Lett. 88, 100404 (2002).
- Gerlich et al. (2007) S. Gerlich, L. Hackermüller, K. Hornberger, A. Stibor, H. Ulbricht, M. Gring, F. Goldfarb, T. Savas, M. Müri, M. Mayor, and M. Arndt, Nat. Phys. 3, 711 (2007).
- Kokorowski et al. (2001) D. A. Kokorowski, A. D. Cronin, T. D. Roberts, and D. E. Pritchard, Phys. Rev. Lett. 86, 2191 (2001).
- Hackermüller et al. (2004) L. Hackermüller, K. Hornberger, B. Brezger, A. Zeilinger, and M. Arndt, Nature 427, 711 (2004).
- Brühl et al. (2002) R. Brühl, P. Fouquet, R. E. Grisenti, J. P. Toennies, G. C. Hegerfeldt, T. Köhler, M. Stoll, and C. Walter, Europhys. Lett. 59, 357 (2002).
- Perreault and Cronin (2005) J. D. Perreault and A. D. Cronin, Phys. Rev. Lett. 95, 133201 (2005).
- Nairz et al. (2003) O. Nairz, M. Arndt, and A. Zeilinger, Am. J. Phys. 71, 319 (2003).
- Antoine et al. (1999) R. Antoine, P. Dugourd, D. Rayane, E. Benichou, M. Broyer, F. Chandezon, and C. Guet, J. Chem. Phys. 110, 9771 (1999).
- Knickelbein (2001) M. B. Knickelbein, J. Chem. Phys. 115, 5957 (2001).
- Berninger et al. (2007) M. Berninger, A. Stéfanov, S. Deachapunya, and M. Arndt, Phys. Rev. A 76, 013607 (2007).
- Hackermüller et al. (2007) L. Hackermüller, K. Hornberger, S. Gerlich, M. Gring, H. Ulbricht, and M. Arndt, Appl. Phys. B 89, 469 (2007).
- Gerlich et al. (2008) S. Gerlich, M. Gring, H. Ulbricht, K. Hornberger, J. Tüxen, M. Mayor, and M. Arndt, Angew. Chem. Int. Ed. 47, 6195 (2008).
- Nairz et al. (2000) O. Nairz, M. Arndt, and A. Zeilinger, Journal of Modern Optics 47, 2811 (2000).
- Note (1) Grating fabrication: Dr. Tim Savas, MIT Cambridge.
- Hornberger et al. (2009) K. Hornberger, S. Gerlich, H. Ulbricht, L. Hackermüller, S. Nimmrichter, I. Goldt, O. Boltalina, and M. Arndt, New J. Phys. 11, 043032 (2009).
- Compagnon et al. (2002) I. Compagnon, R. Antoine, D. Rayane, M. Broyer, and P. Dugourd, Phys. Rev. Lett. 89, 253001 (2002).
- Van Vleck (1965) J. Van Vleck, The theory of electric and magnetic susceptibilities (Oxford University Press London, 1965).
- Bonin and Kresin (1997) K. Bonin and V. Kresin, Electric-Dipole Polarizabilities of Atoms, Molecules and Clusters (World Scientific, Singapore, 1997).
- van Gunsteren et al. (1996) W. F. van Gunsteren, S. R. Billeter, A. A. Eising, P. H. Hüneneberger, P. Krüger, A. E. Mark, W. R. P. Scott, and I. G. Tironi, Biomolecular Simulation: The GROMOS96 Manual and User Guide (vdf Hochschulverlag AG, ETH Züerich, 1996).
- Note (2) See supplementary material at DOI: 10.1103/PhysRevA.81.031604.
- Böckmann et al. (2007) M. Böckmann, C. Peter, L. D. Site, N. L. Doltsinis, K. Kremer, and D. Marx, J. Chem. Theory Comput. 3, 1789 (2007).
- Frisch et al. (2003) M. Frisch, G. Trucks, and H. Schlegel, et al., Gaussian 03W, Version 6.0 (Gaussian Inc., Pittsburgh, PA, 2003).
- Dresselhaus et al. (1998) M. S. Dresselhaus, G. Dresselhaus, and P. C. Eklund, Science of Fullerenes and Carbon Nanotubes, 2nd ed. (Acad. Press, San Diego, 1998).