Reverse Engineering Socialbot Infiltration
Strategies in Twitter
Abstract
Data extracted from social networks like Twitter are increasingly being used to build applications and services that mine and summarize public reactions to events, such as traffic monitoring platforms, identification of epidemic outbreaks, and public perception about people and brands. However, such services are vulnerable to attacks from socialbots automated accounts that mimic real users seeking to tamper statistics by posting messages generated automatically and interacting with legitimate users. Potentially, if created in large scale, socialbots could be used to bias or even invalidate many existing services, by infiltrating the social networks and acquiring trust of other users with time. This study aims at understanding infiltration strategies of socialbots in the Twitter microblogging platform. To this end, we create 120 socialbot accounts with different characteristics and strategies (e.g., gender specified in the profile, how active they are, the method used to generate their tweets, and the group of users they interact with), and investigate the extent to which these bots are able to infiltrate the Twitter social network. Our results show that even socialbots employing simple automated mechanisms are able to successfully infiltrate the network. Additionally, using a factorial design, we quantify infiltration effectiveness of different bot strategies. Our analysis unveils findings that are key for the design of detection and counter measurements approaches.
1 Introduction
Online Social Networks (OSNs) have become popular communication platforms where people post messages about everything, from day-to-day conversations to their opinions about noteworthy events. The size of the active user bases and the volume of data created daily on OSNs are massive. Twitter, a popular micro-blogging site, has more than 200 million active users, who post more than 500 million tweets a day [30]. Notably, about 90% of the Twitter users make their content public [6], allowing researchers and companies to gather and analyze data at scale.
The massive amount of public data offered by Twitter, associated with its simple and easy-to-use public API, have allowed the emergence of a new wave of applications that explore real-time Twitter data to offer data mining and knowledge extraction services. Indeed, in the last few years, there was a dramatic proliferation of applications and studies that monitor memes, brands, people, products, and noteworthy events in Twitter, including political elections [36], stock marketing fluctuations [45], disease epidemic outbreaks [15], and natural disasters [32].
Although appealing as mechanisms to summarize information from the crowds, these services may be vulnerable to attacks that attempt to tamper their statistics, by disseminating misinformation in the network [5]. For instance, consider that users of a Twitter-based service might be interested in knowing what others think about a certain political candidate to formulate their own opinion. In this scenario, one could try to create fake accounts which post tweets to dishonestly improve or damage the public perception about this person, as an attempt to manipulate public opinion. Recent efforts estimate that more than 20 million Twitter accounts were fake in 2013 [11] and even Twitter admitted that 5% of its users are fake [10]. More alarmingly, socialbots – OSN accounts that are automatically controlled but are made to look like real users – are already being used to automate this kind of attack [26, 18, 3].
If socialbots could be created in large numbers, they can potentially be used to bias public opinion, for example, by writing large amounts of fake messages and dishonestly improve or damage the public perception about a topic. There are already evidences of the use of socialbots to create a impression that emerging political movements are popular and spontaneous [31]. Socialbots have also been used by political candidates during election campaigns to try to change the “trending topics” [28], or to artificially increase their number of followers [4]. This scenario only gets worse when we consider the existence of socialbot sale services.111http://www.jetbots.com/
Despite the large number of applications and services that rely on Twitter data and the emerging black markets that attempt to manipulate such data [34], there are many unanswered questions related to socialbots infiltration in Twitter. For instance, Can socialbots really infiltrate Twitter easily?, What are the characteristics of socialbots that would enable them to evade current Twitter defenses?, What strategies could be more effective to gain followers and influence?, What automatic posting patterns could be deployed by socialbots without being detected?, and so on.
To answer these and other questions related to socialbots, this study attempts to reverse engineer socialbot infiltration strategies in Twitter. Our methodology consists of creating 120 socialbot accounts with different characteristics and infiltration strategies (e.g., gender specified in the profile, how active they are in interacting with users, the method used to generate their tweets), and investigating the extent to which these bots are able to infiltrate the Twitter social network over the duration of a month. More specifically, we analyze which socialbot strategy is more successful in acquiring followers and provoking interactions (such as retweets and mentions) from other Twitter users.222Note that our only objective in analyzing the factors that can enable socialbot infiltration, is to improve defense mechanisms in OSNs. We ensured that none of our socialbots actually posted any malicious content in Twitter. Furthermore, all the socialbot accounts were deleted after one month of experimentation. Then, we perform a factorial design experiment [20] to quantitatively measure the extent to which each social strategy affect different infiltration metrics.
Our findings raise a huge alert about the vulnerability of many existing Twitter-based services. First, we show that out of the 120 socialbots we created, only 31% could be detected by Twitter after a period of one month of executing only automated behavior, suggesting that automated strategies are able to evade Twitter defense mechanisms. Second, we show that even socialbots employing simple automated mechanisms successfully acquired hordes of followers and triggered a large number of interactions from other users, making several bots to become relatively highly influential according to metrics like Klout score [22]. Therefore, our proposed approach to measure which bot strategy works better for infiltrating Twitter, may be extremely valuable for the design of future defense mechanisms. Particularly, we found that higher Twitter activity (such as following users and posting messages) showed to be the most important factor towards successful infiltration when bots target a random group of users. Other factors, such as the gender and the profile picture, may gain importance when the attack is concentrated on a particular type of users.
As a final contribution, we plan to make our dataset available to the research community by the time of publication of this article. The dataset consists of the timeline of activities and performance of infiltration of each of the 120 socialbots during the 30 days of experimentation. To the best of our knowledge, this dataset is the first of its kind, and would allow researchers to explore new aspects of socialbots infiltration in Twitter.
The rest of the paper is organized as follows. The next section briefly surveys related efforts. In Section 3, we present the methodology used to create the socialbots. Section 4 presents the metrics used to evaluate the infiltration performance of socialbots. Section 5 describes which socialbots were able to evade Twitter defenses, whereas Section 6 evaluates the socialbots configurations that achieve the best infiltration performance. Then, Section 7 describes a factorial design experiment to quantitatively assess the relative importance of various features in socialbot infiltration strategies. Finally, Section 8 discusses the implications of our findings to future defense mechanisms and directions of future work.
2 Related work
Different forms of spam have been observed in online systems [19] and OSNs such as Twitter. Specifically, there has been lot of attention on spam in Twitter, which has been observed to be much more potent than conventional modes of spam such as email-spam [16]. In fact, several different types of spam activity have been observed in Twitter, including spamming trending topics [2], polluters [25], link farming [13], phishing [7], content credibility issues [5], and automated and fraudulent accounts [45, 34]. Given that the present study focuses on socialbots in Twitter, the rest of this section is devoted to review studies related to socialbots.
Bots in OSNs: A particular form of OSN spam consists of the spammers creating socialbots (or simply bots) which attempt to acquire influence and trust in the OSN before engaging in malicious activities such as spreading misinformation and manipulating public opinion. There have been several attempts towards large-scale creation of bots in OSNs, such as the Realboy project [9] or the Web Ecology project [43]. Messias et al. [26] created bots capable of interacting with users on Twitter, and achieved significant scores according to influence metrics such as Klout and Twitalyzer.333http://twitalyzer.com Boshmaf et al. [3] designed a social network of bots in order to conduct a large-scale infiltration; the study demonstrated that OSNs can be infiltrated with a success rate of up to 80%. In general, these efforts demonstrate the vulnerability of Twitter to the infiltration of bots.
There have also been attempts for detection of bots in OSNs. Chu et al. [8] used machine learning techniques to identify three types of accounts on Twitter users, bots and cyborgs (users assisted by bots). They showed that the regularity of posting, the fraction of tweets with URLs and the posting medium used (e.g., external apps), provide evidence for the type of the account. Complementary to the detection of bots, Wagner et al. [41] created a machine learning model to predict user’s susceptibility to bot attacks using three different set of attributes of the user (network, behavior and linguistic characteristics). Their results indicate that users more “open” to social interactions are more susceptible to attacks. Subsequently, a similar study by Wald et al. [42] found that the Klout score, number of followers and friends, are good predictors of whether a user will interact with bots.
Two perspectives of studying spam: The numerous studies on spam in online forums can be broadly divided into two classes based on the perspective from which the study is conducted. A large majority of the studies (including the ones stated above) are from the perspective of those who build spam defense mechanisms, such as developing classifiers for spammers and bots [8, 25]. However, there have been a few studies which were conducted from the perspective of spammers; these studies essentially attempt to reverse engineer the strategies of spammers in order to gain insights which can help to develop better spam defenses.
Most of such studies (from the perspective of spammers) have been on email spam, and spam in the Web. Pitsillidis et al. [29] attempted to filter spam emails by exploiting the perspective of the spammers they instantiated botnet hosts in a controlled environment, and monitored spam emails as they were created, and thus inferred the underlying template used to generate such emails. Stone-Gross et al.[33] studied a large-scale botnet from the perspective of the botmaster, and analyzed the methodologies used in orchestrating spam email campaigns. Gyongyi et al. studied link farms on the Web, which are groups of interconnected web-pages which attempt to boost the rankings of particular web-pages. Specifically, they investigated how multiple web-pages can be interconnected to optimize rankings [17].
Almost all studies on Twitter spam has focused on understanding the dynamics of different forms of spam in Twitter, or on designing spam defense mechanisms. To the best of our knowledge, there is no previous study attempting to analyze the strategies of bots/spammers from the perspective of the spammers themselves. This is the motivation of the present study to reverse engineer socialbot strategies in the Twitter OSN. We believe that this is complementary to all the aforementioned studies on Twitter spam, can offer a novel perspective to building more effective defense mechanisms against spam and bot accounts in the future.
3 Methodology
This study aims to reverse-engineer socialbot strategies in Twitter, and analyze how various characteristics of the socialbots impact their infiltration performance. For this, it is necessary to create a set of socialbots in Twitter, which would attempt to infiltrate the network, and then observe their behavior and infiltration performance. This section details the steps followed in this infiltration experiment.
3.1 Creation of socialbots
For the experiments in this study, a set of 120 socialbots were created on Twitter. The socialbots were implemented using the open-source Realboy project [9] which is an experimental effort to create ‘believable’ Twitter bots using simple automated techniques to follow other Twitter users and post tweets (see [9] for details). Our 120 bots were created over a period of 20 days, using 12 distinct IP addresses (10 bots were operated from each IP address). Subsequently, starting from 10 days after the creation of the last bot, we monitored their behavior and their interactions with other Twitter users over a period of 30 days.
Profile settings of socialbots: To make bot accounts look similar to real users in Twitter, we took the following steps while creating the bot accounts. Each socialbot has a customized profile, which includes a name, a biography, a profile picture, and a background. The gender of the bot is also set to ‘male’ or ‘female’ using a proper name and profile picture. Further, to ensure that when other Twitter users see our bot accounts, they do not see a totally ‘empty’ profile, the socialbots are initially set to have a few followers, followings and tweets. As detailed later in this section, the 120 socialbots are divided into groups based on the set of target users they are assigned to follow. Each bot initially follows a small number (randomly selected between one and seven) of the most popular users among the target users assigned to it. Also, all socialbots assigned to the same target-set follow each other, so that every bot account has some followers to start with. Finally, every socialbot posted 10 tweets before attempting to interact with other users.
Activity settings of socialbots: Since the objective of our socialbots is to infiltrate the social network, it is necessary that they interact with other users in the social network. For this, our socialbots can perform a set of basic actions: (i) post tweets, (ii) retweet tweets posted by the users they follow, and (iii) follow users on Twitter.
Specifically, a socialbot becomes ‘active’ at pre-defined instants of time; the gap between two such instants of activity is chosen randomly (as detailed later in this section). Once a socialbot becomes active, it performs the following two actions – (i) with equal probability, the socialbot either posts a new tweet, or retweets a tweet that it has received from its followings, and (ii) the socialbot follows a random number (between 1 and 5) of the target users assigned to it, and follows some of the users who have followed it (if any) since the last instant of activity.
Note that we attempt to ensure that our bots do not link to spammers or other fake accounts, which could make Twitter’s spam defense mechanisms suspicious, and potentially lead to suspension of the bot accounts. For this, our bots only follow users from their respective target-set, and some selected users from among those who have followed them. Since it is known that spammers in Twitter usually have far less number of followers than the number of followings [2, 25], our socialbots follow back non-targeted users only if those users have their number of followers greater than half the number of their followings.
3.2 Attributes of the socialbots
There are a number of attributes of a Twitter user-account which could potentially influence how it is viewed by other users. Since analyzing the impact of all possible attributes involves a high cost, we decided to focus on the following four specific attributes of the socialbot accounts: (i) the gender mentioned in the bot’s profile, (ii) the activity level, i.e., how active the bot is in following users and posting tweets, (iii) the strategy used by the socialbot to generate tweets, and (iv) the target set of users whom the socialbot links with.
We set the socialbot accounts such that they have diverse characteristics with respect to each of the four attributes stated above, and then attempt to measure whether any of these attributes can make a bot more successful in terms of infiltration. The rest of this section describes these attributes, and their distribution in the 120 socialbots created.
3.2.1 Gender
Out of the 120 socialbots created for our experiments, half are specified to be male, while the other half are specified to be female. Setting the gender of a socialbot involves using an appropriate name and profile picture.
3.2.2 Activity level
Here we aim at investigating whether more active bots
are more likely to be successful in infiltration tasks, than less active ones.
Note that while more active bots are more likely to be visible to other users,
they are also more likely to be detected by Twitter defense mechanisms;
hence there is a trade-off in deciding the activity level of socialbots.
For simplicity, we create socialbots
with only two levels of activity, based on the interval
between two consecutive instants when a bot becomes
‘active’ and engages in following users and posting tweets
(as stated earlier in Section 3.1):
(1) High activity:
For these socialbots, the intervals between two consecutive
instances of activity are chosen randomly between 1 and 60 minutes.
(2) Low activity:
For these socialbots, the intervals between two consecutive
instances of activity are chosen randomly between 1 and 120 minutes.
Half of our 120 socialbots are configured with high activity, while the other 60 are configured with low activity. Also, all socialbots ‘sleep’ between 22:00 and 09:00 Pacific time zone, simulating the expected downtime of human users.
3.2.3 Tweet generating strategy
Making a socialbot to look like a
legitimate user requires automated methodologies for generating well-written tweets
with relevant content.
We employ two different methodologies for generating tweets
from our bot accounts:
(1) Re-posting: As the name indicates, this method consists of re-posting tweets that were originally posted by another user, as if they were one’s own. A socialbot employing this strategy simply re-posts tweets (written by other Twitter users) drawn from the random sample of the Twitter stream.444Twitter provides a 1% random sample of the complete tweet stream for public use.
Note that a very large fraction of posts in Twitter are day-to-day conversation [40, 14]. Hence blindly re-posting any random tweet may result in posting mostly conversational tweets, which would not seem interesting to the target users (whom the bot intends to interact with). Thus, we adopted the following approach to increase the odds that the tweets re-posted by our bots have content relevant to the target users. For a particular bot, we extracted the top 20 terms that are most frequently used by the target users of that bot (after ignoring a common set of English stop-words). Subsequently, a bot considers a tweet for re-posting only if it contains at least one of these top 20 terms.
(2) Generating synthetic tweets: This approach synthetically generates tweets that are likely to be as relevant as the tweets posted by the target users. Our approach uses a Markov generator [1, 21] a mathematical model used to generate text that looks similar to the text contained in a sample set of documents. Figure 1 shows an example of a bigram Markov generator, extracted from the sample set of documents {“I like turtles”, “I like rabbits” and “I don’t like snails”}. Here, the weight of an edge denotes the probability that the word immediately follows word , as measured from the sample documents.555For instance, there is an edge of weight between the nodes “I” and “like” since, out of the three occurrences of the word “I” in the sample documents, two occurrences are immediately followed by the word “like”. A possible text generated by the Markov generator in Figure 1 is “I don’t like rabbits” (see [1, 21] for details of the method).
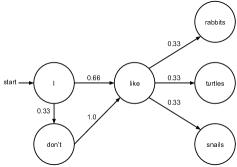
To increase the likelihood that the tweets generated by a socialbot are considered relevant by the target users, we use a set of tweets recently posted by the target users of that socialbot, as the sample set to create the Markov generator. Specifically, we use a trigram Markov generator, since trigrams showed the best results when compared to -grams of another order. We initially extract the empirical probability of occurrence of each trigram in the sample set, then generate a Markov generator from the obtained set of trigrams.
The main advantages of this method are that it
does not require any human effort,
but it generates text containing the representative terms of the sample
set of documents. Thus, with a relatively high probability, the
tweets generated by the socialbots
are on the topics of interest of the target group.
However, the textual quality of the tweets may be low,
e.g., some tweets may be unfinished sentences.
Moreover, because of the way that the method has been
implemented it is unable to generate tweets containing
user-mentions or URLs.
Table 1 shows some example tweets generated by
the Markov generator used in our experiment.
| I don’t have an error in it :) |
|---|
| The amount of content being published this week :: the number of people who’ve finished this website but it makes it easier to argue that |
| Why isn’t go in the morning! night y’all |
| Night y’all ???! |
| take me to fernandos and you’ll see |
| end aids now, the marilyn chambers memorial film festival I’d fix health care continues to outpace much of nation’s issues move to the |
Half of our 120 socialbots use only the reposting method, while the others utilize both the above methods, where each method has an equal probability to generate the next tweet.
3.2.4 Target users
Another factor which potentially affects the performance of socialbots in infiltration tasks is the set of target users, i.e., the set of users with whom the socialbot attempts to interact and infiltrate. For instance, we wanted to check whether it is easier for socialbots to infiltrate randomly selected users, or users who are similar to each other in some way (e.g., users who are interested in a common topic, or users who are socially connected among themselves).
As stated earlier, we wished to ensure that our socialbots do not
link to spammers or other fake accounts in Twitter.
Hence, we consider as a potential target user, only those user-accounts which
possess the following characteristics:
(i) are controlled by a human (as manually judged
from the account’s profile and the nature of the tweets posted),
(ii) post tweets in English, to ensure that they understand
the language used by our bots and,
(iii) are active, i.e., has posted at least one tweet since December 2013.
We considered the following three groups of target users:
Group 1: Consisting of 200 users randomly selected from the Twitter stream random sample, and verified that they meet the above mentioned criteria.
Group 2: Consisting of 200 users who post tweets on a specific topic. We decided to focus on a group of software developers; hence, we selected users from the Twitter random sample, who have posted at least one tweet containing any of the terms “jQuery”, “javascript” or “nodejs”. Subsequently, we randomly selected 200 accounts from among these users, after verifying that they meet the criteria stated above. Note that though we focus on software developers, the study could be conducted on groups of users interested in any arbitrary topic.
Group 3:
Consisting of 200 users who
post tweets on a specific
topic, and are socially connected among themselves.
As the topic, we again focus on software developers.
Here we started with a ‘seed user’ – @jeresig, who is an
influential software developer on Twitter, and creator of ‘jQuery’ –
and collected the 1-hop neighborhood of the seed user.
From among these users, we extracted 200 users whose profiles
show that they are software developers, who satisfy
the criteria stated above,
and whose social links form a
dense sub-graph in the Twitter social network.
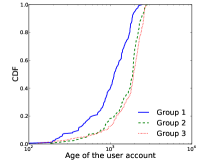
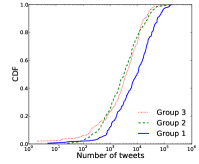
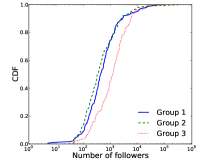
Out of the 120 socialbots, 40 were assigned to each group of target users. To bring out the differences among the three groups (selected as described above), we conducted a brief characterization of each group. Figure 2 shows distributions of the users in the three target groups according to: (i) the age of their accounts, (ii) the total number of tweets posted during their life-time, (iii) their number of followers, and (iv) their Klout scores. We found that users in group 1 have relatively newer accounts than the other groups (Figure 2(a)); however, they are more active in posting tweets (Figure 2(b)). Further, users in group 3 are more influential than the other groups, i.e., have a greater number of followers (Figure 2(c)) and higher Klout scores (Figure 2(d)).
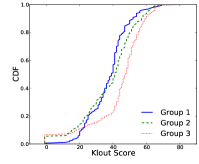
The justification behind our choices of target users is as follows. First, we intend to check whether it is easier for socialbots to interact with and infiltrate heterogeneous groups of users (Group 1), or a particular category of users based on common interests (e.g., software developers, as in Group 2 and Group 3). Second, we wanted to compare the relative difficulty in infiltrating a group of users who are socially well-connected among themselves, versus users who are not socially connected. For this, we select Group 2 and Group 3 as stated above, so that both groups of users are interested in the same topic, but Group 3 is densely connected in the social network while Group 2 is not.
Thus, the 120 socialbots created for this experiment were configured with different strategies for the four chosen attributes. The subsequent sections will analyze which of these strategies result in better infiltration performance.
4 Measuring Infiltration Performance
The objective of this study is to investigate whether, and to what extent,
various socialbot strategies are able to infiltrate
the Twitter social network.
Naturally, we need some metrics to quantify the infiltration
performance of socialbots, so that the performance
of different strategies (employed by the socialbots) can be compared.
To quantify infiltration performance
we use the following three metrics, measured at the end
of the duration of the experiment.
(1) Followers acquired by the socialbot: We count the number of followers acquired by the socialbot, which is a standard metric for estimating the popularity / influence of users in the Twitter social network [6].
(2) Klout score acquired by the socialbot: Klout score [22] is a popular metric for the online social influence of a user. Though the exact algorithm for the metric is not known publicly, the Klout score for a given user is known to consider various data points from Twitter (and other OSNs, if available), such as the number of followers and followings of the user, retweets, membership of the user in Lists, how many spam / dead accounts are following the user, how influential are the people who retweet / mention the user, and so on [23]. Klout scores range from 1 to 100, with higher scores implying a higher online social influence of a user.
(3) Message-based interactions with other users:
We measure the number of times other users interact with a socialbot
through messages (tweets) posted in the social network.
Considering the different types of
message-based interactions allowed in Twitter, we specifically count the total
number of times some user @mentions the bot, or replies to the bot,
or retweets / favorites a tweet posted by the bot.
This metric estimates the social engagement
of the bot, which is defined as the extent to which a user
participates in a broad range of social roles and
relationships [44].
If a bot scores well in terms of the above metrics, it implies that the tweets posted by this bot are more likely to be visible, e.g., more likely to be included in Twitter search results, and is hence more likely to affect the opinion of other users (which are common goals of bots in social networks).
The subsequent sections measure the success of various socialbot strategies in infiltrating the social network according to the metrics specified above.
5 Can socialbots infiltrate Twitter?
We first investigate whether, and to what extent,
socialbots can infiltrate the Twitter social network.
For a socialbot to successfully infiltrate
the network, it needs to achieve the following two objectives.
(i) evade detection by Twitter’s spam defense mechanisms
which regularly check for and suspend accounts exhibiting
automated activities [38], and
(ii) acquire a substantial level of popularity and influence
in the social network, and
interact with large number of other users, i.e., achieve
high scores in the metrics described in Section 4
In this section, we investigate how socialbots
performed with respect to the above objectives.
5.1 Socialbots can evade Twitter defenses
We start by checking how many of the 120 socialbots could be detected by Twitter. We find that over the 30 days during which the experiment was carried out, 38 out of the 120 socialbots were suspended. This implies that although all our socialbots actively posted tweets and followed other users during this period, as many as 69% of the socialbots could not be detected by Twitter spam defense mechanisms.
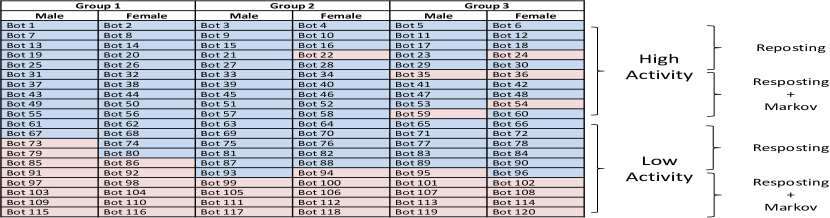
We next analyze which of the 120 socialbots could be detected by Twitter. Figure 3 shows the distribution of the four attributes – gender, level of activity, tweeting methodology, and target group of users followed – among the 120 socialbots created. The socialbots are indicated by numeric identifiers in the same order in which they were created, i.e., Bot1 was created first and Bot120 was the last socialbot created. The socialbots which were suspended by Twitter during the experiment (one month) are indicated in red color, while the socialbots which could not be detected by Twitter are shown in blue color.
We note that a large majority of the socialbots which were suspended were the ones which were created at the end of the account creation process (with ids between 90 and 120). This is probably because by the time these accounts were created, Twitter’s defense mechanisms had become suspicious of several accounts being created from the same block of IP addresses.666As stated in Section 3, we used 12 distinct IP addresses to create the 120 socialbots, i.e., 10 accounts were operated from each IP address. We also find that the socialbots which used the Markov-based posting method were more likely to be suspended. This is expected, since about half of the tweets posted by these accounts were synthetically generated, and hence likely to be of low textual quality.
However, the Twitter defense mechanisms could detect only a small fraction of the socialbots which were created early, and which adopted the re-posting strategy, i.e., re-posted others’ tweets. These statistics highlight that existing defense mechanisms are of only limited use in detecting socialbots which employ simple but intelligent strategies for posting tweets and linking to other users. Further, the relatively low fraction of suspended accounts justifies our strategies such as re-posting others’ tweets, and ensuring that our socialbots do not link with large number of spammers and fake accounts (as described in Section 3).
5.2 Bots can infiltrate Twitter successfully
We next check to what extent socialbots can infiltrate the Twitter social network, and whether they can gain relatively high scores according to the metrics stated in Section 4.
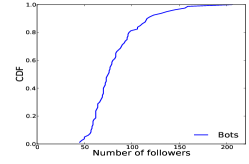
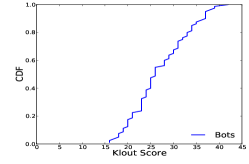
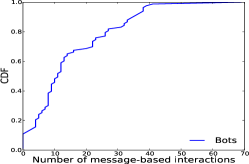
Over the duration of the experiment, the 120 socialbots created by us received in total 4,999 follows from 1,952 distinct users, and 2,128 message-based interactions from 1,187 distinct users. Figure 4 shows the distribution of the number of followers, the Klout score and the number of message-based interactions acquired by the socialbots at the end of the experiment. It is evident that a significant fraction of the socialbots acquire relatively high popularity and influence scores. Within just one month (the duration of the experiment), more than 20% of the socialbots acquired more than 100 followers (Figure 4(a)); it can be noted that 46% of the users in Twitter have less than 100 followers [37]. Furthermore, Figure 4(b) shows that 20% of the socialbots acquired Klout scores higher than 35 within only one month.
Table 2 compares the Klout scores acquired by the three socialbots that acquired the highest Klout scores777The three socialbots which acquired the highest Klout scores have common characteristics – all of them had their gender specified as ‘female’, were highly active, used only reposting as the mechanism for posting tweets, and followed Group 2 of target users (see Section 3). with some real and active Twitter users – members of the COSN community. We find that the socialbots achieved Klout scores of the same order of (or, at times, even higher than) several of these well-known academicians and social network researchers. Additionally, these socialbots also acquired higher Klout scores than the two bots developed in the prior study [26].
Note that the Klout scores of our socialbots were acquired over only one month (the duration of the experiment), whereas the real users in Table 2 have accumulated influence over several years. Besides, most of the real users in Table 2 have accounts in multiple OSNs (e.g., Twitter, Facebook, LinkedIn), all of which contribute towards their Klout scores; on the other hand, the Klout scores of our socialbots are only contributed by their Twitter accounts. In spite of the above limitations, the scores of our socialbots highlight the fact that bots employing relatively simple automated strategies to follow users and post tweets, can achieve significantly high levels of popularity and social engagement in Twitter network.
| User | Description | Klout |
|---|---|---|
| Carlos Castillo | COSN’14 TPC member | 56 |
| Ben Zhao | COSN’14 TPC member | 52 |
| Ashish Goel | COSN’14 TPC member | 46 |
| Francesco Bonchi | COSN’14 TPC member | 44 |
| Winter Mason | COSN’14 TPC member | 44 |
| PK | COSN’14 Publicity Chair | 43 |
| Mirco Musolesi | COSN’14 TPC member | 43 |
| Bot 28 | Socialbot in this study | 42 |
| Bot 4 | Socialbot in this study | 39 |
| Bot 16 | Socialbot in this study | 39 |
| Christo Wilson | COSN’14 Budget Chair | 38 |
| scarina | Bot developed in [26] | 37.5 |
| Fabricio Benevenuto | COSN’14 TPC member | 27 |
| Paolo Boldi | COSN’14 TPC member | 19 |
| fepessoinha | Bot developed in [26] | 12.3 |
6 Evaluating Infiltration Strategies
The previous section showed that a significant fraction of the socialbots are indeed able to infiltrate and gain popularity in the Twitter social network. This section analyzes which socialbot strategies lead to better infiltration performance. Recall from Section 3 that the socialbots were configured with multiple strategies for each of the four attributes – gender, activity level, tweet-posting method, and type of target users. We now investigate which strategies for each of the four attributes yields the best infiltration performance. Note that the results stated in this section (and the next) consider those socialbots which were not suspended by Twitter during the experiment (as described in Section 5).
6.1 Gender
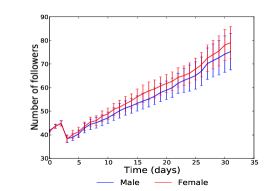
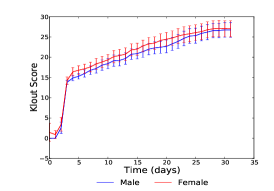
We start by analyzing the impact of the gender of the socialbots in our experiments. Figure 5(a) and (b) respectively show the mean number of followers and the Klout score acquired by the male and female socialbots over each day during our experiment. In these figures, the curves represent the mean values considering all the socialbots of a particular gender (on a given day during the experiment), and the error bars indicate the 95% confidence intervals of the mean values. We find that there is no significant difference in the popularity acquired by socialbots of different genders.
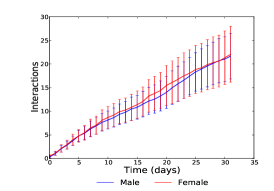
We next turn to the message-based interactions of the male and female socialbots with other users. Figure 5(c) shows the mean number of interactions of the socialbots on each day during the experiment. Again, we observe that users interacted almost equally with socialbots of both genders.888The number of distinct users who interacted with the female socialbots (1,697), was, in fact, slightly higher than the number who interacted with the male socialbots (1,528). But, as evident from Figure 5(c), this difference is not a significant one.
The above results imply that the gender specified in the account profile does not significantly influence the infiltration performance of the socialbots. It can be noted that, in this section, we are considering all the socialbots (and interactions with all target users) together. Later in Section 7, when we separately analyze the performance of socialbots in infiltrating each group of target users, we shall see that the gender attribute is indeed significant for some specific target groups.
6.2 Activity Level
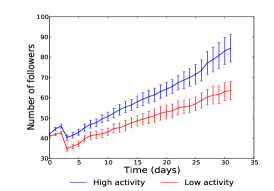
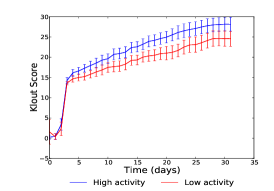
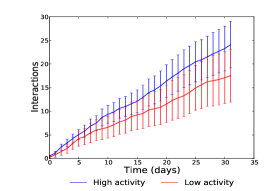
We next study the impact of the socialbots’ activity levels, which we define as lower or higher based on how frequently a socialbot posts tweets and follows users.
Figure 6(a) and (b) respectively show the mean number of followers and mean Klout scores of the socialbots (having the two different levels of activity) on each day during the experiment. We can see that socialbots with higher activity levels achieve significantly more popularity and Klout score than less active socialbots. Figure 6(c) show the mean number of message-based interactions of socialbots with other users in Twitter. Again, the more active socialbots achieved much more interactions.
Thus, we find that the more active are the bots, the more likely they are to be successful in infiltration tasks, as well as in gaining popularity in the social network. This is expected, since the more active a bot is, the higher is the likelihood of its being visible to other users. However, it must also be noted that the more active a bot is, the more likely it is to be detected by Twitter’s defense mechanisms.
6.3 Tweet generating method
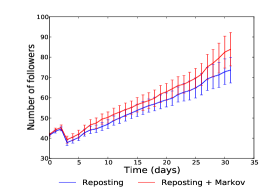
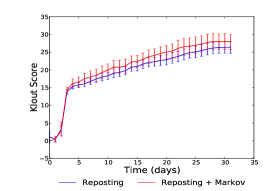
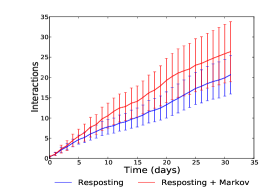
We next analyze the impact of the tweet generating method used by the socialbots. Recall from Section 3 that half of our socialbots only re-posted tweets written by other users (strategy denoted as ‘reposting’), while the other half re-posted tweets as well as synthetically generated tweets using a Markov generator, with equal probability (strategy denoted as ‘reposting + Markov’).
Figure 7(a), (b), and (c) respectively show the mean number of followers, mean Klout scores, and the mean number of message-based interactions acquired by the socialbots employing the two posting strategies (on each day during the experiment). It is seen that the socialbots employing the ‘reposting + Markov’ strategy acquired marginally higher levels of popularity (number of followers and Klout scores), and much higher amount of interactions (social engagement) with other users.
The fact that socialbots which automatically generated about half of their tweets achieved higher social engagement is surprising, since it indicates that users in Twitter are not able to distinguish between (accounts which post) human-generated tweets and automatically generated tweets using simple statistical models. This is possibly because a large fraction of tweets in Twitter are written in an informal, grammatically incoherent style [24], so that even simple statistical models can produce tweets with quality similar to those posted by humans in Twitter.
6.4 Target users
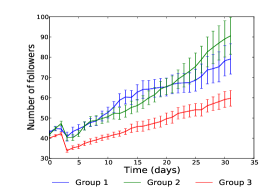
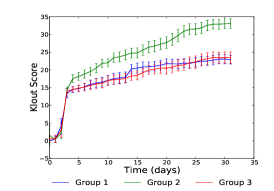
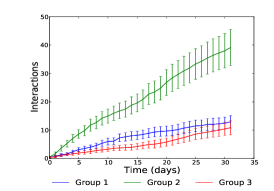
Finally, we analyze the infiltration performance of socialbots who were assigned different sets of target-users to follow. Recall from Section 3 that the socialbots were divided into three groups based on the target-set – Group 1 followed users selected at random, Group 2 followed target-users who post tweets on a specific topic (related to software development), and Group 3 of socialbots followed target-users who not only post tweets on the specific topic but are also socially well-connected among themselves.
Figure 8(a) shows the average number of followers acquired by each group of socialbots throughout the experiment. It is seen that the socialbots in Group 3 had the lowest number of followers, while those in Group 2 had a significantly higher number of followers. Figure 8(b) shows the average values of Klout score achieved by our socialbots over time. Again, the socialbots in Group 2 have the highest Klout scores, while the other groups have a similar performance. Figure 8(c) shows the average number of message-based interactions of each group of socialbots (with other Twitter users) over time. Again, we find that socialbots in Group 2 got significantly more interactions with other users, and those in Group 3 got the least interactions.
These observations lead to some interesting insights. Following a set of users who post tweets on a specific common topic (e.g., software development) is a more promising approach than following random users (as done by Group 1). However, although the target-users for both Group 2 and Group 3 post tweets on a common topic, the socialbots in Group 2 achieved significantly higher popularity and engagement – this implies that infiltrating into inter-connected groups of users (Group 3) is far more difficult than engaging with users without any relation among themselves (Group 2). Note that this observations differs from those made by similar research on Facebook [12]. where it was found that socialbots can effectively infiltrate social networks among members of specific organizations.
Summary:
The analysis of the impact of various attributes
on the infiltration performance of socialbots shows that,
while certain attributes – such as
the gender mentioned in the profile –
do not significantly affect
infiltration performance, other attributes
such as the activity level and the choice of the target users
has large impact upon infiltration performance.
In this section, we focused on each attribute individually, and
compared the infiltration performance for different
choices (strategies) of that attribute.
However, we did not attempt to analyze the relative importance
of different attributes; for instance, we did not investigate which of
the two attributes (i) activity level and (ii) choice of target users
has the larger impact upon infiltration performance.
The next section quantifies the relative impact of the various attributes
on infiltration performances.
7 Assessing Attribute Importance
In this section, we aim to assess the relative importance of the different attributes and infiltration strategies of the socialbots. Our objective is to quantify which strategy (or, combination of strategies) has the greatest impact in deciding how the socialbots can infiltrate specific groups of target users. Note that, differently from Section 6, here we consider the socialbots’ performance in infiltrating specific groups of targeted users.
We present a factorial design experiment to assess the relative impact of the different infiltration strategies. We begin by briefly describing how we designed our experiments, and then discuss the obtained results.
7.1 factorial experiment
We here include a brief description of the theory of factorial experiments; we refer the reader to [20] for a comprehensive description.
An experimental design strategy is usually necessary in scenarios with a large number of factors, as an attempt to reduce the number of factors that will be part of the experiment. Particularly, designs refer to experimental designs with factors where each factor has the minimal number of levels, just two. As an illustrative example, suppose an experimental performance scenario in which three factors – memory, disk, and CPU of a machine – can potentially affect the performance of an algorithm. Suppose now that each experiment takes about one day to run and there are 10 possible types of memory, 10 types of disks, and 10 types of CPUs to be tested. Running an experiment with all possibilities would take days. Instead of running all possibilities, a design would consider two (usually extreme) types of memory, two types of disk, and two types of CPUs to compare, which would result in only days of experiments. The theory of factorial experiments [20] would then allow one to estimate how much each factor impacts on the final result, a key information to help decide on which factors an experiment should focus.
Note that, differently of the above example, our goal here is not primarily to reduce the number of experiment scenarios. Instead we use a design to infer how much a factor – which, in our case, correspond to attributes like gender, activity level, and posting method – impacts the different infiltration metrics.
7.2 Factorial experiment on the socialbot infiltration
For certain applications, the objective of socialbots might be to infiltrate a particular target group of users. Hence, we here individually consider the success of our socialbots in infiltrating each of the three target groups (which were described in Section 3). For each target group, we consider the three infiltration metrics stated earlier – the number of followers acquired, the number of message-based interactions and the Klout score. Then, for each metric and each target group, we executed a design considering the attributes and their values as described in Table 3, resulting in experiments. We performed experiments that associates or for the strategies employed for each attribute. All experimental configurations for all datasets were averaged over 5 results, which is the number of socialbots in each configuration.
| Factor | 1 | 1 |
|---|---|---|
| Gender (G) | Female | Male |
| Activity Level (A) | Low activity | High activity |
| Posting Method (P) | Repost | Repost+Markov |
The basic idea of the factorial design model consists of formulating , the infiltration impact, as a function of a number of factors and their possible combinations, as defined by Equation 1. Here, GP, AP, AG, and GAP account for all possible combinations among the factors. For instance, the experiments for ‘GP’ attempts to measure the impact of a certain combination of the attributes Gender (G) and Posting method (P) (e.g., ‘Female and Repost’, or ‘Male and Repost+Markov’).
| (1) |
where and is defined as follows.
and the ’s for the feature-combinations (e.g., AG, GP) are defined from the values of , , and following the standard way described in [20] (details omitted for brevity).
In the above equation, is the infiltration performance (according to a certain metric like number of followers, or Klout score) when strategy is applied, and stands for the average infiltration performance, averaged over all possible features and their combinations. By empirically measuring according to different feature-combinations (which, in our case, refer to the various socialbot strategies), we can estimate the values of the different and . This allows us to understand by how much each factor impacts the final infiltration performance.
Instead of presenting results for all possible values of , we focus on the variations of due to changes in the features (or their combinations), which helps to estimate the importance of a particular factor to the final result. As an example, if we find that a factor accounts for only 1% of total variation on the results, we can infer that this attribute is unimportant for infiltrating Twitter with a socialbot.
As proposed in [20], the importance of the various factors can be quantitatively estimated by assessing the proportion of the total variation in the final result that is explained by each factor. To compute this variation, we first consider the variation of (as defined by Equation 1) across all runs, and then compute as the sum of the squared difference between each measured value of and the mean value of . Then, we compute as the variation only due to the changes on factor , which can be computed similarly to , but considering only those runs in which the values of the factor were changed. Finally, we calculate the fraction of variation due to factor as . We now use this metric to compute the impact of each attribute for different infiltration metrics and groups of target users.
| Gender (G) | Activity level (A) | Posting method (P) | GA | GP | AP | GAP | |
|---|---|---|---|---|---|---|---|
| Group 1 | 7.43 | 53.75 | 12.44 | 5.20 | 0.85 | 20.10 | 0.23 |
| Group 2 | 3.99 | 72.65 | 2.77 | 4.38 | 3.53 | 2.81 | 9.87 |
| Group 3 | 20.52 | 49.27 | 2.02 | 2.40 | 5.42 | 12.71 | 7.66 |
| Gender (G) | Activity level (A) | Posting method (P) | GA | GP | AP | GAP | |
|---|---|---|---|---|---|---|---|
| Group 1 | 0.03 | 36.58 | 13.87 | 0.31 | 2.83 | 44.74 | 1.64 |
| Group 2 | 0.00 | 40.56 | 7.26 | 20.67 | 19.39 | 6.34 | 5.77 |
| Group 3 | 12.71 | 43.23 | 4.51 | 19.60 | 8.18 | 1.19 | 10.58 |
| Gender (G) | Activity level (A) | Posting method (P) | GA | GP | AP | GAP | |
|---|---|---|---|---|---|---|---|
| Group 1 | 0.46 | 41.32 | 21.69 | 0.00 | 0.61 | 35.90 | 0.02 |
| Group 2 | 7.58 | 31.98 | 12.62 | 15.93 | 15.93 | 10.19 | 5.78 |
| Group 3 | 12.58 | 31.42 | 17.92 | 12.94 | 12.37 | 2.13 | 10.65 |
7.3 Attribute Importance
We begin by analyzing to what extent each of the attributes impacts the number of followers acquired by the socialbots. Table 6 shows the variation explained by each attribute in the number of followers acquired by the socialbots from each of the target groups. We note that the activity level of a socialbot is the most important attribute for Group 1 (random users) of target users, being 53.75% responsible for deciding the number of followers acquired by a socialbot. The second most important attribute is the posting method (i.e., technique used to generate the tweets), which accounts for 12.44% of the variation on the number of followers. The combination of these two attributes (AP column in Table 6) leads to a high variation (about 20%) on the number of followers as well.
Similar observations can be made from Table 6 and Table 6, which shows the percentage variation explained by each attribute on the number of message-based interactions (i.e., number of tweets retweeted or favorited, number of mentions, and number of replies) and on the Klout Scores, respectively.
We also observe that the importance of some of the attributes varies significantly according to the group of users targeted by the socialbots. For instance, the gender attribute has a great importance in the experiments with target users from Group 3, being responsible for 20.52% of the variation of the number of followers (Table 6) and 12.71% of the message-based interactions (Table 6) when the target users are from this group.999We found that the users in Group 3 were more likely to follow and interact with socialbots having female profiles. However, the gender attribute does not seem to have much influence on the other target groups. This suggests that the gender of the socialbots can make a difference if the target users are gender-biased, or susceptible to follow and interact with users of a certain gender.
8 Concluding discussion
In this work, we exposed Twitter’s vulnerability against large-scale socialbot attacks that can affect both Twitter itself and services built on crowd-sourced data gathered from Twitter. This problem is a clear adversarial fight, or as usually called, a cat and mouse fight. We put ourselves in the mouse’s shoes (i.e., assumed the perspective of socialbot-developers) as an attempt to bring to the research community a novel perspective to the problem. We analyzed the importance of various attributes in deciding the infiltration performance of socialbots, and designed a factorial design experiment in order to quantify the extent to which different socialbot strategies impact their infiltration performance.
We believe that our findings have a number of implications for designers of
spam defense mechanisms in OSNs.
First, we demonstrated that it is possible to infiltrate
Twitter with simple automated strategies –
this calls for better defense mechanisms than those that
are currently deployed on Twitter.
We also show that existing influence metrics such as Klout are
vulnerable to socialbot strategies.
Second, malicious activities have different nuances in the Twitter platform,
including Sybil attacks [39], link-farming [13],
content pollution [25], content credibility [5], search SPAM [2], phishing [7], and so on.
Socialbots may be used to perform any of these forms of attacks;
moreover, their strategies might change depending on the particular set
of users they want to infiltrate or influence.
Hence, our efforts towards understanding the best socialbot strategies
may suggest improvements for different defense mechanisms
designed to counter specific types of malicious activities in Twitter.
Third, our study suggests some limitations of existing mechanisms for detection
of bots / fake accounts, and potential ways to improve them:
(i) We find that re-posting others’ tweets is a simple but promising
strategy for socialbots, especially considering that existing Twitter
defenses could not detect most of the bots employing this strategy. This suggests
that those accounts for which a large fraction of tweets are re-posts / retweets can be monitored.
(ii) We see that Twitter users, in general, are not good at distinguishing
tweets posted by real users and tweets generated automatically using statistical models.
This implies that relying on user-generated reports for identifying
bots / fake accounts (as done by Twitter [38])
may not be a promising approach. Rather, approaches that investigate the linguistic
aspects of tweets could be explored to identify automatically generated tweets.
(iii) It is, in a way, comforting to note that, in order to achieve high infiltration success
in a short time, socialbot accounts need to be highly active,
e.g., they need to post tweets and follow users almost every hour.
This implies that it might be sufficient to monitor those accounts which
are regularly active, in order to prevent bots from becoming influential.
As future work, we note that most socialbot attacks ultimately aim to manipulate public opinion about political candidates, themes or products. Although there exists evidence of opinion change [27, 35], it is still unclear whether, or to what extent, socialbots can influence people’s decisions about products, brands, or political candidates. This is an open research topic that we plan to investigate in future.
Acknowledgements
This work was supported by grants of CAPES, CNPq, and Fapemig.
References
- [1] G. Barbieri, F. Pachet, P. Roy, and M. D. Esposti. Markov Constraints for Generating Lyrics with Style. In European Conference on Artificial Intelligence, volume 242, 2012.
- [2] F. Benevenuto, G. Magno, T. Rodrigues, and V. Almeida. Detecting Spammers on Twitter. In Seventh Annual Collaboration, Electronic messaging, Anti-Abuse and Spam Conference (CEAS), 2010.
- [3] Y. Boshmaf, I. Muslukhov, K. Beznosov, and M. Ripeanu. The socialbot network: when bots socialize for fame and money. In Annual Computer Security Applications Conference (ACSAC), 2011.
- [4] M. C. Calzolari. Analysis of Twitter followers of the US Presidential Election candidates: Barack Obama and Mitt Romney. http://tinyurl.com/obama-romney-followers, Aug 2012.
- [5] C. Castillo, M. Mendoza, and B. Poblete. Information Credibility on Twitter. In World Wide Web Conference (WWW), 2011.
- [6] M. Cha, H. Haddadi, F. Benevenuto, and K. P. Gummadi. Measuring User Influence in Twitter: The Million Follower Fallacy. In AAAI Conference on Weblogs and Social Media (ICWSM), May 2010.
- [7] S. Chhabra, A. Aggarwal, F. Benevenuto, and P. Kumaraguru. Phi.sh/$oCiaL: The Phishing Landscape through Short URLs. In Collaboration, Electronic messaging, Anti-Abuse and Spam Conference (CEAS), 2011.
- [8] Z. Chu, S. Gianvecchio, H. Wang, and S. Jajodia. Detecting automation of twitter accounts: Are you a human, bot, or cyborg? IEEE Trans. Dependable Secur. Comput., 9(6):811–824, Nov. 2012.
- [9] Z. Coburn and G. Marra. Realboy: belieavable twitter bots, 2008. http://ca.olin.edu/2008/realboy/.
- [10] J. D’onfro. Twitter Admits 5% Of Its ‘Users’ Are Fake. http://tinyurl.com/twitter-5pc-users-fake, Oct 2013.
- [11] J. Edwards. There Are 20 Million Fake Users On Twitter, And Twitter Can’t Do Much About Them – Business Insider. http://tinyurl.com/twitter-20M-fake-users, Apr 2013.
- [12] A. Elyashar, M. Fire, D. Kagan, and Y. Elovici. Homing Socialbots: Intrusion on a Specific Organization’s Employee Using Socialbots. In IEEE/ACM Conference on Advances in Social Networks Analysis and Mining (ASONAM), 2013.
- [13] S. Ghosh, B. Viswanath, F. Kooti, N. K. Sharma, G. Korlam, F. Benevenuto, N. Ganguly, and K. P. Gummadi. Understanding and Combating Link Farming in the Twitter Social Network. In World Wide Web Conference (WWW), 2012.
- [14] S. Ghosh, M. B. Zafar, P. Bhattacharya, N. Sharma, N. Ganguly, and K. Gummadi. On Sampling the Wisdom of Crowds: Random vs. Expert Sampling of the Twitter Stream. In ACM Conference on Information & Knowledge Management (CIKM), 2013.
- [15] J. Gomide, A. Veloso, W. M. Jr., V. Almeida, F. Benevenuto, F. Ferraz, and M. Teixeira. Dengue surveillance based on a computational model of spatio-temporal locality of twitter. In ACM Web Science Conference (WebSci), 2011.
- [16] C. Grier, K. Thomas, V. Paxson, and M. Zhang. @spam: The underground on 140 characters or less. In ACM Conference on Computer and Communications Security (CCS), 2010.
- [17] Z. Gyöngyi and H. Garcia-Molina. Link spam alliances. In Proceedings of International Conference on Very Large Data Bases (VLDB), 2005.
- [18] D. Harris. Can evil data scientists fool us all with the world’s best spam? http://tinyurl.com/evil-data-scientists, Feb 2013.
- [19] P. Heymann, G. Koutrika, and H. Garcia-Molina. Fighting spam on social web sites: a survey of approaches and future challenges. IEEE Internet Computing, 11:36–45, 2007.
- [20] R. Jain. The Art of Computer Systems Performance Analysis: Techniques for Experimental Design, Measurement, Simulation, and Modeling. John Wiley and Sons, INC, 1991.
- [21] D. Jurafsky and J. H. Martin. Speech and Language Processing: An Introduction to Natural Language Processing, Computational Linguistics, and Speech Recognition. Prentice Hall PTR, Upper Saddle River, NJ, USA, 1st edition, 2000.
- [22] Klout — The Standard for Influence. http://klout.com/.
- [23] Klout – Wikipedia. http://en.wikipedia.org/wiki/Klout.
- [24] E. Kouloumpis, T. Wilson, and J. Moore. Twitter Sentiment Analysis: The Good, the Bad and the OMG! In Int’l Conference on Weblogs and Social Media (ICWSM), 2011.
- [25] K. Lee, B. D. Eoff, and J. Caverlee. Seven months with the devils: A long-term study of content polluters on twitter. In Int’l Conference on Weblogs and Social Media (ICWSM), 2011.
- [26] J. Messias, L. Schmidt, R. Rabelo, and F. Benevenuto. You followed my bot! Transforming robots into influential users in Twitter. First Monday, 18(7), July 2013.
- [27] L. Muchnik, S. Aral, and S. J. Taylor. Social Influence Bias: A Randomized Experiment. Science, 341(6146):647–651, Aug 2013.
- [28] M. Orcutt. Twitter mischief plagues mexico’s election. http://www.technologyreview.com/news/428286/twitter-mischief-plagues-me%xicos-election/, June 2012.
- [29] A. Pitsillidis, K. Levchenko, C. Kreibich, C. Kanich, G. M. Voelker, V. Paxson, N. Weaver, and S. Savage. Botnet Judo: Fighting Spam with Itself. In Symposium on Network and Distributed System Security (NDSS), 2010.
- [30] E. Protalinski. Twitter sees 218M monthly active users, 163.5M monthly mobile users, 100M daily users, and 500M tweets per day. http://tinyurl.com/twitter-stats-oct13, Oct 2013.
- [31] J. Ratkiewicz, M. Conover, M. Meiss, B. Gonçalves, S. Patil, A. Flammini, and F. Menczer. Truthy: Mapping the spread of astroturf in microblog streams. In World Wide Web Conference (WWW), 2011.
- [32] T. Sakaki, M. Okazaki, and Y. Matsuo. Earthquake shakes twitter users: Real-time event detection by social sensors. In World Wide Web Conference (WWW), 2010.
- [33] B. Stone-Gross, T. Holz, G. Stringhini, and G. Vigna. The Underground Economy of Spam: A Botmaster’s Perspective of Coordinating Large-scale Spam Campaigns. In USENIX Conference on Large-scale Exploits and Emergent Threats (LEET), pages 4–4, 2011.
- [34] K. Thomas, D. McCoy, C. Grier, A. Kolcz, and V. Paxson. Trafficking Fraudulent Accounts: The Role of the Underground Market in Twitter Spam and Abuse. In Usenix Security Symposium, 2013.
- [35] C. Timberg. Research in india suggests google search results can influence an election. http://tinyurl.com/search-influence-election, 2013.
- [36] A. Tumasjan, T. O. Sprenger, P. G. Sandner, and I. M. Welpe. Predicting elections with Twitter: What 140 characters reveal about political sentiment. In Int’l Conference on Weblogs and Social Media (ICWSM), 2010.
- [37] 46% of Twitter users have less than 100 followers - Simplify360. http://simplify360.com/blog/46-of-twitter-users-have-less-than-100-foll%owers/.
- [38] Shutting down spammers, Apr 2012. https://blog.twitter.com/2012/shutting-down-spammers.
- [39] B. Viswanath, A. Post, K. P. Gummadi, and A. Mislove. An analysis of social network-based sybil defenses. SIGCOMM Comput. Commun. Rev., 41(4):–, Aug. 2010.
- [40] C. Wagner, V. Liao, P. Pirolli, L. Nelson, and M. Strohmaier. It’s not in their tweets: modeling topical expertise of Twitter users. In AASE/IEEE International Conference on Social Computing (SocialCom), 2012.
- [41] C. Wagner, S. Mitter, C. Körner, and M. Strohmaier. When social bots attack: Modeling susceptibility of users in online social networks. In 2nd workshop on Making Sense of Microposts at WWW ’12, 2012.
- [42] R. Wald, T. M. Khoshgoftaar, A. Napolitano, and C. Sumner. Which Users Reply to and Interact with Twitter Social Bots? In IEEE Conference on Tools with Artificial Intelligence (ICTAI), Nov 2013.
- [43] Web Ecology Project. http://www.webecologyproject.org/.
- [44] J. D. M. William R. Avison and B. A. P. (Eds.). Mental Health, Social Mirror. Springer, 2007.
- [45] C. M. Zhang and V. Paxson. Detecting and analyzing automated activity on twitter. In International Conference on Passive and Active Measurement (PAM), 2011.