Optical Monitoring of OT 546 in 2009
Abstract
We reported the monitoring results of OT 546 in V, R and I bands, observed on 22 nights from February 16 to July 1 in 2009 at Weihai Observatory of Shandong University. During our monitoring, its variability amplitude was small and a possible microvariability was detected on one night using both C and F tests.
keywords:
AGN: blazar – BL lac: individual: OT 546.1 Introduction
OT 546 (ZW I 187) was classified as a BL Lac object by Angel & Stockmann (1980). An optical variation of 2.1 mag was found in band (Hall & Usher, 1972), but its variability amplitude was small recently. The average brightness in V and B bands were near 16 mag (Kinman, 1976) and 16.7 mag (Pica et al., 1988) respectively. Rapid short term variability was reported by Pica et al. (1988).
2 Observations and results
The optical observations were carried out at Weihai Observatory of Shandong University, using 1.0-m telescope equipped with a back illuminated PIXIS 2048B CCD camera at the cassegrain focus. The field of view was about 12′ 12′. Standard Johnson Cousins filters were used in our observations. The data reduction was carried out following the standard procedure of the IRAF packages. All images were processed by bias and flat-field correction. Then, aperture photometry was used to obtain the instrumental magnitudes for the target and the comparison stars. Comparison stars B, H and L taken from Fiorucci & Tosti (1996) were used, and the magnitude of the source was derived by differential photometry.
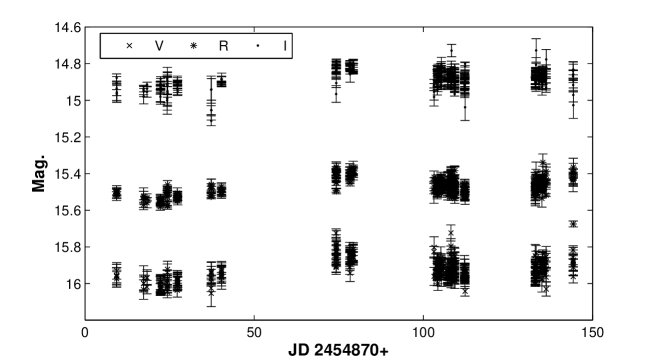
Light curves of the source in V, R and I bands were shown in Figure 1. During our observations, the variability amplitude was small, similar to recent observations (Fiorucci & Tosti, 1996; Katajainen et al., 2000; Xie et al., 2004). The brightness variation in V band was between 15.72 (JD 2454978.142) and 16.05 (JD 2454907.304) mag with an average brightness of 15.92 mag. The observed largest intra-night variability amplitudes in V, R and I bands were 0.259 mag, 0.310 mag and 0.237 mag respectively.
In order to detect the microvariability, both C and F tests have been performed to light curves on these 22 nights. Microvariability was detected only on 1 out of 22 nights, and the C values (Jang & Miller, 1997; Diego, 2010) in V and R bands were 2.767 and 3.271 respectively. At the same time, results of the F-test (Diego, 2010; Gaur et al, 2012) in V and R bands also exceeded the critical F value (1% significance level) on 2009 April 22. So the microvariability is reliable.
Acknowledgements:
This work was partially supported by the NSFC (Nos. 11143012,
11203016, 10778619 and 10778701), and by the NSF of Shandong Province (No. ZR2012AQ008).
References
- Angel & Stockmann (1980) Angel, J. R. P. and Stockmann H. S., 1980, Annu. Rev. Astro. Astrophys., 18, 321
- Diego (2010) de Diego., 2010, Astron. J., 139, 1269
- Hall & Usher (1972) Hall, D. L. and Usher, P. D., 1972, Nat., 243, 31
- Fiorucci & Tosti (1996) Fiorucci, M. and Tosti, G., 1996, Astron. Astrophys. Suppl., 117, 475
- Gaur et al (2012) Gaur, H. et al., 2012, Astron. J., 143, 23
- Jang & Miller (1997) Jang, M. and Miller, H. R., 1997, Astron. J., 114, 565
- Katajainen et al. (2000) Katajainen, S. et al., 2000, Astron. Astrophys. Suppl., 143, 357
- Kinman (1976) Kinman, T. D., 1976, Astrophys. J., 205, 1
- Pica et al. (1988) Pica, A. J. et al., 1988, Astron. J., 96, 1215
- Xie et al. (2004) Xie, G. Z. et al., 2004, Mon. not. R. Astron. Soc., 348, 831