Medium Resolution Near-Infrared Spectra of the Host Galaxies of Nearby Quasars
Abstract
We present medium resolution near-infrared host galaxy spectra of low redshift quasars, PG (z=0.064), PG (z=0.158), and PG (z=0.086). The observations were done by using the Infrared Camera and Spectrograph (IRCS) at the Subaru 8.2 m telescope. The full width at half maximum of the point spread function was about 0.3 arcsec by operations of an adaptive optics system, which can effectively resolve the quasar spectra from the host galaxy spectra. We spent up to several hours per target and developed data reduction methods to reduce the systematic noises of the telluric emissions and absorptions. From the obtained spectra, we identified absorption features of Mg I (1.503 m), Si I (1.589 m) and CO (6-3) (1.619 m), and measured the velocity dispersions of PG to be 132 110 km s-1 and PG to be 264 215 km s-1. By using an relation of elliptical galaxies, we derived the black hole (BH) mass of PG , = 7.7 5.5 and PG , = 9.0 7.5. These values are consistent with the BH mass values from broad emission lines with an assumption of a virial factor of 5.5.
keywords:
galaxies: active-galaxies: kinematics and dynamics1 Introduction
Nearby galaxies have bulge with supermassive black holes (Richstone, 1998). Understanding the link between the supermassive black holes and their host galaxies is important in studying the formation and evolution of the galaxies. The relation of has been discovered, in which is the mass of supermassive black hole and is the stellar velocity dispersion of the bugle (e.g., Ferrarese, Pogge, & Peterson et al., 2001; Gebhardt, Kormendy & Ho et al., 2000; Gebhardt, Bender & Bower et al., 2000).
Nevertheless, the measurements of stellar velocity dispersion of host galaxy are difficult in optical bands because of the presence of young stars in the host galaxy. Absorption lines in optical bands such as Mg b at 517 nm and Ca triplet at 850 nm are diluted by continuum. Therefore, it is necessary to use stellar lines in other wavebands in measuring velocity dispersion. CO bandheads in near-infrared (NIR) have been suggested to be the best in studying the velocity dispersion of nearby galaxies (McConnell, 2011). In addition, NIR stellar lines have the potential of explaining for the relation between supermassive back holes and their host galaxies.
In this paper, we present the medium resolution host galaxy spectra of nearby quasars in H-band obtained at the Subaru telescope. Thanks to the advantages of using adaptive optics technology, we can isolate the quasar spectra from the host galaxy spectra. The obtained spectra with medium resolution can be used to determine the stellar velocity dispersions in the bulge of the host galaxies, and to estimate the supermassive black hole masses.
Section 2 of this paper shows the observation processes. The detailed data reduction processes of NIR quasar spectra are presented in section 3. Results and discussions are shown in section 4. Section 5 is the conclusion.
2 Observations
The observations were performed at the Subaru 8.2 m telescope using the IRCS (Kobayashi et al., 2000) operated with the Adaptive Optics (AO), AO36 (Hayano, Takami, & Guyon et al., 2008), on 2003 February 11 and 2004 April 3 and 4. The average AO-assisted point spread function was 0.3 arcsec.
2.1 Observation of Quasars
We observed three nearby quasars, PG , PG , and PG . Table 1 shows the log of the observations. In 2003, we observed PG only. The slit width was 0.3 arcsec with R = , and the position angle of the slit was 0 deg. The echelle setting of the spectrograph was in setting ( m), and the total integration time was about two hours with each exposure of 180 sec. The observations were done in an Nod-off-slit mode. We first observed the target and then moved the telescope to the nearby background sky. The sequences of the observations were .
In 2004, we observed three targets: PG , PG , and PG . The slit width was 0.6 arcsec with R = 5 . The echelle settings of the spectrograph were in setting ( m) and setting, and the total integration time was one hour for each target. Other instrument settings and the observation modes were the same as in 2003.
2.2 Standard Stars and Template Stars
We observed A0 V type standard stars to correct the telluric absorption lines in the target spectra. In addition, bright template stars (H 5 mag) in spectral classes of G, K, and M with the luminosity class of III are used to measure the velocity dispersions of the host galaxies.
3 Data Reduction
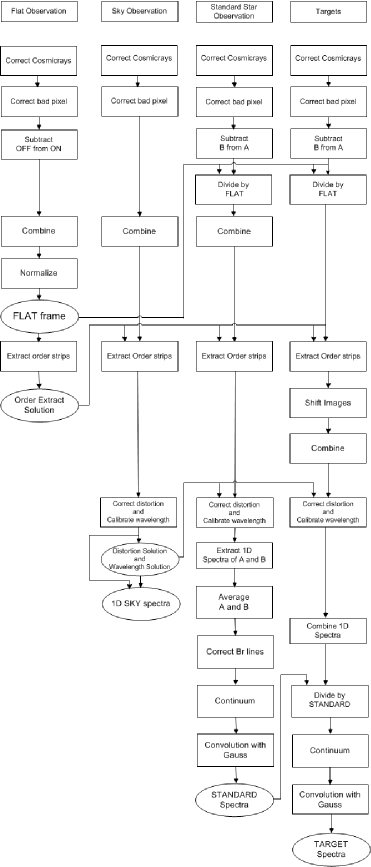
Data reduction was done by using IRAF 111IRAF (Image Reduction and Analysis Facility) is distributed by the National Optical Astronomy Observatories (NOAO). tasks following the methods described in Pyo (2002). The details of the data reduction for standard stars and template stars can be found in Le, Kang, & Pak et al. (2011). The host galaxy spectra were reduced by using similar procedures as that of the template stars. Fig. 1 shows the detailed data reduction processes.
The host galaxy spectra within the radius from 0.24 to 1.89 arcsec are extracted for PG , and from 0.24 to 2.34 arcsec for PG and PG . We chose the minimum radius to be 0.24 arcsec to ensure that the extracted host galaxy spectra are not affected by emission from QSOs. We confined the maximum radius to extract the host galaxy spectra within the effective radii (Peng, Ho, & Impey et al., 2002) of the targets. In the case of PG , the maximum radius is equal to the effective radius, = 1.89 arcsec. The slit length222http:www.naoj.orgObservingInstruments of Subaru/IRCS, L = 5.17 arcsec, however, is shorter than the diameters of PG ( = 12.56 arcsec) and of PG ( = 8.22 arcsec). Therefore, the maximum radius to be extracted should be smaller than half of the slit length, L = 2.59 arcsec.
The effects of the residual OH sky-lines could cause one of the problems of our obtained spectra. The emission lines of OH cannot be completely corrected by the sky-background subtraction processes. We masked out the data points which contain noises from the OH sky-lines.
4 Results and Discussion
4.1 The Host Galaxy Spectra
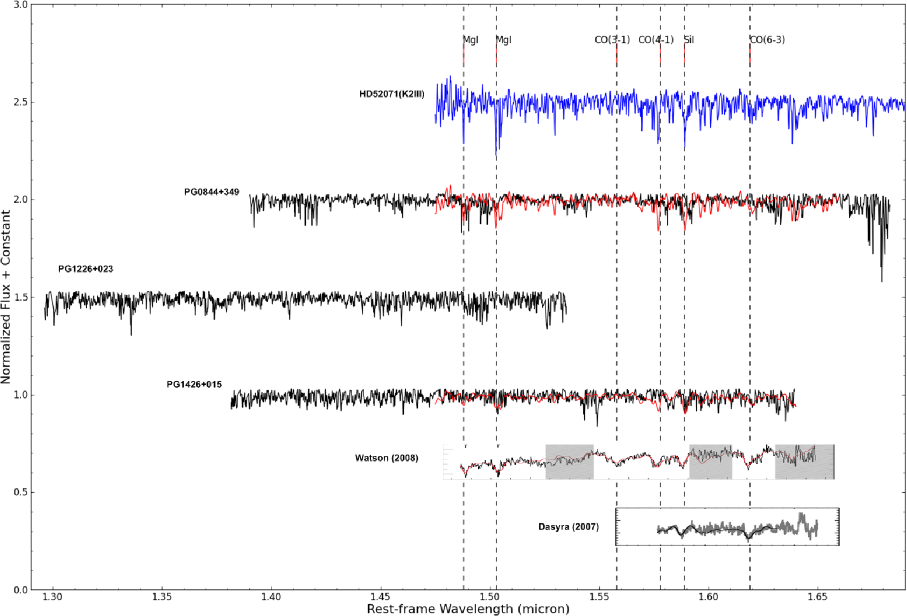
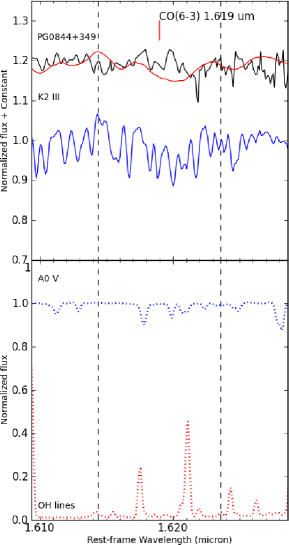
Fig. 2 shows the reduced spectra of PG , PG , and PG . In the figure, the spectrum of K2 III (HD) is also plotted to be compared with the observed host galaxy spectra. In addition, the spectra of PG in Watson, Martini, & Dasyra et al. (2008) and Dasyra, Taconi, & Davies et al. (2007) are shown in the figure for comparisons.
From Fig. 2, we identify prominent features, e.g., Mg I (1.488 m), Mg I (1.503 m), Si I (1.589 m), and CO (6-3) (1.619 m) in the spectrum of PG . But the absorption features such as CO (3-0) (1.558 m) and CO (4-1) (1.578 m) cannot be seen due to the effects of the remaining OH sky-lines.
After the redshift correction, the host galaxy spectrum of PG in Fig. 2 has a limited wavelength coverage to be compared with the molecular lines of the stellar template spectrum. Unfortunately, these are not stellar spectra in the literature that overlap with the observed spectrum of PG to identify the molecular lines.
In the case of PG spectrum, we could detect Mg I (1.503 m), Si I (1.589 m) and CO (6-3) (1.619 m) lines comparing the K2 III stellar template spectrum and the host galaxy spectra of Watson, Martini, & Dasyra et al. (2008) and Dasyra, Taconi, & Davies et al. (2007). But the CO (3-0) (1.558 m) and CO (4-1) (1.578 m) lines are hard to confirm because of the effects of the remaining OH sky-lines. The signal-to-noise (S/N) ratios of Mg I and Si I absorption lines are 3. The S/N ratio of CO (6-3) absorption line is 5.
4.2 Velocity Dispersion
From the obtained spectra, we identified a few stellar absorption lines of the host galaxy and measured the velocity dispersion of the host galaxy using the direct fitting method of Barth, Ho, & Sargent (2002).
We assume that the host galaxy spectrum follows that of K2 III type stars. We define the model of host galaxy spectrum from the equation as
| (1) |
where A is arbitrary constant value from the unknown contribution from the quasar continuum; is convolution of the stellar spectrum with the line-of-sight velocity distribution; is the velocity dispersion; and is the rest wavelength. The best-fit convolved stellar spectrum to the host galaxy spectrum is found based on the minimum of chi-square values. The chi-square value is calculated by
| (2) |
where is the model spectrum from the equation (1); is the observed host galaxy spectrum; and is the error of the host galaxy spectrum which has typical value of 0.037 and is determined by adding the standard deviation of the spectrum to the root-mean-square of each data point.
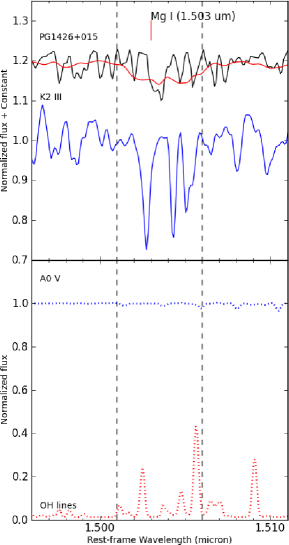
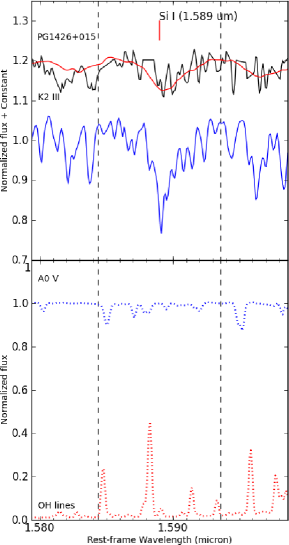
From Fig. 2, due to the redshift correction, we could not measure the velocity dispersion of host galaxy spectrum of PG . In case of PG, we identified some prominent features since the effects of the remaining OH sky-lines make it hard to calculate the velocity dispersion of the host galaxy. We have corrected the remaining OH sly-lines effects by removing those data points of the host galaxy spectra which are affected by sky-lines. We have calculated the velocity dispersion of the host galaxy PG to be 215 km s-1 from the fitting with K2 III stellar spectrum at Mg I (1.503 m) line (Fig. 3) and Si I (1.589 m) line (Fig. 4). The reduced chi-square value is 0.8. In Fig. 5, from the measurement of CO (6-3) (1.619 m), the velocity dispersion of PG is 132 110 km s-1 with the reduced chi-square of 0.4. Due to the low S/N ratio of the data, the errors of velocity dispersions are very large. But the best-fit sigma values which are calculated from our method are consistent with others. From the measurements of Watson, Martini, & Dasyra et al. (2008) and Dasyra, Taconi, & Davies et al. (2007), the velocity dispersions of host galaxy of PG are 217 15 km s-1 and 185 67 km s-1, respectively, which are similar to our results. The data obtained by ISAAC long-slit spectrometer on the 8m Antu unit of the Very Large Telescope (Dasyra, Taconi, & Davies et al., 2007) has higher S/N ratio compared to our data obtained by IRCS, Subaru telescope.
From the velocity dispersion measurements, we derived the black hole masses using the relation of elliptical galaxies (Kormendy & Ho, 2013). Table 2 shows the measured values of velocity dispersion and black hole mass estimates of these quasars. The obtained black hole masses of PG and PG are = 7.7 5.5 and = 9.0 7.5, respectively.
Independently, the BH mass can be determined by using the velocity width of a broad emission line and the broad line region size from the reverberation mapping method (Kaspi, Smith et al., 2000), or the continuum/line luminosity (Kim, Im, & Kim, 2010). Assuming a virial factor of in Onken, Ferrarese, & Merritt et al. (2004) and Woo, Schulze, & Park et al. (2013), Peterson, Ferrarese, & Gilbert et al. (2004) find that the BH masses are = 8.0 0.2 for PG and = 9.1 0.2 for PG .
5 Conclusions
We obtained NIR medium resolution host galaxy spectra of nearby quasars, PG , PG , and PG in H-band, using the IRCS instrument and the AO of the Subaru telescope. The data analysis method of the NIR spectra is presented.
From the spectra, we derived the stellar velocity dispersion of the host galaxy and its relation to the central super-massive BH. From the identified stellar absorption lines, we have obtained the velocity dispersion of PG to be 264 215 km s-1 based on the measurement of Mg I (1.503 m) and Si I (1.589 m). In the case of PG , we have measured the velocity dispersion of the host galaxy to be 132 110 km s-1 based on the calculation of CO (6-3) (1.619 m).
By using an relation of elliptical galaxies, the BH masses of PG and PG are estimated to be = 7.7 5.5 and = 9.0 7.5, respectively. These values are consistent with the BH masses from the quasar broad emission lines.
This work was supported by the National Research Foundation of Korea (NRF) grant, No. 2008-0060544, funded by the Korea government (MSIP). We appreciate Tae-Soo Pyo and Hiroshi Terada for observations and data reductions, and Elaine S. Pak for proofreading this manuscript. LCH acknowledges support from the Chinese Academy of Science through grant No. XDB09030102 (Emergence of Cosmological Structures) from the Strategic Priority Research Program. This work is based on the data collected at Subaru Telescope, which is operated by the National Astronomical Observatory of Japan.
References
- Barth, Ho, & Sargent (2002) Barth, A. J. , Ho, L. C., & Sargent, W. L. W. 2002, A Study of the Direct Fitting Method for Measurement of Galaxy Velocity Dispersions, AJ, 124, 2607
- Dasyra, Taconi, & Davies et al. (2007) Dasyra, K. M., Taconi, L. J., Davies, I. R., Genzel, R., Lutz D., Peterson, B. M., Veilleux, S., Baker, A. J., Schweitzer, M., & Sturm, E. 2007, Host Dynamics and Origin of Palomar-Green QSOs, ApJ, 657, 102
- Ferrarese, Pogge, & Peterson et al. (2001) Ferrarese, L., Pogge, R. W., Peterson, B. M., Merritt, D., Wandel, A., & Joseph, C. L. 2001, Supermassive Black Holes in Active Galactic Nuclei. I. The Consistency of Black Hole Masses in Quiescent and Active Galaxies, ApJ, 555, L79
- Gebhardt, Kormendy & Ho et al. (2000) Gebhardt, K., Kormendy, J., & Ho, L. C., et al. 2000, A Relationship between Nuclear Black Hole Mass and Galaxy Velocity Dispersion, ApJL, 539, L13
- Gebhardt, Bender & Bower et al. (2000) Gebhardt, K., Bender, R., & Bower, G., et al. 2000, Black Hole Mass Estimates from Reverberation Mapping and from Spatially Resolved Kinematics, ApJL, 543, L5
- Hayano, Takami, & Guyon et al. (2008) Hayano, Y., Takami, H., Guyon, O., Oya, S., Hattori, M., Saito, Y., Watanabe, M., Murakami, N., Minowa, Y., Ito, M., Colley, S., Eldred, M., Golota, G., Dinkins, M., Kashikawa, N., & Iye, M. 2008, ”Current status of the laser guide star adaptive optics system for Subaru Telescope,” Proc. SPIE 7015, 701510
- Kaspi, Smith et al. (2000) Kaspi, S., Smith, P. S., Netzer, H., Maoz, D., Jannuzi, B. T., & Giveon, U. 2000, Reverberation Measurements for 17 Quasars and the Size-Mass-Luminosity Relations in Active Galactic Nuclei, ApJ, 533, 631
- Kim, Im, & Kim (2010) Kim, D., Im, M., & Kim, M. 2010, New Estimators of Black Hole Mass in Active Galactic Nuclei with Hydrogen Paschen Lines, ApJ, 724, 386
- Kobayashi et al. (2000) Kobayashi, N., et al. 2000, IRCS: Infrared Camera and Spectrograph for the Subaru Telescope, SPIE, 4008, 1056
- Kormendy & Ho (2013) Kormendy, J., & Ho, L. C. 2013, Coevolution (Or Not) of Supermassive Black Holes and Host Galaxies, ARAA, 51, 511
- Le, Kang, & Pak et al. (2011) Le, H. A. N., Kang, W., Pak, S., Im, M., Lee, J. E., Ho, L. C., Pyo, T. S., & Jaffe, D. T. 2011, Medium Resolution Spectral Library of Late-Type Stellar Templates in Near-Infrared Band, JKAS, 44, 125
- McConnell (2011) McConnell, N. J., et al. 2011, The Black Hole Mass in Brightest Cluster Galaxy NGC 6086, AJ, 728, 100
- Onken, Ferrarese, & Merritt et al. (2004) Onken, C. A., Ferrarese, L., Merritt, D., Peterson, B. M., Pogge, R. W., Vestergaard, M., & Wandel, A. 2004, Supermassive Black Holes in Active Galactic Nuclei. II. Calibration of the Black Hole Mass-Velocity Dispersion Relationship for Active Galactic Nuclei, ApJ, 615, 645
- Peng, Ho, & Impey et al. (2002) Peng, C. Y., Ho, L. C., Impey, C. D., & Rix, H. W. 2002, Detailed Structural Decomposition of Galaxy Images, AJ, 124, 266
- Peterson, Ferrarese, & Gilbert et al. (2004) Peterson, B. M., Ferrarese, L., & Gilbert, K. M., et al. 2004, Central Masses and Broad-Line Region Sizes of Active Galactic Nuclei. II. A Homogeneous Analysis of a Large Reverberation-Mapping Database, ApJ, 613, 682
- Pyo (2002) Pyo, T. S. 2002, Near Infrared [Fe II] Spectroscopy of Jets and Winds Emanating from Young Stellar Objects, Ph.D. thesis, Tokyo Univ.
- Richstone (1998) Richstone, D., et al. 1998, Supermassive Black Holes Then and Now, Nature, 395, A14
- Watson, Martini, & Dasyra et al. (2008) Watson, L. C., Martini, P., Dasyra, K. M., Bentz, M. C., Ferrarese, L., Peterson, B. M., Pogge, R. W., & Tacconi, L. J. 2008, First Stellar Velocity Dispersion Measurement of a Luminous QSO Host with Gemini North Laser Guide Star Adaptive Optics, ApJ, 682, L21
- Woo, Schulze, & Park et al. (2013) Woo, J. H., Schulze, A., Park, D., Kang, W. R., Kim, S. C., & Riechers, D. A. 2013, Do Quiescent and Active Galaxies Have Different Relations?, ApJ, 772, 49
| Date | Quasars | z | R | EchelleSetting | Slit Width | Total Exposure |
|---|---|---|---|---|---|---|
| (UT) | (arcsec) | (sec) | ||||
| 2003 Feb 11 | PG | 0.064 | 10000 | 0.3 | ||
| 2004 April 3 | PG | 0.064 | 5000 | 0.6 | ||
| 2004 April 3 | PG | 0.158 | 5000 | 0.6 | ||
| 2004 April 3 | PG | 0.158 | 5000 | 0.6 | ||
| 2004 April 3 | PG | 0.086 | 5000 | 0.6 | ||
| 2004 April 3 | PG | 0.086 | 5000 | 0.6 | ||
| 2004 April 4 | PG | 0.064 | 5000 | 0.6 | ||
| 2004 April 4 | PG | 0.086 | 5000 | 0.6 | ||
| 2004 April 4 | PG | 0.086 | 5000 | 0.6 |
| Quasars | a | b | c | d |
|---|---|---|---|---|
| (km s-1) | (km s-1) | |||
| PG | 132 110e | 7.7 5.5 | 8.0 0.2 | |
| PG | 264 215f | 217 15 | 9.0 7.5 | 9.1 0.2 |
a This work.
b Velocity dispersion values from Watson, Martini, & Dasyra et al. (2008).
c This work. Black hole mass values are derived by using the formula (7) of Kormendy & Ho (2013).
d Black hole mass values from Peterson, Ferrarese, & Gilbert et al. (2004).
e Velocity dispersion value based on the measurement of CO (6-3) (1.619 m) line.
f Velocity dispersion value based on the measurements of Mg I (1.508 m) and Si I (1.589 m) lines.