DESY–14–082 \prepdateSeptember 2014
Measurement of photoproduction at three different centre-of-mass energies at HERA
ZEUS Collaboration \draftversion2.0 \zeusdate
Abstract
The photoproduction of mesons has been measured with the ZEUS detector at HERA at three different centre-of-mass energies, , of 318, 251 and 225 GeV. For each data set, mesons were required to have transverse momentum, , and pseudorapidity, , in the ranges GeV and . The events were required to have a virtuality of the incoming photon, , of less than 1 GeV2. The dependence on was studied by normalising to the high-statistics measurement at GeV. This led to the cancellation of a number of systematic effects both in data and theory. Predictions from next-to-leading-order QCD describe the dependence of the data well.
The ZEUS Collaboration
H. Abramowicz27,u, I. Abt21, L. Adamczyk8, M. Adamus34, R. Aggarwal4,a, S. Antonelli2, O. Arslan3, V. Aushev16,17,o, Y. Aushev17,o,p, O. Bachynska10, A.N. Barakbaev15, N. Bartosik10, O. Behnke10, J. Behr10, U. Behrens10, A. Bertolin23, S. Bhadra36, I. Bloch11, V. Bokhonov16,o, E.G. Boos15, K. Borras10, I. Brock3, R. Brugnera24, A. Bruni1, B. Brzozowska33, P.J. Bussey12, A. Caldwell21, M. Capua5, C.D. Catterall36, J. Chwastowski7,d, J. Ciborowski33,x, R. Ciesielski10,f, A.M. Cooper-Sarkar22, M. Corradi1, F. Corriveau18, G. D’Agostini26, R.K. Dementiev20, R.C.E. Devenish22, G. Dolinska10, V. Drugakov11, S. Dusini23, J. Ferrando12, J. Figiel7, B. Foster13,l, G. Gach8, A. Garfagnini24, A. Geiser10, A. Gizhko10, L.K. Gladilin20, O. Gogota17, Yu.A. Golubkov20, J. Grebenyuk10, I. Gregor10, G. Grzelak33, O. Gueta27, M. Guzik8, W. Hain10, G. Hartner36, D. Hochman35, R. Hori14, Z.A. Ibrahim6, Y. Iga25, M. Ishitsuka28, A. Iudin17,p, F. Januschek10, I. Kadenko17, S. Kananov27, T. Kanno28, U. Karshon35, M. Kaur4, P. Kaur4,a, L.A. Khein20, D. Kisielewska8, R. Klanner13, U. Klein10,g, N. Kondrashova17,q, O. Kononenko17, Ie. Korol10, I.A. Korzhavina20, A. Kotański9, U. Kötz10, N. Kovalchuk17,r, H. Kowalski10, O. Kuprash10, M. Kuze28, B.B. Levchenko20, A. Levy27, V. Libov10, S. Limentani24, M. Lisovyi10, E. Lobodzinska10, W. Lohmann11, B. Löhr10, E. Lohrmann13, A. Longhin23,t, D. Lontkovskyi10, O.Yu. Lukina20, J. Maeda28,v, I. Makarenko10, J. Malka10, J.F. Martin31, S. Mergelmeyer3, F. Mohamad Idris6,c, K. Mujkic10,h, V. Myronenko10,i, K. Nagano14, A. Nigro26, T. Nobe28, D. Notz10, R.J. Nowak33, K. Olkiewicz7, Yu. Onishchuk17, E. Paul3, W. Perlański33,y, H. Perrey10, N.S. Pokrovskiy15, A.S. Proskuryakov20,aa, M. Przybycień8, A. Raval10, P. Roloff10,j, I. Rubinsky10, M. Ruspa30, V. Samojlov15, D.H. Saxon12, M. Schioppa5, W.B. Schmidke21,s, U. Schneekloth10, T. Schörner-Sadenius10, J. Schwartz18, L.M. Shcheglova20, R. Shevchenko17,p, O. Shkola17,r, I. Singh4,b, I.O. Skillicorn12, W. Słomiński9,e, V. Sola13, A. Solano29, A. Spiridonov10,k, L. Stanco23, N. Stefaniuk10, A. Stern27, T.P. Stewart31, P. Stopa7, J. Sztuk-Dambietz13, D. Szuba13, J. Szuba10, E. Tassi5, T. Temiraliev15, K. Tokushuku14,m, J. Tomaszewska33,z, A. Trofymov17,r, V. Trusov17, T. Tsurugai19, M. Turcato13, O. Turkot10,i, T. Tymieniecka34, A. Verbytskyi21, O. Viazlo17, R. Walczak22, W.A.T. Wan Abdullah6, K. Wichmann10,i, M. Wing32,w, G. Wolf10, S. Yamada14, Y. Yamazaki14,n, N. Zakharchuk17,r, A.F. Żarnecki33, L. Zawiejski7, O. Zenaiev10, B.O. Zhautykov15, N. Zhmak16,o, D.S. Zotkin20
1
INFN Bologna, Bologna, Italy A
2
University and INFN Bologna, Bologna, Italy A
3
Physikalisches Institut der Universität Bonn,
Bonn, Germany B
4
Panjab University, Department of Physics, Chandigarh, India
5
Calabria University,
Physics Department and INFN, Cosenza, Italy A
6
National Centre for Particle Physics, Universiti Malaya, 50603 Kuala Lumpur, Malaysia C
7
The Henryk Niewodniczanski Institute of Nuclear Physics, Polish Academy of
Sciences, Krakow, Poland D
8
AGH-University of Science and Technology, Faculty of Physics and Applied Computer
Science, Krakow, Poland D
9
Department of Physics, Jagellonian University, Cracow, Poland
10
Deutsches Elektronen-Synchrotron DESY, Hamburg, Germany
11
Deutsches Elektronen-Synchrotron DESY, Zeuthen, Germany
12
School of Physics and Astronomy, University of Glasgow,
Glasgow, United Kingdom E
13
Hamburg University, Institute of Experimental Physics, Hamburg,
Germany F
14
Institute of Particle and Nuclear Studies, KEK,
Tsukuba, Japan G
15
Institute of Physics and Technology of Ministry of Education and
Science of Kazakhstan, Almaty, Kazakhstan
16
Institute for Nuclear Research, National Academy of Sciences, Kyiv, Ukraine
17
Department of Nuclear Physics, National Taras Shevchenko University of Kyiv, Kyiv, Ukraine
18
Department of Physics, McGill University,
Montréal, Québec, Canada H3A 2T8 H
19
Meiji Gakuin University, Faculty of General Education,
Yokohama, Japan G
20
Lomonosov Moscow State University, Skobeltsyn Institute of Nuclear Physics,
Moscow, Russia I
21
Max-Planck-Institut für Physik, München, Germany
22
Department of Physics, University of Oxford,
Oxford, United Kingdom E
23
INFN Padova, Padova, Italy A
24
Dipartimento di Fisica dell’ Università and INFN,
Padova, Italy A
25
Polytechnic University, Tokyo, Japan G
26
Dipartimento di Fisica, Università ‘La Sapienza’ and INFN,
Rome, Italy A
27
Raymond and Beverly Sackler Faculty of Exact Sciences, School of Physics,
Tel Aviv University, Tel Aviv, Israel J
28
Department of Physics, Tokyo Institute of Technology,
Tokyo, Japan G
29
Università di Torino and INFN, Torino, Italy A
30
Università del Piemonte Orientale, Novara, and INFN, Torino,
Italy A
31
Department of Physics, University of Toronto, Toronto, Ontario,
Canada M5S 1A7 H
32
Physics and Astronomy Department, University College London,
London, United Kingdom E
33
Faculty of Physics, University of Warsaw, Warsaw, Poland
34
National Centre for Nuclear Research, Warsaw, Poland
35
Department of Particle Physics and Astrophysics, Weizmann
Institute, Rehovot, Israel
36
Department of Physics, York University, Ontario, Canada M3J 1P3 H
A
supported by the Italian National Institute for Nuclear Physics (INFN)
B
supported by the German Federal Ministry for Education and Research (BMBF), under
contract No. 05 H09PDF
C
supported by HIR grant UM.C/625/1/HIR/149 and UMRG grants RU006-2013, RP012A-13AFR and RP012B-13AFR from
Universiti Malaya, and ERGS grant ER004-2012A from the Ministry of Education, Malaysia
D
supported by the National Science Centre under contract No. DEC-2012/06/M/ST2/00428
E
supported by the Science and Technology Facilities Council, UK
F
supported by the German Federal Ministry for Education and Research (BMBF), under
contract No. 05h09GUF, and the SFB 676 of the Deutsche Forschungsgemeinschaft (DFG)
G
supported by the Japanese Ministry of Education, Culture, Sports, Science and Technology
(MEXT) and its grants for Scientific Research
H
supported by the Natural Sciences and Engineering Research Council of Canada (NSERC)
I
supported by RF Presidential grant N 3042.2014.2 for the Leading Scientific Schools and by
the Russian Ministry of Education and Science through its grant for Scientific Research on
High Energy Physics
J
supported by the Israel Science Foundation
a
also funded by Max Planck Institute for Physics, Munich, Germany
b
also funded by Max Planck Institute for Physics, Munich, Germany, now at Sri Guru Granth Sahib World University, Fatehgarh Sahib
c
also at Agensi Nuklear Malaysia, 43000 Kajang, Bangi, Malaysia
d
also at Cracow University of Technology, Faculty of Physics, Mathematics and Applied Computer Science, Poland
e
partially supported by the Polish National Science Centre projects DEC-2011/01/B/ST2/03643 and DEC-2011/03/B/ST2/00220
f
now at Rockefeller University, New York, NY 10065, USA
g
now at University of Liverpool, United Kingdom
h
also affiliated with University College London, UK
i
supported by the Alexander von Humboldt Foundation
j
now at CERN, Geneva, Switzerland
k
also at Institute of Theoretical and Experimental Physics, Moscow, Russia
l
Alexander von Humboldt Professor; also at DESY and University of Oxford
m
also at University of Tokyo, Japan
n
now at Kobe University, Japan
o
supported by DESY, Germany
p
member of National Technical University of Ukraine, Kyiv Polytechnic Institute, Kyiv, Ukraine
q
now at DESY ATLAS group
r
member of National University of Kyiv - Mohyla Academy, Kyiv, Ukraine
s
now at BNL, USA
t
now at LNF, Frascati, Italy
u
also at Max Planck Institute for Physics, Munich, Germany, External Scientific Member
v
now at Tokyo Metropolitan University, Japan
w
also supported by DESY
x
also at Łódź University, Poland
y
member of Łódź University, Poland
z
now at Polish Air Force Academy in Deblin
aa
deceased
1 Introduction
The photoproduction of charm quarks at HERA is a rich testing ground for the predictions of perturbative quantum chromodynamics (pQCD). The predictions are expected to be reliable since the charm mass provides a hard scale in the perturbative expansion. The dominant production mechanism is boson–gluon fusion. Many measurements of charm photoproduction at high centre-of-mass energies, GeV or GeV, have been made at HERA [1, *epj:c72:1995, *epj:c50:251, *epj:c47:597, *pl:b621:56, *np:b472:32, *np:b866:229, *epj:c60:25, *np:b729:492, *pl:b565:87, *pl:b481:213, *pl:b401:192, *pl:b349:225, 14, 15, 16] and compared with QCD predictions at next-to-leading order (NLO). The description of the data is generally reasonable, although the uncertainties on the theory are often large.
Previous results on charm photoproduction were obtained at a single centre-of-mass energy; the dependence on the centre-of-mass energy is presented here for the first time. The variation of the cross section with centre-of-mass energy is sensitive to the gluon distribution in the proton, as different values of Bjorken are probed. Measurements of production at three different centre-of-mass energies, , 251 and 225 GeV, are presented in this paper. The variation of was achieved by varying the proton beam energy, , while keeping the electron111Hereafter “electron” refers to both electrons and positrons unless otherwise stated. beam energy constant, GeV. The data were collected in 2006 and 2007 with , 575 and 460 GeV, referred to, respectively, as the high- (HER), medium- (MER) and low-energy-running (LER) samples. The corresponding luminosities of the HER, MER and LER samples are 144, 6.3 and 13.4 pb-1, respectively. A common analysis procedure is used for all samples and the cross sections at different are presented normalised to that for the HER data, thereby leading to a cancellation of a number of systematic uncertainties both in data and theory.
2 Experimental set-up
A detailed description of the ZEUS detector can be found elsewhere [17]. A brief outline of the components that are most relevant for this analysis is given below.
In the kinematic range of the analysis, charged particles were tracked in the central tracking detector (CTD) [18, *npps:b32:181, *nim:a338:254] and the microvertex detector (MVD) [21]. These components operated in a magnetic field of 1.43 T provided by a thin superconducting solenoid. The CTD consisted of 72 cylindrical drift-chamber layers, organised in nine superlayers covering the polar-angle222The ZEUS coordinate system is a right-handed Cartesian system, with the axis pointing in the proton beam direction, referred to as the “forward direction”, and the axis pointing towards the centre of HERA. The coordinate origin is at the centre of the CTD. The pseudorapidity is defined as , where the polar angle, , is measured with respect to the axis. region . The MVD silicon tracker consisted of a barrel (BMVD) and a forward (FMVD) section. The BMVD contained three layers and provided polar-angle coverage for tracks from to . The four-layer FMVD extended the polar-angle coverage in the forward region to . For CTD–MVD tracks that pass through all nine CTD superlayers, the momentum resolution was , with in GeV.
The high-resolution uranium–scintillator calorimeter (CAL) [22, *nim:a309:101, *nim:a321:356, *nim:a336:23] consisted of three parts: the forward (FCAL), the barrel (BCAL) and the rear (RCAL) calorimeters. Each part was subdivided transversely into towers and longitudinally into one electromagnetic section (EMC) and either one (in RCAL) or two (in BCAL and FCAL) hadronic sections (HAC). The smallest subdivision of the calorimeter was called a cell. The CAL energy resolutions, as measured under test-beam conditions, were for electrons and for hadrons, with in GeV.
The luminosity was measured using the Bethe–Heitler reaction by a luminosity detector which consisted of independent lead–scintillator calorimeter[26, *zfp:c63:391, *acpp:b32:2025] and magnetic spectrometer[29] systems. The fractional systematic uncertainty on the measured luminosity [30] was 1.8 %, composed of correlated and uncorrelated uncertainties of, respectively, 1.5% and 1%.
3 Event selection and signal extraction
3.1 Photoproduction event selection
A three-level trigger system [17, 31, 32] was used to select events online. The first- and second-level trigger used CAL and CTD data to select collisions and to reject beam-gas events. At the third level, the full event information was available. In this analysis, triggers containing a -meson candidate and/or two jets were used.
In order to remove non- background, the position of the primary vertex of an event, , was required to be in the range cm. Photoproduction events were selected by requiring that no scattered electron with energy larger than 5 GeV was found in the CAL [33].
The fraction of the incoming electron momentum carried by the photon, , was reconstructed via the Jacquet–Blondel [34] estimator, , using energy-flow objects (EFOs) [35, *thesis:briskin:1998]. Energy-flow objects combine track and calorimeter information to optimise the resolution of the variable. The value of is given by where is the energy of the electron beam, is the energy of the -th EFO, is its polar angle and the sum runs over all EFOs. The range was used, where the lower cut was set by the trigger requirements and the upper cut suppressed remaining events from deep inelastic scattering with an unidentified low-energy scattered electron in the CAL. The range in corresponds to reconstructed photon–proton centre-of-mass energy, , ranges of GeV, GeV and GeV for the HER, MER, LER samples, respectively.
3.2 Selection of candidates and signal extraction
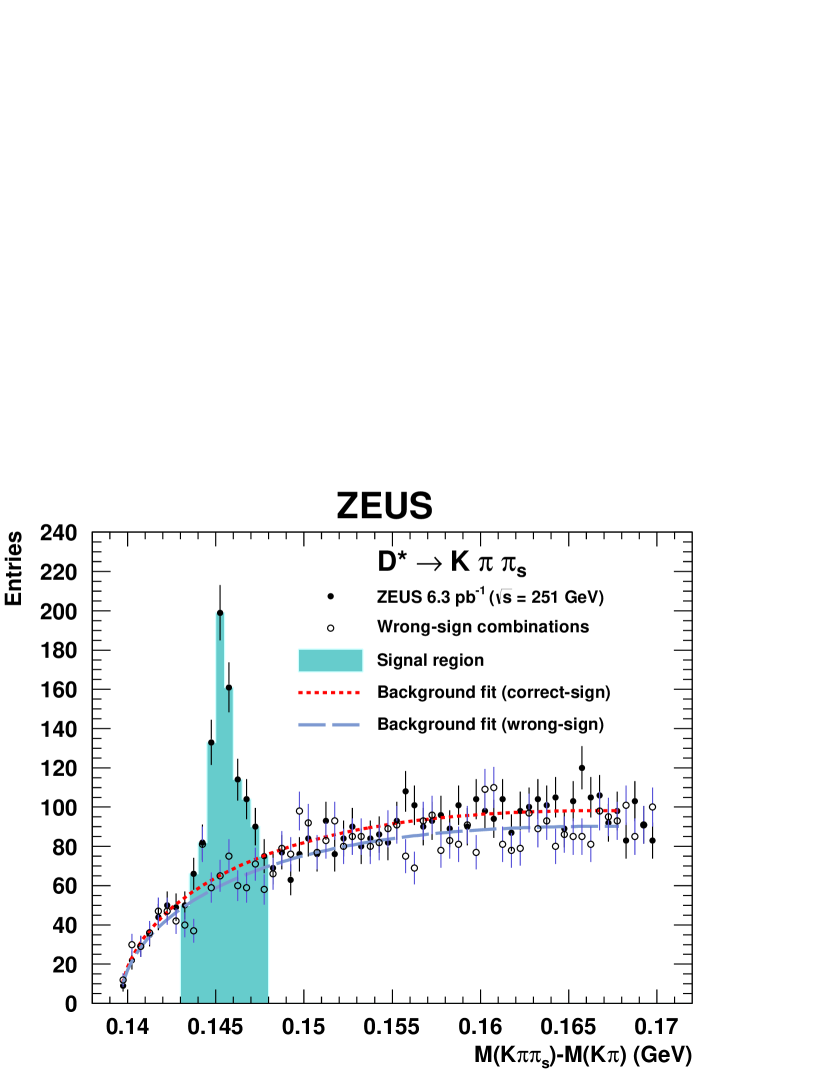
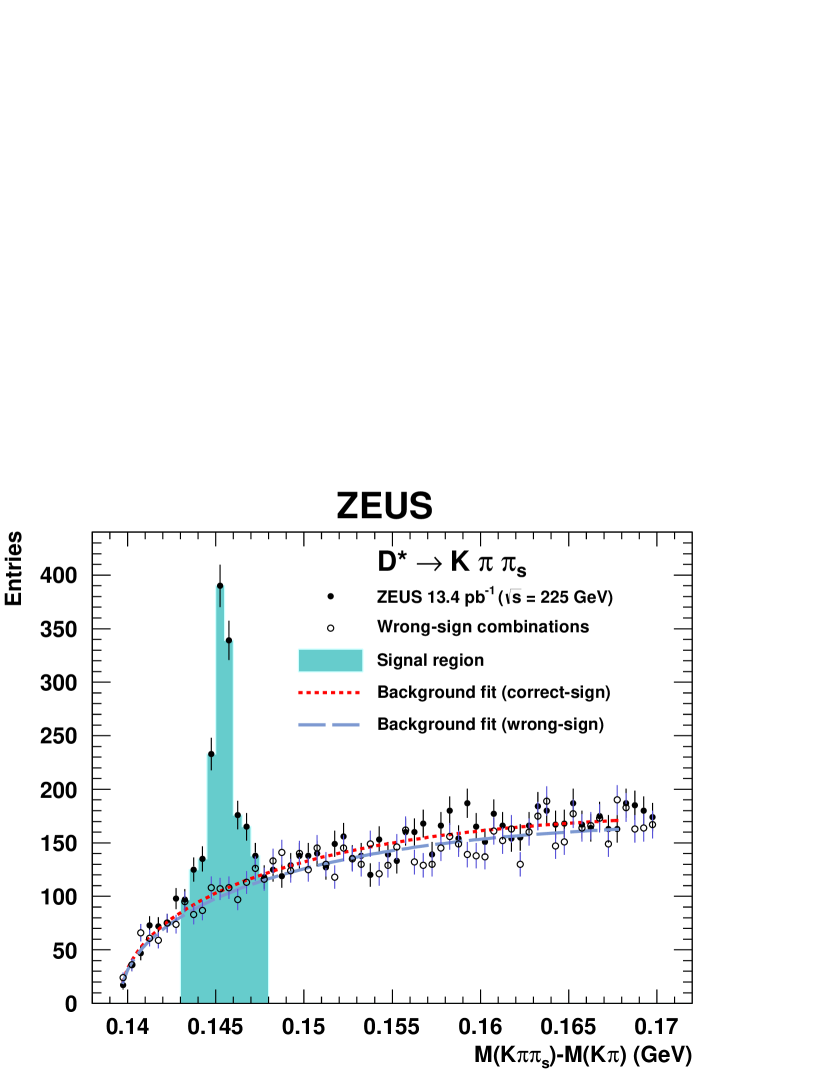
The mesons333Hereafter the charge conjugated states are implied. were identified using the decay channel with the subsequent decay , where refers to a low-momentum (“slow”) pion accompanying the . Tracks from the decay products were required to have at least one hit in the MVD and in the inner superlayer of the CTD and to reach at least the third CTD superlayer. Tracks with opposite charge and with transverse momentum GeV were combined in pairs to form candidates. The tracks were alternately assigned the kaon and pion mass and the invariant mass of the pair, , was calculated. Each additional track with charge opposite to that of the kaon track and a transverse momentum GeV was assigned the pion mass and combined with the candidate to form a candidate. Since more combinatorial background exists in the forward direction as well as at low [14], this was suppressed by requiring , where is the transverse momentum of the meson and is the transverse energy measured using all CAL cells outside a cone of around the forward direction. The mass difference was used to extract the signal. The candidates were required to have GeV, GeV, GeV and pseudorapidity, . To allow the background to be determined, candidates with wrong-sign combinations, in which both tracks forming the candidates have the same charge and the third track has the opposite charge, were also retained. The same kinematic restrictions were applied as for those candidates with correct-charge combinations.
The distributions of for candidates in the HER, MER and LER periods, without the requirement on , are shown in Figs. 1–3. Clear peaks are seen. The signal was extracted by subtracting the correct-sign background estimate from the number of candidates in the signal window GeV. The shape of the background was determined by performing a simultaneous fit to the correct-sign and wrong-sign distributions, as outlined in a previous publication [37]. The fit was performed in the region GeV; the region with a possible signal contribution, GeV, was removed from the fit to the correct-sign distribution. The total signals are , and for the HER, MER and LER samples, respectively.
4 Monte Carlo samples
The acceptance and effects of detector response were determined using samples of simulated events. The Monte Carlo (MC) programme Pythia 6.221 [38, *cpc:135:238], which implements leading-order matrix elements, followed by parton showers and hadronisation, was used. Different subprocesses were generated separately [15]. The CTEQ5L [40] and GRV-LO [41, *pr:d46:1973] sets were used for the proton and photon parton density functions (PDFs), respectively. Samples of charm and beauty events were generated with quark masses, GeV and GeV.
The generated MC events were passed through the ZEUS detector and trigger simulation programmes based on Geant 3.21 [43]. They were then reconstructed and analysed using the same programmes as used for the data.
5 QCD calculations
The data are compared with an NLO QCD prediction from Frixione et al. [44, *np:b454:3] in the fixed-flavour-number scheme (FFNS), in which only light flavours and gluons are present as partons in the proton and heavy quarks are produced in the hard interaction [46]. The following input parameters were set in the calculation: the renormalisation and factorisation scales were set to , where is the average transverse momentum of the charm quarks and the pole mass was GeV; the proton and photon PDFs were ZEUS-S 3-flavour FFNS [47] and GRV-G HO [41, *pr:d46:1973]; the value of the strong coupling constant was for five flavours; and the parameter, , in the Peterson fragmentation function [48] was [49]. The contribution to the visible cross section from beauty production is predicted by MC to be about 2.5%. This value was the same to within 0.1% for all three data sets. Therefore, the beauty contribution cancelled and the uncertainty was negligible when the cross sections were normalised. Hence, the beauty component was not included in the predictions.
Several sources of theoretical uncertainty were investigated and are listed in the following, with the respective effects on the (MER, LER) samples normalised to the HER data given in parentheses:
-
•
the renormalisation and factorisation scales were changed independently to 0.5 and 2 times their nominal value. The largest change in the positive and negative direction was taken as the systematic uncertainty , ;
- •
-
•
the proton PDF was changed to the ABM11 3-flavour FFNS [51] parametrisations (, );
-
•
the value of was changed to 1.35 and 1.65 GeV (, ).
6 Determination of normalised cross sections
Visible photoproduction cross sections in the kinematic region GeV, , GeV2 and were obtained using the formula
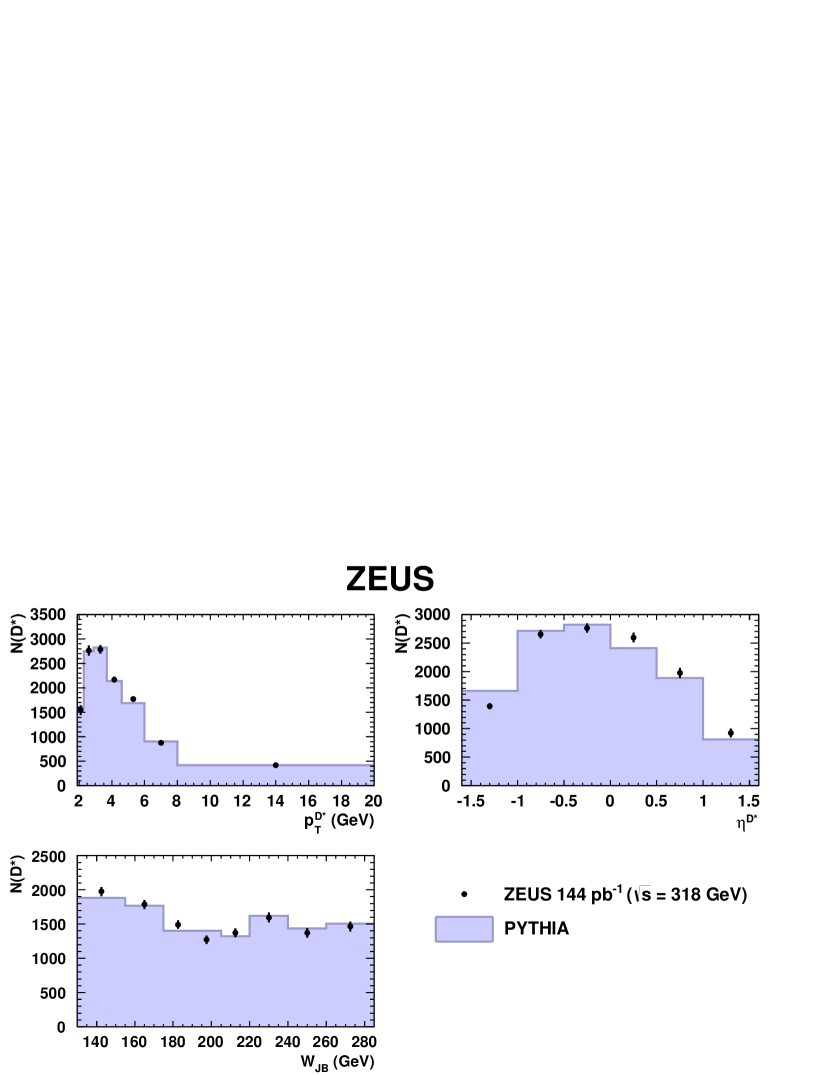
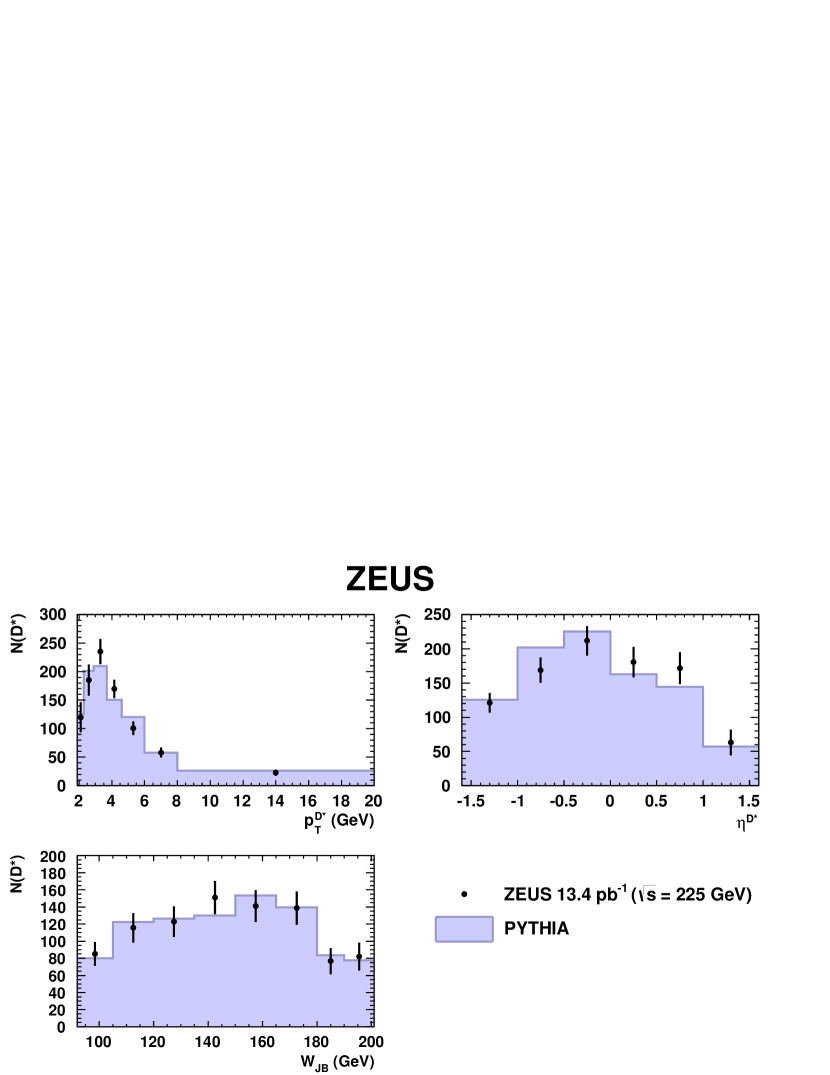
where is the number of mesons in the data, is the product of the branching fractions of the decay with and is the integrated luminosity of the respective sample. The acceptance, , is given by the ratio of the number of reconstructed to generated mesons in the MC simulation, using a mix of charm and beauty production. The sample of beauty MC events, both reconstructed and generated, was scaled by a factor of 1.6, consistent with previous ZEUS measurements [15, 16, 52]. In order to optimise the description of the data and hence determine the acceptances as accurately as possible, the MC was reweighted in for the HER sample and in for the HER, MER and LER data samples. The comparison of background-subtracted data and MC after these reweightings is shown in Figs. 4, 5 and 6, for the HER, MER and LER samples, respectively. The description of the data is reasonable, also for the distributions, for which no reweighting was performed.
The measured cross sections were normalised to the HER data sample:
This allowed the energy dependence of the cross section to be studied to higher precision as a number of systematic uncertainties in data and theory cancel.
The following sources of systematic uncertainty were considered [53], with the effect on and given in parentheses:
-
•
the lower and upper cuts for data and reconstructed MC events were changed by GeV in order to assess the effects of the resolution of and the impact of any residual backgrounds (, );
-
•
the forms of the functions used for MC reweighting in (HER only) and were varied within the uncertainties determined from the quality of the description of the data (, );
-
•
the lower and upper mass requirements for the were varied to 1.80 GeV and 1.93 GeV, both in data and MC. This and the following two sources were performed to assess the uncertainty coming from estimation of the combinatorial background (, );
-
•
the upper edge of the fit range in the distribution was changed to 0.165 GeV, both in data and MC (, );
-
•
the minimum requirement on the ratio was varied between 0.05 and 0.20, both in data and MC (, );
-
•
the uncorrelated uncertainty in the luminosity determination (, ).
The above systematic uncertainties were added in quadrature separately for positive and negative variations. Other sources of systematic uncertainty were found to be negligible and were ignored. These included the uncertainties on the track-finding efficiency, additional reweighting of the MC samples in as well as from the fraction of beauty events used in the acceptance correction. As a cross-check, the number of mesons was also extracted by subtracting the wrong-sign from the correct-sign distribution; the result was consistent with the nominal procedure.
The statistical uncertainties for and include that from the HER sample, although the uncertainties from the MER and LER dominate. The systematic uncertainties also contain contributions from the HER result which are fully correlated between the LER and MER measurements.
7 Energy dependence of cross sections
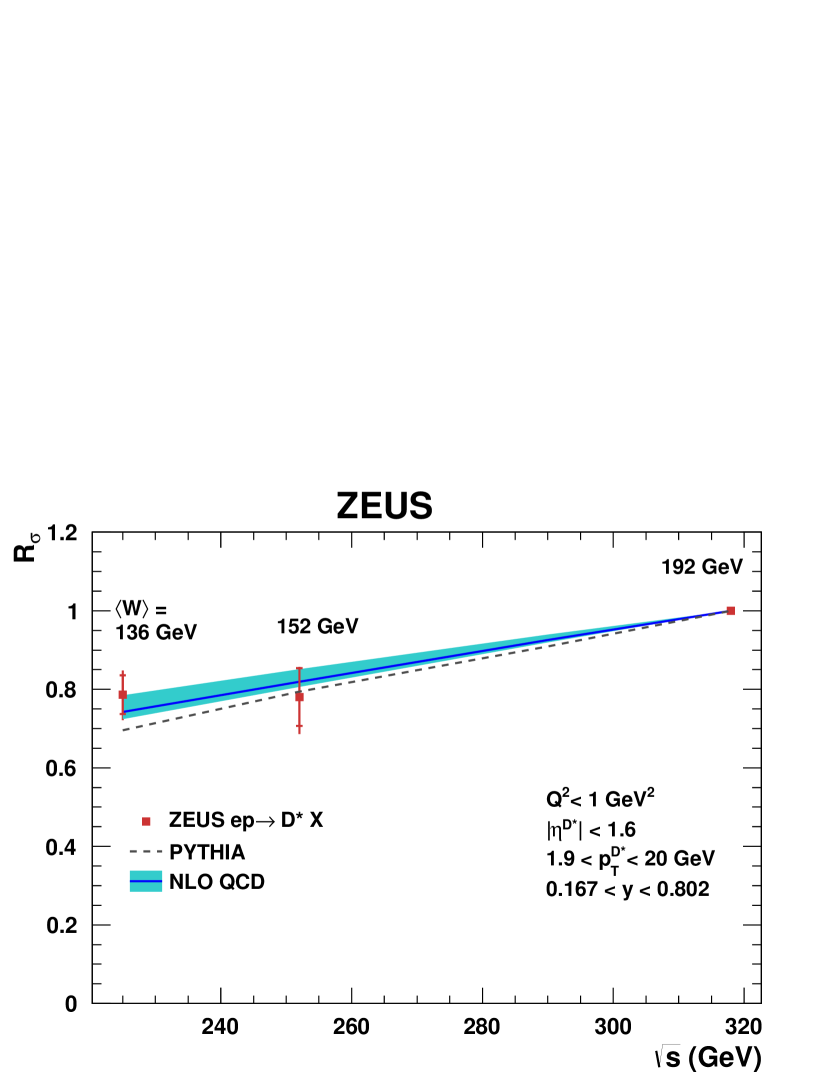
Ratios of visible photoproduction cross sections have been measured in the kinematic region GeV, , GeV2 and . The range in corresponds to photon–proton centre-of-mass energy, , ranges of GeV, GeV and GeV in the HER, MER, LER samples, respectively. The ratios of the visible cross sections for the MER and LER samples to that of the HER sample are:
These values, along with (by constraint equal to unity), are shown in Fig. 7. The cross sections for the MER and LER samples are compatible within uncertainties, but significantly smaller than the cross section for the HER data. This behaviour of increasing cross section with increasing centre-of-mass energy is predicted well by Pythia MC simulations and NLO QCD, although the predictions have a somewhat different slope. This shows that the proton PDFs constrained primarily from inclusive deep inelastic scattering data are able to describe this complementary process which probes in particular the gluon distribution. The physics possibilities of future colliders such as the Large Hadron Electron Collider (LHeC) [54, *jp:g39:075001] are studied using current NLO QCD calculations. The results shown here enhance confidence in the NLO QCD predictions of charm production rates, specifically, and QCD processes, in general, for a future TeV-scale collider.
8 Summary
Photoproduction of mesons has been measured at HERA at three different centre-of-mass energies, , 251 and 225 GeV. For mesons in the range GeV and , cross sections normalised to the result at GeV were measured. Photoproduction events were selected in the range GeV2 and where the range in corresponds to the photon–proton centre-of-mass energies of GeV, GeV and GeV. The cross sections, normalised to that for the highest , show an increase with increasing . This is predicted well by perturbative QCD, demonstrating consistency of the gluon distribution probed here with that extracted in PDF fits to inclusive deep inelastic scattering data.
Acknowledgements
We appreciate the contributions to the construction, maintenance and operation of the ZEUS detector of many people who are not listed as authors. The HERA machine group and the DESY computing staff are especially acknowledged for their success in providing excellent operation of the collider and the data-analysis environment. We thank the DESY directorate for their strong support and encouragement.
10
References
- [1] H1 Collab., F.D. Aaron et al., Eur. Phys. J. C 72, 2047 (2012)
- [2] H1 Collab., F.D. Aaron et al., Eur. Phys. J. C 72, 159 (2012)
- [3] H1 Collab., A. Aktas et al., Eur. Phys. J. C 50, 251 (2007)
- [4] H1 Collab., A. Aktas et al., Eur. Phys. J. C 47, 597 (2007)
- [5] H1 Collab., A. Aktas et al., Phys. Lett. B 621, 56 (2005)
- [6] H1 Collab., S. Aid et al., Nucl. Phys. B 472, 32 (1996)
- [7] ZEUS Collab., H. Abramowicz et al., Nucl. Phys. B 866, 229 (2013)
- [8] ZEUS Collab., S. Chekanov et al., Eur. Phys. J. C 60, 25 (2009)
- [9] ZEUS Collab., S. Chekanov et al., Nucl. Phys. B 729, 492 (2005)
- [10] ZEUS Collab., S. Chekanov et al., Phys. Lett. B 565, 87 (2003)
- [11] ZEUS Collab., J. Breitweg et al., Phys. Lett. B 481, 213 (2000)
- [12] ZEUS Collab., J. Breitweg et al., Phys. Lett. B 401, 192 (1997)
- [13] ZEUS Collab., M. Derrick et al., Phys. Lett. B 349, 225 (1995)
- [14] ZEUS Collab., J. Breitweg et al., Eur. Phys. J. C 6, 67 (1999)
- [15] ZEUS Collab., H. Abramowicz et al., Eur. Phys. J. C 71, 1659 (2011)
- [16] ZEUS Collab., S. Chekanov et al., Phys. Rev. D 78, 072001 (2008)
- [17] ZEUS Collab., U. Holm (ed.), The ZEUS Detector. Status Report (unpublished), DESY (1993). http://www-zeus.desy.de/bluebook/bluebook.html
- [18] N. Harnew et al., Nucl. Instr. and Meth. A 279, 290 (1989)
- [19] B. Foster et al., Nucl. Phys. Proc. Suppl. B 32, 181 (1993)
- [20] B. Foster et al., Nucl. Instr. and Meth. A 338, 254 (1994)
- [21] A. Polini et al., Nucl. Instr. and Meth. A 581, 656 (2007)
- [22] M. Derrick et al., Nucl. Instr. and Meth. A 309, 77 (1991)
- [23] A. Andresen et al., Nucl. Instr. and Meth. A 309, 101 (1991)
- [24] A. Caldwell et al., Nucl. Instr. and Meth. A 321, 356 (1992)
- [25] A. Bernstein et al., Nucl. Instr. and Meth. A 336, 23 (1993)
- [26] J. Andruszków et al., Preprint DESY-92-066, DESY, 1992
- [27] ZEUS Collab., M. Derrick et al., Z. Phys. C 63, 391 (1994)
- [28] J. Andruszków et al., Acta Phys. Pol. B 32, 2025 (2001)
- [29] M. Helbich et al., Nucl. Instr. and Meth. A 565, 572 (2006)
- [30] L. Adamczyk et al., Nucl. Instr. and Meth. A 744, 80 (2014)
- [31] P.D. Allfrey et al., Nucl. Instr. and Meth. A 580, 1257 (2007)
- [32] W.H. Smith, K. Tokushuku and L.W. Wiggers, Proc. Computing in High-Energy Physics (CHEP), Annecy, France, Sept. 1992, C. Verkerk and W. Wojcik (eds.), p. 222. CERN, Geneva, Switzerland (1992). Also in preprint DESY 92-150B
- [33] ZEUS Collab., M. Derrick et al., Phys. Lett. B 322, 287 (1994)
- [34] F. Jacquet and A. Blondel, Proceedings of the Study for an Facility for Europe, U. Amaldi (ed.), p. 391. Hamburg, Germany (1979). Also in preprint DESY 79/48
- [35] ZEUS Collab., J. Breitweg et al., Eur. Phys. J. C 6, 43 (1999)
- [36] G.M. Briskin, Ph.D. Thesis, Tel Aviv University, Report DESY-THESIS 1998-036, 1998
- [37] ZEUS Collab., H. Abramowicz et al., JHEP 05, 097 (2013)
- [38] T. Sjöstrand, Comp. Phys. Comm. 82, 74 (1994)
- [39] T. Sjöstrand et al., Comp. Phys. Comm. 135, 238 (2001)
- [40] H.L. Lai et al., Phys. Rev. D 55, 1280 (1997)
- [41] M. Glück, E. Reya and A. Vogt, Phys. Rev. D 45, 3986 (1992)
- [42] M. Glück, E. Reya and A. Vogt, Phys. Rev. D 46, 1973 (1992)
- [43] R. Brun et al., geant3, Technical Report CERN-DD/EE/84-1, CERN, 1987
- [44] S. Frixione et al., Phys. Lett. B 348, 633 (1995)
- [45] S. Frixione, P. Nason and G. Ridolfi, Nucl. Phys. B 454 (1995)
- [46] J. Smith and W.L. van Neerven, Nucl. Phys. B 374, 36 (1992)
- [47] ZEUS Collab., S. Chekanov et al., Phys. Rev. D 67, 012007 (2003)
- [48] C. Peterson et al., Phys. Rev. D 27, 105 (1983)
- [49] ZEUS Collab., S. Chekanov et al., JHEP 04, 082 (2009)
- [50] H1 Collab., F.D. Aaron et al., Eur. Phys. J. C 59, 589 (2009)
- [51] S. Alekhin and S. Moch, Phys. Lett. B 699, 345 (2011)
- [52] ZEUS Collab., S. Chekanov et al., JHEP 04, 133 (2009)
- [53] N. Zakharchuk, M.Sc. Thesis, University of Kyiv, Kyiv, Ukraine, 2014 (unpublished)
- [54] P. Newman and A. Stasto, Nature Phys. 9, 448 (2013)
- [55] LHeC Study Group, J.L. Abelleira Fernandez et al., J. Phys. G 39, 075001 (2012)