Top quark production at ATLAS and CMS
Abstract
A review of the main recent results on top quark production from the ATLAS and CMS experiments is presented. Results on both electroweak single top quark production and strong top pair production are presented.
1 Introduction
Top quark production proceeds at hadron colliders via strong or electroweak processes. The former results in the production of a top-antitop pair, while the latter results in the production of a single top quark or antiquark, and may proceed via a W exchange in the or channel, or in associated production with a W boson. Top-pair production at LHC is enhanced compared to Tevatron thanks to the larger gluon-fusion contribution. While at Tevatron the channel with the lowest cross section was the associated tW production, which has been only observed at LHC, at LHC the single-top channel has the smallest cross section, and is the hardest channel to probe.
2 Single-top production
Single top quark production in the channel has been measured by ATLAS and CMS both at 7 and 8 TeV. The most recent ATLAS analysis based on an integrated luminosity of 20 fb-1 collected at 8 TeV [1] adopted a neural network discriminant to separate the -channel signal from the backgrounds, using 14 discriminating variables. One electron or muon is required together with two hardonic jets, one of which has been identified as stemming from a b quark. The multijet background is the hardest to model in simulation, and has been determined from data using a fit to the distribution of the transverse missing energy. ATLAS measures a fiducial cross section within the acceptance corresponding to a kinematic selection specified in Ref. [1] to be:
| (1) |
in agreement with theory predictions from different Monte Carlo (MC) generators, as displayed in Fig. 1.
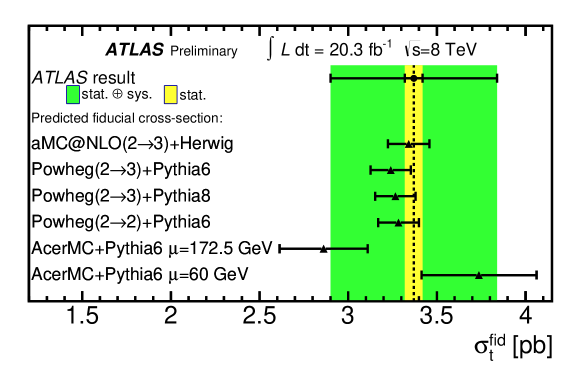
The fiducial cross-section measurement can be extrapolated to the entire phase space using acceptance estimates from generators. Assuming the prediction of the aMC@NLO generator [2] plus Herwig parton shower [3], the inclusive single-top production cross section is:
| (2) |
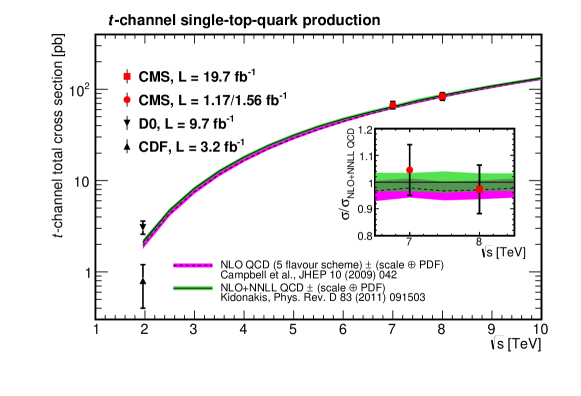
in agreement with next-to-leading order (NLO) theory predictions. CMS measured the single-top production cross section in the channel from a fit to the distribution of the pseudorapidity of the light jet accompanying the top quark [4]. The shapes of the distributions for the W+jets and the backgrounds are determined from control samples in data. Events are selected requiring the presence of one electron or muon together with tho jets, one of which is compatible with a b jet, and the reconstructed top-quark mass must be in the range GeV. The inclusive production cross section determined by CMS is:
| (3) |
The result is in agreement with NLO theory predictions, as shown in Fig. 2, together with a previous CMS measurement at 7 TeV.
CMS also determined the ratio of cross sections at 8 and 7 TeV to be:
| (4) |
and the ratio of top and antitop production cross section to be:
| (5) |
A measurement of the same ratio at 7 TeV by ATLAS gave [5]:
| (6) |
The measurement of associated tW production is limited by the large background. Both ATLAS and CMS use multivariate techniques based on boosted decision trees (BDT) to extract the tW signal. CMS analysis based on 12.2 fb-1 collected at 8 TeV delivered the first observation of tW [6] production with a cross section of:
| (7) |
with a significance of 6.1 standard deviations (5.4 expected). ATLAS analysis based on 20.3 fb-1 has a precision similar to CMS [7]:
| (8) |
and the quoted significance is 4.2 (4.0 expected).
At LHC the single-top channel with the lowest production cross section is the channel. CMS searched for the -channel production in the entire sample at 8 TeV. No significant excess over the expected background was observed, and an upper limit on the production cross sectoin in the channel was set at the 95% confidence level (CL):
| (9) |
This limit corresponds to 2.1 times the standard model (SM) cross section. The largest uncertainty on the above limit is due to the theory modelling of the large background. The use of more recent NLO MC generators to simulate this background is expected to improve the precision of future measurements of this very rare channel. ATLAS published the limit on -channel production at 7 TeV based on the first 0.7 fb-1:
| (10) |
corresponding to 5.8 times the SM cross section value.
2.1 determination
Single-top production allows a direct probe of the tWb copling at the production vertex. In particular, assuming that the branching fraction of the top quark to Wb is equal to one, the square root of the measured single-top production cross section, divided by its theory prediction, computed assuming , must be equal to in the SM. Deviations from such value may be indications of new physics that modifies the tWb vertex coupling. The available measurements of single-top production in the and tW channels allow determinations of with different levels of precision. CMS also quoted a combination of the measurements using the two -channel cross section measurements at 7 and 8 TeV, which achieves the best present precision (4.1%). Table 1 reports the determinations from the available measurements.
| Experiment | Process | Precision | ||
|---|---|---|---|---|
| ATLAS | 7 TeV | -ch. | 11.9% | |
| tW | 17.0% | |||
| 8 TeV | -ch. | 9.8% | ||
| tW | 11.2% | |||
| CMS | 7 TeV | -ch. | 4.8% | |
| tW | 14.8% | |||
| 8 TeV | -ch. | 4.9% | ||
| tW | 12.3% | |||
| 7+8 TeV | -ch. | 4.1% |
2.2 New physics with single top
Single-top production at LHC offers the opportunity to look for new physics that could affect the tgu, tgc, tZu or tZc vertices, exhibiting anomalous couplings, compared to the SM prediction. Such anomalous couplings would result in flavour-changing neutral currents (FCNC). ATLAS studied FCNC at the top production vertex [8], which would result in a single top quark produced without any associated particles. The study based on the 8 TeV data sample set limits to anomalous tgu and tgc coupling that can be translated into limits to the FCNC branching fractions of the top quark:
| (11) | |||||
| (12) |
at the 95% CL. CMS looked for FCNC associated production of a top quark and a Z boson [9], which resulted in limits to anomalous tZu and tZc compling, translated into the following branching ratio limits at the 95% CL:
| (13) | |||||
| (14) |
3 Top-antitop pair production
The most precise determinations of production at LHC is performed using dileptonic events. CMS updated the analysis at 8 TeV using a data sample of 5.3 fb-1, obtaining the following cross section measurement [10]:
| (15) |
ATLAS analyzed the entire 8 TeV dataset implementing an in-situ determination of the b-tagging efficiency from the b-tag multiplicity distribution, and achieved the following result [11]:
| (16) |
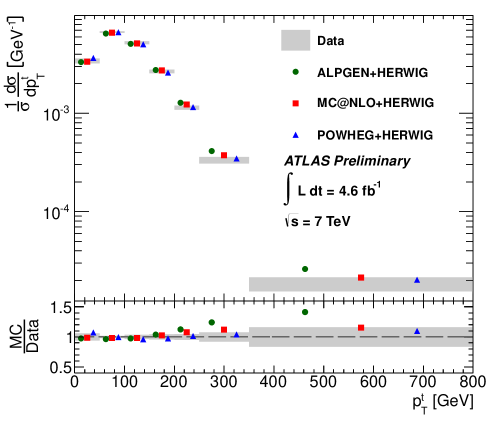
Inclusive cross-section measurements at LHC are in good agreement with the SM prediction, and the large data sample allows studies of differential distribution of several observable quantities, in order to perform more stringent SM tests and to validate detailed features of MC generators. The observed variables include the transverse momentum and rapidity of top quarks and pair, the invariant mass of the pair, additional jet multiplicity, and more. Experimental effects are unfolded from the raw observed spectra. Most of the observed distribution show good ageement with generator prediction. Among the few cases where discrepancies have been observed, Fig. 3 shows that not all MC generators correccly describe the distribution of the top-quark transverse momentum at large values, as reported by ATLAS [12] at 7 TeV.
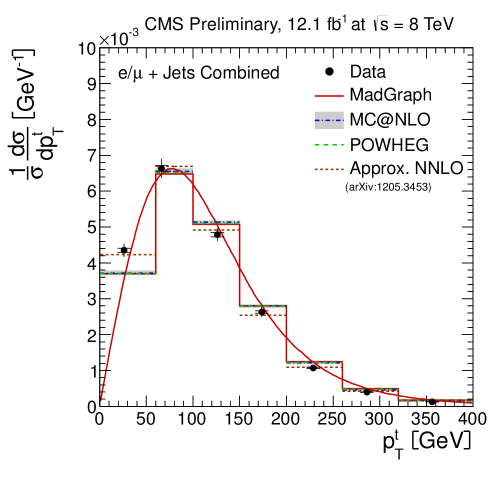
CMS reports at 8 TeV [13] a deficit in the leading-order and next-to-leading-order MC predictions at low top-quark , while the approximate next-to-NLO predictions correctly describe the data. This is shown in Fig. 4.
4 associated production
The production of pairs associated with more particles, either jets or vector bosons, can be studied at LHC exploiting the large integrated luminosity accumulated during the run at 7 and 8 TeV. CMS measured the production of plus a pair [14], which is an important background to ttH and new physics searches. Applying two different thresholds to the transverse momenta of the reconstructed jets, CMS measured the ratio of to plus two jets at 8 TeV:
| (17) | |||||
| (18) |
Both measurements are compatible with the prediction of MadGraph [15] and Powheg [16] generators, though both have central values slightly larger than the SM predictions. ATLAS measured at 7 TeV the incusive production cross section of plus a b or c quark [17]:
| (19) |
assuming the jet has GeV and . This result is also in agreement with the SM predictions, using AlpGen [18], though, as for the previous CMS measurement, the central value is somewhat larger than the theory prediction.
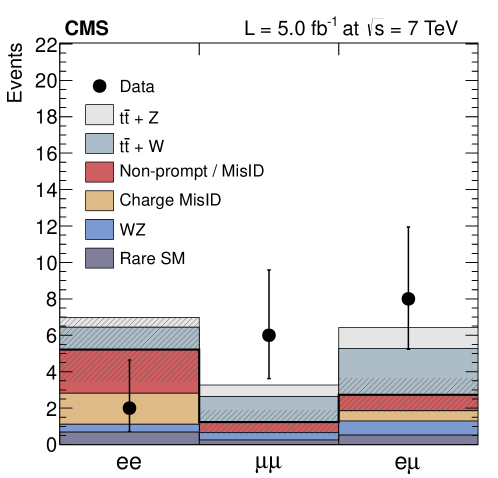
Measurements of associated with W or Z were performed by CMS at 7 TeV [19] using two analyses: an inclusive search of plus either W or Z in events with same-sign lepton pairs (Fig. 5), and an exclusive analysis of events with three leptons, looking for Z. The results have a limited precision, due to the limited number of selected events:
| (20) | |||||
| (21) |
The two measurements have statistical significance of 3.0 and 3.3 standard deviations respectively, and are in agreement with the SM predictions.
ATLAS measured production at 7 TeV in events with a lepton and a jet [20]. Photon fake rate is difficult to model in simulation, and has been determined from data using a fit to the distribution of a variable describing the photon’s isolation (Fig. 6).
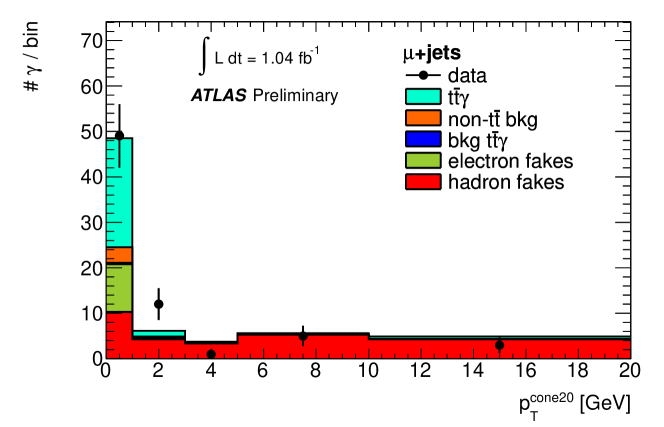
The result is:
| (22) |
assuming a photon transverse energy greater than 8 GeV. CMS updated the measurement at 8 TeV, and the result is:
| (23) |
assuming a photon transverse energy greater than 20 GeV, and a separation between the photon and the b jet from the top-quark decay , which can be translated into:
| (24) |
CMS searched for the production of two top-antitop quark pairs at 8 TeV. This process has a cross section of the order of one fb in the SM [21][22], but could be enhanced in several models beyond the SM. The CMS analysis looks for the decay of one top quark with an electron or muon, and the hadronic decay of the other three top-quark. In order to determine the three-jet combinations that have large probability to come form a top quark decay, dedicated BDTs are trained. A second BDT is used to select signal events adding event variables. The analysis showed no excess over the expected background, and the following upper limit at 95% CL has been set [23]:
| (25) |
5 Conclusions
The precision of top production measurements at LHC is steadily improving, and the focus of ATLAS and CMS is shifting towards the precise understanding of top production mechanism in order to perform detailed comparisons with state-of-the-art QCD predictions, and possibly find deviations from the standard model. The determination of cross sections in fiducial regions is being adopted in order to avoid model-dependent extrapolations that would introduce theory uncertainty. Next updates of LHC activities in top physics will involve both targeting the ultimate precision for upcoming 7 and 8 TeV run-I legacy measurements, and the preparation for run-II data at higher LHC energy.
References
References
- [1] ATLAS Collaboration, ATLAS-CONF-2014-007.
- [2] J. Alwall et al., JHEP 128, 1106 (2011).
- [3] G. Corcella et al., JHEP 010, 0101 (2001).
- [4] CMS Collaboration, arXiv:1403.7366, sub. to JHEP.
- [5] ATLAS Collaboration, ATLAS-CONF-2012-056.
- [6] CMS Collaboration, arxiv:1401.2942 , sub. to Phys. Rev. Lett.
- [7] ATLAS Collaboration, ATLAS-CONF-2013-100.
- [8] ATLAS Collaboration, ATLAS-CONF-2013-063.
- [9] CMS Collaboration, CMS PAS TOP-12-021.
- [10] CMS Collaboration, JHEP 02, 024 (2014).
- [11] ATLAS Collaboration, ATLAS-CONF-2013-097.
- [12] ATLAS Collaboration, ATLAS-CONF-2013-099.
- [13] CMS Collaboration, CMS-PAS TOP-12-027.
- [14] CMS Collaboration, CMS-PAS-TOP-13-010.
- [15] F. Maltoni and T. Stelzer, JHEP 02, 027 (2003).
- [16] S. Alioli et al., JHEP 06, 043 (2010).
- [17] ATLAS Collaboration, Phys. Rev. D89, 072012 (2014).
- [18] M.L. Mangano et al., JHEP 7, 001 (2003).
- [19] CMS Collaboration, Phys. Rev. Lett. 110, 1720 (2013).
- [20] ATLAS Collaboration, ATLAS-CONF-2011-153.
- [21] V. Barger et al., Phys. Lett. B687, 70 (2010).
- [22] M.W.G. Bevilacqua, JHEP 1207, 111 (2012).
- [23] CMS Collaboration, CMS PAS TOP-13-012.