Confirmation of an exoplanet using the transit color signature: Kepler-418b, a blended giant planet in a multiplanet system
Abstract
Aims. We announce confirmation of Kepler-418b, one of two proposed planets in this system. This is the first confirmation of an exoplanet based primarily on the transit color signature technique.
Methods. We used the Kepler public data archive combined with multicolor photometry from the Gran Telescopio de Canarias and radial velocity follow-up using FIES at the Nordic Optical Telescope for confirmation111GTC and photometry and NOT-FIES radial velocity measurements are only available in electronic form at the CDS via anonymous ftp to cdsarc.u-strasbg.fr (130.79.128.5) or via http://cdsweb.u-strasbg.fr/cgi-bin/qcat?J/A+A/.
Results. We report a confident detection of a transit color signature that can only be explained by a compact occulting body, entirely ruling out a contaminating eclipsing binary, a hierarchical triple, or a grazing eclipsing binary. Those findings are corroborated by our radial velocity measurements, which put an upper limit of 1 on the mass of Kepler-418b. We also report that the host star is significantly blended, confirming the % light contamination suspected from the crowding metric in the Kepler light curve measured by the Kepler team. We report detection of an unresolved light source that contributes an additional % to the target star, which would not have been detected without multicolor photometric analysis. The resulting planet-star radius ratio is , more than 25% more than the measured by Kepler leading to a radius of instead of the 0.94 measured by the Kepler team.
Conclusions. This is the first confirmation of an exoplanet candidate based primarily on the transit color signature, demonstrating that this technique is viable from ground for giant planets. It is particularly useful for planets with long periods such as Kepler-418b, which tend to have long transit durations. While this technique is limited to candidates with deep transits from the ground, it may be possible to confirm earth-like exoplanet candidates with a few hours of observing time with an instrument like the James Webb Space Telescope. Additionally, multicolor photometric analysis of transits can reveal unknown stellar neighbors and binary companions that do not affect the classification of the transiting object but can have a very significant effect on the perceived planetary radius.
Key Words.:
Techniques: photometric – planetary systems – star: individual: Kepler-418, KOI 1089, KIC 32472681 Introduction
The Kepler mission (Borucki et al. bor2010 (2010)) has made some of the most fascinating discoveries in exoplanetary science, finding planets as small as Mercury (e.g., Kepler-37b, Barclay et al. bar2013 (2013)), planets in the habitable zone of their host star (e.g., Kepler-22b, Borucki et al. bor2012 (2012)), many confirmed multi-planet systems exhibiting transit timing variations (e.g., Kepler-11, Lissauer et al. lis2011 (2011)), and detecting and releasing to the public thousands of other yet-unconfirmed candidates (Batalha et al bat2013 (2012)). The remaining unconfirmed candidates contain as much potential for interesting discoveries as the confirmed exoplanets, if not more so. However, most of the easy cases have already been resolved, meaning that the remaining candidates present an ever-increasing challenge to validate them as exoplanets.
In the absence of transit timing variations, which allow for the confirmation of multiplanet systems without additional follow-up observations (Holman & Murray hol2005 (2005)), astronomers have relied heavily on spectroscopic measurements of radial velocities to confirm transiting exoplanet candidates. These observations reveal the mass function of the system, which, when combined with the mass of the star, yields the mass of the transiting body – a very straightforward way of eliminating non-planetary false positives. However, this is not always a simple matter. Some eclipsing binaries are contaminated by another light source in such a way that their eclipses appear to be very similar to exoplanetary transits (known colloquially as blends), but they do not necessarily produce an observable radial velocity signal, leading to confusion over whether a given system is a blend or an exoplanetary system with a mass below the detection threshold. The aim of detecting low-mass planets leads to the expenditure of additional telescope time on such systems in an effort to reduce the detection threshold. In multiple instances, extensive follow-up observations returned no conclusive results (e.g., CoRoT’s SRc01 E1 2630, Erikson et al. eri2012 (2012)) Further complicating matters, the amplitude of the radial velocity (RV) signals decreases as period increases and planetary mass decreases and may fall below the level of the intrinsic stellar RV noise (i.e., the so-called “jitter”) due to magnetic activity in stars, typically in the range of 1–10 (e.g., Wright wri2005 (2005)). Even short-period rocky planets around very bright stars can be enormously difficult to detect with RVs, resulting in controversial detections, such as the Earth-sized planet in a 3.4-day orbit around Cen. (Dumusque et al. dum2012 (2012); Hatzes hat2013 (2013)).
Given these limitations, alternative techniques for determining the nature of transiting exoplanet candidates are being developed and tested. In this paper, we present a confirmation of Kepler-418b based primarily on multicolor photometry. In addition to the confirmation, we also detect a large amount of blending in this system from an unresolved source, which would not have been detected without multicolor photometry and leads to a significant revision of the planetary parameters. In Sect. 2, we discuss the multicolor photometric method. In Sect. 3, we describe the target and the Kepler photometry. The ground-based photometric observations and spectral observations used in the analysis are described in Sect. 4 and Sect. 5, respectively. In Sect. 6, we present the results of the analysis, the implications of which we discuss in Sect. 7.
2 Method
The idea of using multicolor photometry of a transit to reject false positives is an old one, dating back to the first practical discussion of the transit method by Rosenblatt (ros1971 (1971)). A colorimetric signature is created during transits due to an interplay between the size of the occulting body and differential stellar limb darkening – the light of the disk of a star is more centrally concentrated in the blue than in the red. Analysis of this signature reveals the true ratio of radii of such a system, regardless of the level of contamination, with small bodies producing a signature that is distinct from grazing eclipsing binaries, triple systems, and blends, as long as the transit/eclipse is not extremely grazing, as the interplay between the small size of the planet relative to the star manifesting as blueward ”spike” at ingress/egress. (Tingley tin2004 (2004), Tingley et al. tin2014 (2014)). This technique can therefore eliminate eclipsing binaries, even if they are contaminated spatially by unresolved stars that distort the shape of the observed light curve (CEBs). It cannot, however, distinguish between transiting bodies that have similar radii to giant exoplanets, such as extremely late red dwarfs and brown dwarfs. Consequently, exoplanets that are larger than the smallest brown dwarfs (larger than Saturn, e.g., Burrows, Heng & Nampaisarn bur2011 (2011)) require a mass limit from RV for confirmation, while those that are smaller can be confirmed using only colorimetry. Larger candidates require additional radial velocity (RV) observations (albeit with full knowledge that an EB/CEB is no longer a possibility), but an upper-mass limit excluding brown dwarfs is sufficient for confirmation.
Given the sensitivity of colorimetry to the true planet-star radius ratio of the system, this technique cannot only identify heavily blended eclipsing binaries masquerading as transiting exoplanets, but also improve the measured radii of bona fide exoplanets that are blended. Light-to-moderate blending of exoplanets is potentially a very serious problem for studies of exoplanets as an ensemble or detailed studies of individual planets (e.g., atmospheres) as blending cannot be identified by monochromatic observations.
3 Kepler-418
We chose Kepler-418b to test this technique based on its long period (86.7 days), its relatively deep (0.81%) and long (10.2 hr) transit, and its faintness (, ), all of which favor the use of the color signature over RV for the confirmation of this system. Also designated KOI 1089 and KIC 3247268, it is a multi-planet candidate system, with a second planet candidate that is smaller (depth of 0.18%) and interior to (period of 12.2 days) its sibling (Borucki et al. (bor2010 (2010)). According to the Kepler input catalog, KIC 3247268 is a dwarf star with an effective temperature of = K, surface gravity of log , metallicity of , and a mass and radius of = and =, respectively, which leads to a planetary radius for Kepler-418b of , just slightly larger than Saturn (Rowe et al. row2013 (2013)).
We based our analysis on the first 14 quarters of Kepler data222Available from http://archive.stsci.edu/kepler. Of these 14 quarters, 7 have long-cadence (LC) data and 4 have short-cadence (SC) data (Q3, Q4, Q5, Q7). Kepler did not observe Kepler-418 during 3 quarters (Q6, Q10, Q14), due to the failure of the MOD-3 module. We estimated the point-to-point scatter of the pre-search data conditioning (PDC) photometry to be 2.8 mmag for the SC data and 0.6 mmag for the LC data.
Kepler-418 is not uncontaminated. According to the Data Validation Report (DVR) for this system333http://exoplanetarchive.ipac.caltech.edu/data/KeplerData/003/003247/003247268/dv/kplr003247268-20121029204534_dvr.pdf, the crowding metric ranges from 0.8873 (high) to 0.9451 (low), with an average of 0.9128. This is apparently the result of a nearby star, namely KIC 3247243, which lies 15″ West of the target and has a magnitude of r=14.3 mag. The variations in the crowding metric appear to be seasonal, with the highest crowding occurring during season 4 (Q4, Q8, Q12). This level of crowding is not negligible, so one could expect the transit of Kepler-418 to produce deeper transits in isolation, and therefore a larger exoplanet than reported by the Kepler team444http://archive.stsci.edu/kepler/koi/search.php. The DVR also red-flagged the photo-center variations on this target. These are almost certainly due to the crowding – during transit, the photo-center would shift towards the primary contaminant.
The crowding can also help explain the significant even-odd transit depth differences the Kepler team has attributed to this candidate during variation times of their analysis procedure – generally considered to be a sign of a contaminating eclipsing binary. Kepler-418b, with a period close to 90 days, has only one transit per Kepler season. Given that season 4 has a significantly higher crowding metric than the other seasons and season 2 is essentially missing due to the failure of the CCD, it is not surprising that the even/odd binary test warns of a possible false positive: as all but one of the transits in the even-numbered seasons comes from the season with the highest crowding, it only stands to reason that the even transits would have a lower apparent transit depth.
4 GTC photometry
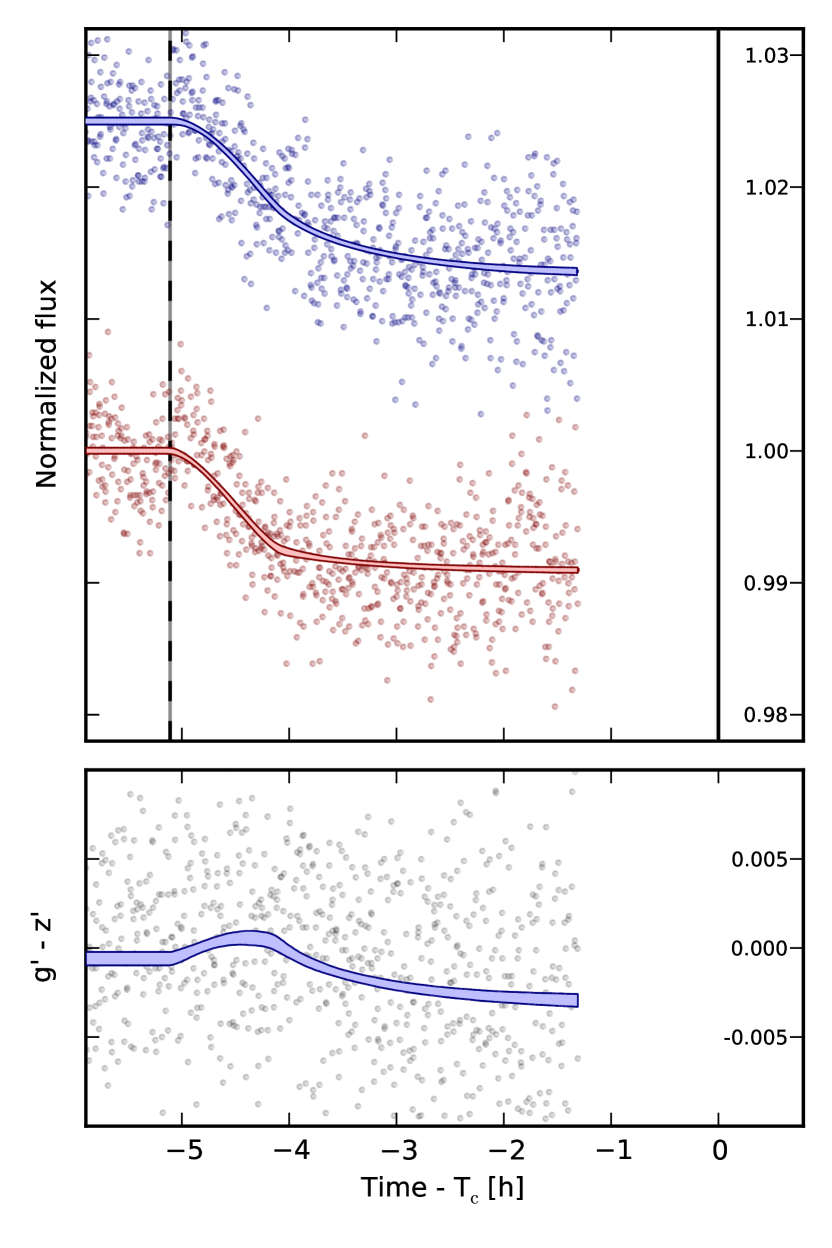
Using the 10.4m Gran Telescopio Canarias (GTC), we observed a transit of Kepler-418b on the night of 14 Aug 2011, which had first contact at UT=23:37 and a mid-transit time of UT=04:41. We spent about 6 hours on target, from UT=22:54 until 05:00, alternating 5 observations in with 5 observations in , both with exposure times of 5.5 s. These filters are well-separated chromatically (, ), so we would expect a relatively strong transit color signature. We obtained 760 exposures in and 755 in , which unfortunately exhibited clear systematic distortions in the shape of the PSF. We extracted useful light curves from these observations using optimized aperture photometry with the IRAF-Vaphot package (Deeg & Doyle dee2001 (2001)), minimizing the impact of the PSF distortions by using apertures much larger than the typical PSF, obtaining point-to-point scatter of 5.3 and 4.8 mmag in and , respectively – several times higher than photon noise, but adequate for our purposes. It should be noted that other groups have reported much better performance with this instrument, using the spectrograph to both defocus the telescope and provide color information (Murgas et al. mur2013 (2013)). Despite this distortion to the PSF, the resolving power of the GTC data (about 1 arcsecond) is still far superior to Kepler (defocused to 10 arcseconds). The resulting light curves can be seen in Fig. 1. As expected, the transit is somewhat deeper than reported by the Kepler team, consistent with the crowding factor they reported. Moreover, a blueward spike is visible during the ingress, visible evidence that the system has a low ratio of radii, as would be expected for a planet.
5 NOT/FIES spectroscopy
The candidate host star is relatively faint (r=14.6 mag), which makes obtaining the necessary RV precision ( m s-1) to confirm an exoplanet like this difficult. We carried out a program of RV measurements in an attempt to measure the mass of Kepler-418b using the FIbre-fed Échelle Spectrograph (FIES; Frandsen & Lindberg frand1999 (1999), Telting et al. telting2014 (2014)) at the Nordic Optical Telescope (NOT), and acquired seven high-resolution (R=67 000) spectra between June and November 2012. We adopted the same instrument set-up, observing strategy, and data reduction described by Gandolfi et al. gandolfi2013 (2013). The FIES RV measurements are listed in Table 1, along with the S/N ratio per pixel at 5500 Å. When folded to the orbital period of Kepler-418b, our measurements are consistent with no detectable RV variation at a level of about 40 m s-1. This puts an upper limit of 1 on the mass of the outermost transiting object, definitively ruling out a false positive scenario consisting of an eclipsing late-type red star/brown dwarf, though not any kind of blended stellar system.
Following the spectral analysis techniques outlined in Gandolfi et al. gandolfi2013 (2013), we used the co-added FIES spectrum, which has a S/N ratio of about 35 per pixel at 5500 Å, to determine the photospheric parameters of Kepler-418 spectroscopically. The microturbulent and macroturbulent velocities were derived using the calibration equations of Bruntt et al. (bru2010 (2012)) for Sun-like dwarf stars. The projected rotational velocity sin was measured by fitting the profile of several isolated metal lines. We found K, log g dex, [M/H] dex, km s-1, km s-1, and sin km s-1(Table 3), slightly more than cooler than the photospheric parameters listed in the Kepler input catalogue (Sect. 3) and consistent with those listed in Everett et al. (eve2013 (2013)). We determined the mass , radius , and age of Kepler-418 by comparing the position of the star on a log g-versus- diagram with a grid of evolutionary tracks and isochrones computed using the PAdova and TRieste Stellar Evolution Code (PARSEC; Bressan et al. bre2012 (2012)). We derived a mass of a radius of and an age of Gyr (Table 3), with the large errors attributable to the error in log g. We use this value of the stellar radius, errors included, to determine the radii of the planets give in Table 4.
| Radial velocity measurements | |||
|---|---|---|---|
| HJD | RV | S/N/pixel | |
| ( 2 450 000) | km s-1 | km s-1 | @5500 Å |
| 6101.64795 | 18.468 | 0.042 | 11 |
| 6107.65513 | 18.457 | 0.034 | 13 |
| 6118.70532 | 18.426 | 0.035 | 13 |
| 6122.59101 | 18.443 | 0.062 | 9 |
| 6222.36569 | 18.472 | 0.030 | 18 |
| 6242.34046 | 18.465 | 0.033 | 12 |
| 6245.34799 | 18.431 | 0.030 | 13 |
| Stellar properties | Spectral characterization | KIC | |
|---|---|---|---|
| effective temperature | [K] | 5820100 | |
| surface gravity () | [dex] | 4.350.10 | |
| metallicity | [dex] | 0.050.10 | |
| projected rotational velocity ( sin ) | [ km s-1] | 3.51.0 | |
| microturbulent velocitya | [ km s-1] | 1.10.1 | |
| macroturbulent velocitya | [ km s-1] | 2.60.4 | |
| systemic velocity | [ km s-1] | ||
| mass | [] | ||
| radius | [] | ||
| age | [Gyr] |
6 System characterization
6.1 Overview
We carried out the system characterization through simultaneous modeling of the Kepler light curves, GTC light curves, and radial velocity measurements. We used Markov Chain Monte Carlo (MCMC) sampling to obtain marginal posterior density estimates for the model parameters describing both planets and their orbits. The joint model has 31 free parameters in total, all listed in Table 3, along with their priors.
We base our analysis on our implementation of the Giménez transit shape model (Giménez Gimenez2006 (2006)), which is optimized for efficient modeling of light curves with hundreds of thousands data points555Available from github.com/hpparvi/PyTransit. We super-sampled the long cadence model using 10 subsamples per LC exposure to reduce the effects from the extended integration time, although the long transit duration of Kepler-418b reduces the impact of the low temporal resolution in this case (Kipping Kipping2010a (2010)). We sampled the posterior distribution with emcee (Foreman-Mackey et al. Foreman-Mackey2013 (2013)), a Python implementation of the Affine Invariant Markov Chain Monte Carlo sampler (Goodman & Weare Goodman2010 (2010)) and initialized it with a rough global solution found with PyDE666Available from github.com/hpparvi/PyDE, our implementation of the differential evolution global optimization algorithm (Storn & Price sto1997 (1997)). We completed the remainder of the analysis using Python, SciPy, NumPy, matplotlib (Hunter hun2007 (2007)), and IPython.
6.2 Blending analysis
Blending analysis was included into the characterization by introducing a third-light source parameterized by the contamination factor and effective temperature of the contaminating source. The amount of third-light for each bandpass (Kepler, , and ) was calculated for each MCMC step by approximating the contaminating source with a black body. A uniform prior from 0 to 0.99 was used on the contamination factor, while the effective temperature had a uniform prior from 2000 K to 15000 K. This blending parameter should not be confused with the Kepler crowding metric, as we used the Kepler PDC data, presumably corrected for crowding, and the GTC data is uncrowded. It therefore represents unresolved and unknown sources of contamination.
6.3 Kepler data
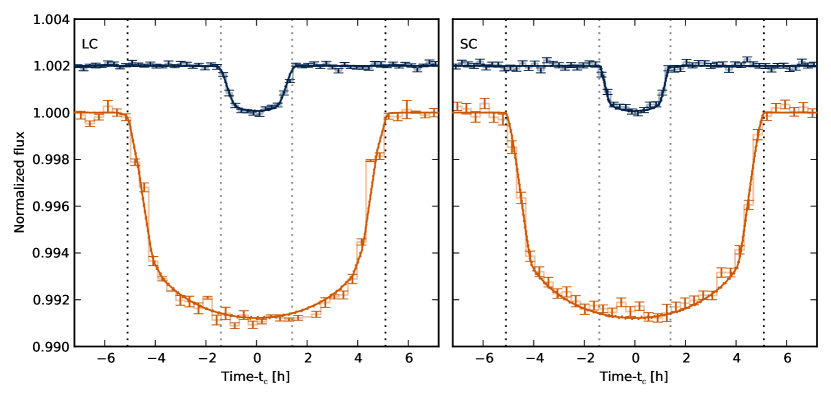
We used the Kepler PDC simple aperture photometry for the analysis, which corrects for the measured crowding metric, using subsets of the light curve comprised of 38.4 h sections centered around each transit. We detrended the individual transit light curves using a second-order polynomial fitted to the out-of-transit points. For those portions of the entire light curve where both LC and SC were available, we used the short time-cadence light curves. The final SC and LC light curves contain and points, respectively.
6.4 Parametrization and priors
We chose to test two approaches to the modeling: (a) with unconstrained limb darkening (uninformative priors on both quadratic limb darkening coefficients) and (b) with constraining (informative) normal priors on the coefficients based on the theoretical values by Claret et al. cla2013 (2013). We constructed the normal priors such that the means match those for stars with and , with standard deviations that are twice those of the theoretical values within the given limits.
We use uninformative priors on all parameters for the run b to obtain the most conservative parameter estimates possible. This was to ensure that we do not bias the blend analysis by making assumptions about the nature of any of the objects contributing to the observed signals.
Moreover, we do not impose constraints on the eccentricity, as our RV data does not supply information about the orbits. The transit durations of the two planets suggest that their orbits are likely eccentric, but no sufficient constraints on the eccentricity can be set based on this. The obtained eccentricity estimates are thus robust upper limits for the orbital eccentricities constrained by the light curves only.
6.5 Posterior sampling
We initialize the emcee sampler using a PyDE-derived parameter vector population clumped around the posterior maxima to reduce the burn-in time. If the posterior space is significantly multimodal, the Differential Evolution algorithm is expected to find the separate modes and allow for an MCMC analysis that spans the whole posterior space. The posterior sampling was carried out by first running the emcee sampler without parallel tempering iteratively with 1200 simultaneous chains (walkers) through a burn-in period consisting of 5 runs of 1000 steps each, after which the walkers had converged to sample the posterior distribution. The final sample sets for both runs consist of 3000 iterations with a thinning factor of 100 (a value based on the chain autocorrelation length estimates), leading to 36000 independent posterior samples.
6.6 Results
We list the model parameter estimates for both approaches in Table 4. The values correspond to the posterior medians and the differences between the medians and the 16th and 84th percentiles, closely corresponding to the posterior mean estimates if the posteriors are close to normal. We show 95% upper limits only if lower limits cannot be established (or if a lower limit equals the parameter’s natural lower limit).
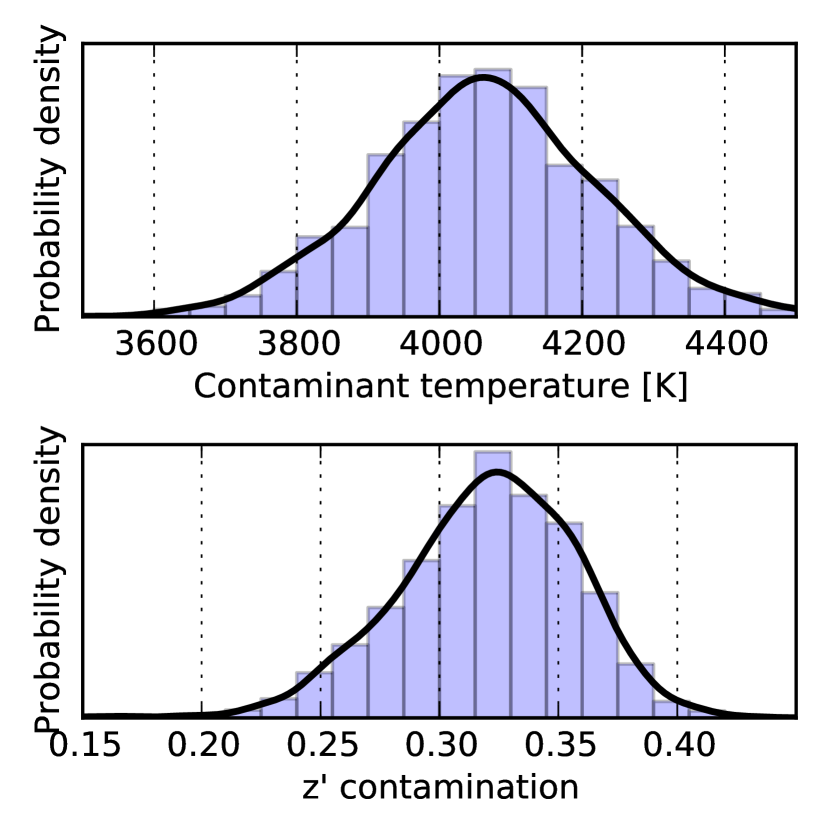
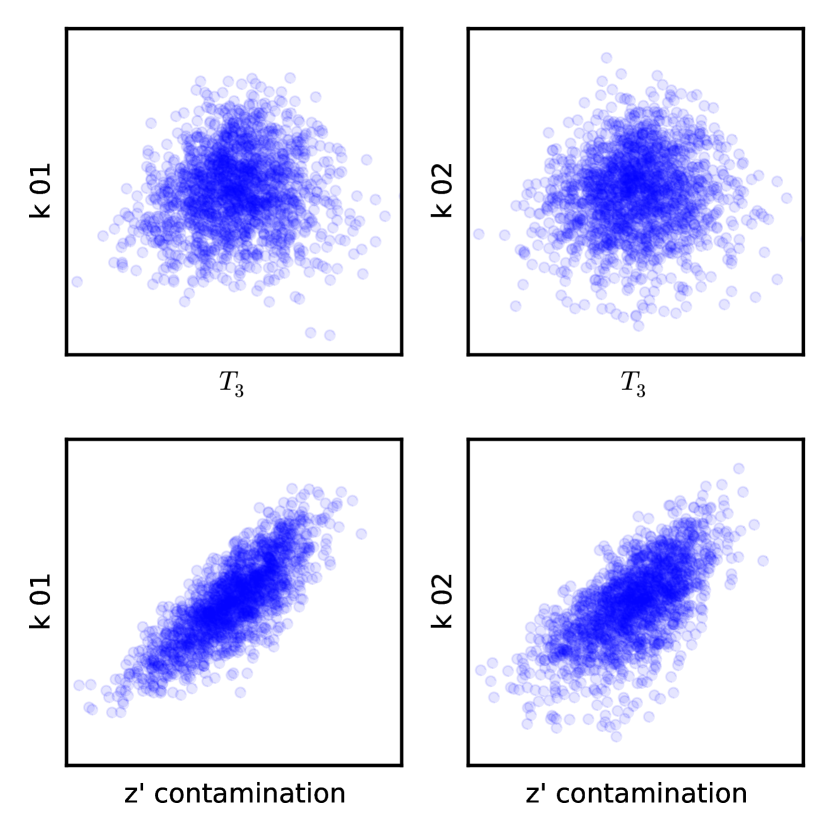
We also plot the marginal distributions for the contaminant temperature and contamination in Fig. 2, and plot the joint posterior for the planet radius ratios, contamination, and contaminant temperature in Fig. 3. The radius ratios are correlated with the contamination, and slightly correlated with limb darkening, but show no significant correlation with other fitting parameters.
The differences in the parameter estimates from the two runs are largely insignificant, well within . This is to be expected, as the estimates from the a run (unconstrained limb darkening) typically have larger uncertainties than the estimates from the b run, and the a run posterior contains the b run posterior. In both cases we obtain a posterior with a clear mode corresponding to % contamination in GTC by a 4000 K contaminating source.
| Parameter name | Units | Prior | |
|---|---|---|---|
| System property priors for Kepler-418b | |||
| zero epoch | Tc1 | d | U(T) |
| period | P1 | d | U(P) |
| area ratio | k | U(, ) | |
| impact parameter | b1 | U(0.0, 0.99) | |
| eccentricity | U(0.0, 0.6) | ||
| arg. of periastron | U(0, ) | ||
| RV semi-amplitude | km/s | U(0.0, 0.2) | |
| System property priors for KOI-1089.02 | |||
| zero epoch | Tc2 | d | U(T) |
| period | P2 | d | U(P) |
| area ratio | k | U(, ) | |
| impact parameter | b2 | U(0.0, 0.99) | |
| eccentricity | U(0.0, 0.6) | ||
| arg. of periastron | U(0, ) | ||
| RV semi-amplitude | km/s | U(0.0, 0.2) | |
| stellar density | g/cm3 | U(0.1, 5.0) | |
| systemic velocity | C | km/s | U(-18.4, -18.5) |
| RV scatter | km/s | U(0.01, 0.17) | |
| Kepler LC scatter | eKl | U(0.0005, 0.0006) | |
| Kepler SC scatter | eKs | U(0.0028, 0.0029) | |
| GTC scatter | e | U(0.0025, 0.0045) | |
| GTC scatter | e | U(0.0025, 0.0045) | |
| GTC baseline | z | U(0.95, 1.05) | |
| GTC baseline | z | U(0.95, 1.05) | |
| contamination | C | U(0.00, 0.99) | |
| contaminant temperature | Tc | K | U(2000, 15000) |
| Stellar property priors: unconstrained quadratic limb darkening | |||
| limb darkening | U( 0.00, 1.00) | ||
| limb darkening | U(-0.35, 0.50) | ||
| limb darkening | U( 0.00, 1.00) | ||
| limb darkening | U(-0.35, 0.50) | ||
| limb darkening | U( 0.00, 1.00) | ||
| limb darkening | U(-0.35, 0.50) | ||
| Stellar property priors: constrained quadratic limb darkening | |||
| limb darkening | N(0.12, 0.03) | ||
| limb darkening | N(0.19, 0.06) | ||
| limb darkening | N(0.32, 0.06) | ||
| limb darkening | N(0.19, 0.06) | ||
| limb darkening | N(0.64, 0.09) | ||
| limb darkening | N(0.13, 0.09) | ||
| ∗ Transit center and orbital period values given by Borucki bor2010 (2010). | |||
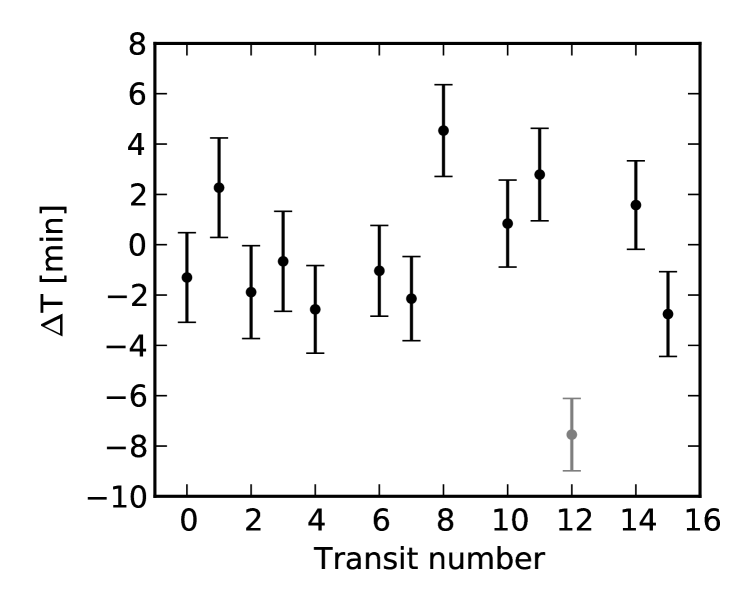
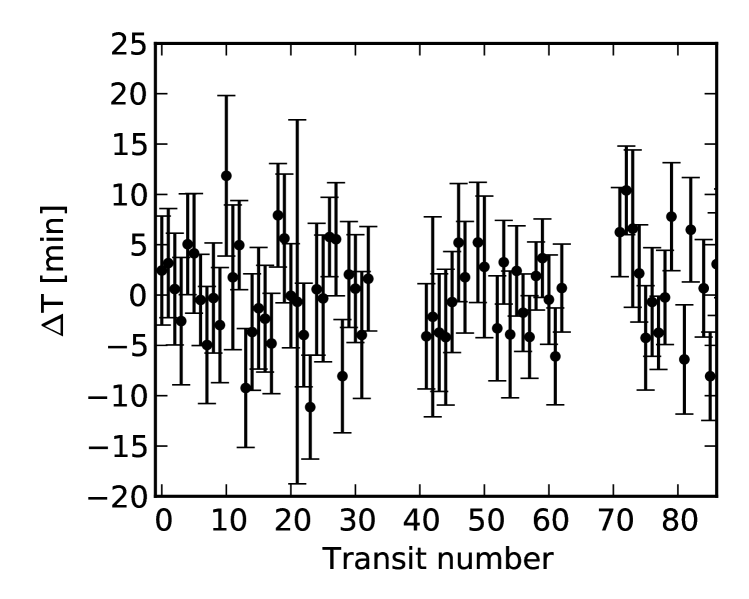
6.7 Search for transit timing variations
We carried out a search for variations in the transit center times (transit timing variations, TTVs), and show the results in Fig. 5. For Kepler-418b, the measured transit centers are completely consistent with a linear ephemeris, once the twelfth transit is removed – it is manifestly affected by some unknown noise source. KOI-1089.02 also shows no sign of significant TTVs. Given the large separation between the two planets both in period and in semi-major axis, the absence of TTVs is not unexpected.
| System properties of Kepler-418b | Free and | Constrained and | |
|---|---|---|---|
| Zero epoch | [HJD - 2454833] | ||
| Period | [d] | ||
| Radius ratio | [Rs] | ||
| Impact parameter | [-] | ||
| Inclination | [deg] | ||
| Transit duration | [h] | ||
| Scaled semi-major axis | [Rs] | ||
| eccentricity | [-] | ||
| omega | [deg] | ||
| RV semi-amplitude | [km/s] | ||
| Radius | [RJup] | ||
| Mass | [MJup] | ||
| surface gravityb () | [dex] | ||
| System properties of KOI-1089.02 | Free and | Constrained and | |
| Zero epoch | [HJD - 2454833] | ||
| Period | [d] | ||
| Radius ratio | [Rs] | ||
| Impact parameter | [-] | ||
| Inclination | [deg] | ||
| Transit duration | [h] | ||
| Scaled semi-major axis | [Rs] | ||
| eccentricity | [-] | ||
| omega | [deg] | ||
| RV semi-amplitude | [km/s] | ||
| Radius | [RJup] | ||
| Mass | [MJup] | ||
| surface gravityb () | [dex] | ||
| Stellar properties from transit fit | Free and | Constrained and | |
| Linear ldc | [-] | ||
| Quadratic ldc | [-] | ||
| Linear ldc | [-] | ||
| Quadratic ldc | [-] | ||
| Linear ldc | [-] | ||
| Quadratic ldc | [-] | ||
| Stellar density | [g/cm3] | ||
| contamination | [-] | ||
| contamination | [-] | ||
| contamination | [-] | ||
| Contaminant temperature | [K] | ||
| Light curve noise characteristics | Free and | Constrained and | |
| , long-cadencec | [mmag] | ||
| , short-cadencec | [mmag] | ||
| c | [mmag] | ||
| c | [mmag] | ||
| a 95% upper confidence limit. | |||
| b Calculated using Eq. 6.35 of Perryman Perryman2011 (2011). | |||
| c Point-to-point noise. | |||
7 Conclusions
We confirm that Kepler-418b is a transiting exoplanet with an upper mass limit of 1 . We base this confirmation primarily on the detection of a transit color signature that is consistent with a compact occulting body, ruling out all CEBs and high radius-ratio EBs, and secondarily by setting an upper mass limit that rules out brown and red dwarfs, even highly eccentric ones that would exhibit only secondary eclipses, as discussed in Santerne (san2013 (2013)). We required only 13 hours of observations for this confirmation, 6 with the GTC and 7 with the NOT. This is significantly less than would have been necessary for a confirmation with RV alone with sufficient significance to rule out CEBs through bisector analysis. For example, CoRoT-9b, a similar system, required 14 hours of observing time with the HARPS spectrograph on the ESO 3.6m telescope for confirmation (Deeg et al. dee2010 (2010)). A similarly confident detection for Kepler-418b, which is 1.3 magnitudes fainter, would require 46 hours of observations, based on the scaling laws by Bouch, Pepe & Queloz (bou2001 (2001)).
We detect moderate contamination from an unresolved and unknown third source in both Kepler and GTC photometry. The contaminant is estimated to contribute of the observed flux in . Despite the high level of contamination, we would not expect to be able to detect it in our spectra, due to their low signal-to-noise, and indeed we do not.
The Kepler-418 system is an example of a blended exoplanet system. Multicolor photometric analysis is the only technique to date that can definitively identify low levels of contamination. While Kepler-418b may be one of the first for which significant contamination was detected, it is unlikely to be unique. Contamination has a measurable impact on planet parameters and may even affect detailed studies of planetary atmospheres, particularly if the contaminating star is cool and the observations are in the infrared.
Acknowledgements.
This article is based on observations made with the GTC operated on the island of La Palma by the IAC in the Spanish Observatorio of El Roque. The Kepler data presented in this paper were obtained from the Multimission Archive at the Space Telescope Science Institute (MAST). STScI is operated by the Association of Universities for Research in Astronomy, Inc., under NASA contract NAS5-26555. Support for MAST for non-HST data is provided by the NASA Office of Space Science via grant NNX09AF08G and by other grants and contracts. HD acknowledges funding by grant AYA2012-39346-C02-02 of the Spanish Ministry of Science and Innovation (MICINN). Based on observations obtained with the Nordic Optical Telescope (NOT), operated on the island of La Palma jointly by Denmark, Finland, Iceland, Norway, and Sweden, in the Spanish Observatorio del Roque de los Muchachos of the Instituto de Astrofisica de Canarias, in time allocated by OPTICON by the Spanish Time Allocation Committee (CAT), through a NOT “fast-track” service programme. The research leading to these results has received funding from the European Community’s Seventh Framework Programme (FP7/2007-2013) under grant agreement numbers RG226604 (OPTICON) and 267251 (AstroFit).References
- (1) Barclay, T. et al. 2013, Nature, 494, 452
- (2) Batalha, N. et al. 2013, ApJS, 204, 24
- (3) Borucki, W. J. et al. 2010, Science, 327, 977
- (4) Borucki, W. J. et al. 2012, ApJ, 728, 117
- (5) Borsa, F. & Poretti, E. 2013, MNRAS, 428, 891
- (6) Bouchy, F., Pepe, F. & Queloz, D. 2001, A&A, 374, 733
- (7) Bressan, A. et al. 2012, MNRAS, 427, 127
- (8) Bruntt, H. et al. 2010, MNRAS, 405, 1907
- (9) Burrows, A. Heng, K., & Nampaisarn, T. 2011, ApJ, 736, 47
- (10) Claret, A., et al. 2013, A&A, 552, A16
- (11) Deeg, H. J. & Doyle, L. R. 2001, proc. of “Third Workshop on Photometry”, Eds. W. Borucki and L. E. Lasher, NASA/CP-2000-209614, p. 85
- (12) Deeg, H. J. et al. 2010, Nature, 464, 384
- (13) Dumusque, X., et al., 2012, Nature, 491, 207
- (14) Erikson, A. et al. 2012, A&A, 539, A14
- (15) Everett, M. E., Howell, S. B., Silva, D. R. & Szkody, P. 2013, ApJ, 771,107
- (16) Ford, E. B. 2005, AJ, 129, 1706
- (17) Foreman-Mackey, D., Hogg, D. W., Lang, D.,& Goodman, J. 2013, PASP, 123, 306
- (18) Frandsen, S. & Lindberg, B. 1999, in “Astrophysics with the NOT”, proceedings Eds: Karttunen, H. & Piirola, V., anot. conf, 71
- (19) Gandolfi D., et al. 2013, A&A, 557, 74
- (20) Giménez, A. 2006, A&A, 450, 1231
- (21) Goodman, J. & Weare, J. 2010, Communications in Applied Mathematics and Computational Science, 5, 65
- (22) Hatzes, A. P. 2013, arXiv:1305.4960
- (23) Holman, M. & Murray 2005, Sci, 307, 1288
- (24) Hunter, J. D. 2007, Computing in Science & Engineering 9, 90–95
- (25) Kass, R. E. & Raftery, A. E. 1995, Journal of the American Statistical Association, 430, 773
- (26) Kipping, D. M. 2010, MNRAS, 408, 1758
- (27) Lissauer, J. et al. 2011, Nature, 470, 53
- (28) Lissauer, J. et al. 2012, ApJ, 750, L112
- (29) Mugas, F. et al. 2013, in Hot Planet and Cool Stars, EPJ Web of Conferences, 47, 11002
- (30) Perryman, M. The Exoplanet Handbook, 424 Cambridge University Press, 2011
- (31) Rosenblatt, F. 1971, Icarus, 14, 71
- (32) Rowe, J. et al. 2014, ApJ, 784, 45
- (33) Santerne, A. et al. 2013, A&A, 557, 139
- (34) Storn, R. & Price, K. 1997, Journal of Global Optimization, 11, 341
- (35) Schwarz, G. 1978, The Annals of Statistics, 2, 461
- (36) Telting, J. H. et al. 2014, AN, 335, 41
- (37) Tingley, B. 2004, A&A, 425, 1125
- (38) Tingley, B. et al. 2011, A&A, 536, L9
- (39) Tingley, B. et al. 2013, submitted to A&A
- (40) Wright, J. T. 2005, PASP, 117, 657