Cooperative Emission of a Coherent Superflash of Light
Abstract
We investigate the transient coherent transmission of light through an optically thick cold strontium gas. We observe a coherent superflash just after an abrupt probe extinction, with peak intensity more than three times the incident one. We show that this coherent superflash is a direct signature of the cooperative forward emission of the atoms. By engineering fast transient phenomena on the incident field, we give a clear and simple picture of the physical mechanisms at play.
pacs:
42.50.Md, 42.25.DdFor many decades, coherent transient phenomena have been used to characterize decays and dephasing in resonantly driven two-level systems Slichter (1990); Allen and Eberly (1974). A rich variety of systems, with their own particularities, ranging from NMR Bloembergen et al. (1948); Hahn (1950) to electromagnetic resonances in atoms Toyoda et al. (1997); Pietiläinen et al. (1998); Zamith et al. (2001); Chalony et al. (2011), molecules Brewer and Shoemaker (1972); Foster et al. (1974); Brewer and Genack (1976); Judson and Rabitz (1992) and nuclei Helistö et al. (1982); Ikonen et al. (1985), have been used. A simple situation arises when an electromagnetic wave is sent through a sample composed of atomic (or molecular) scatterers. The abrupt switch off of a monochromatic quasiresonant excitation leads to free induction decay in the forward direction Brewer and Shoemaker (1972). Temporal shapes and characteristic decay times of free induction decay depend on quantities such as laser frequency detuning Toyoda et al. (1997), optical thickness Shim et al. (2002); Chalony et al. (2011), and on the presence of inhomogeneous broadening Brewer and Shoemaker (1972) and nonlinearities Ducloy (1977). For an optically thick medium, since the incoming light is almost completely depleted by scattering in the stationary regime, the free induction decay signal takes the form of a coherent flash of light Chalony et al. (2011). Its duration is reduced with respect to the single scatterer lifetime by a factor of the order of the optical thickness Chalony et al. (2011). Consequently, its experimental observation, using standard optical transitions (lifetime in the nanosecond range), is rather challenging Wei et al. (2009). In this Letter, we solve this issue by performing free induction decay on the intercombination line of a cold strontium atomic gas. We gain physical insight into coherent transmission, and observe a coherent superflash of light, i.e., a transmitted intensity larger than the incident one [see Fig. 1(c)]. The superflash is due to strong phase rotation and large amplitude of the forward scattered field which are directly measured in our experiment.
Related effects have been observed in Mössbauer spectroscopy experiments, where a temporal phase change in the radiation can lead to transient oscillations of the intensity transmitted through a sample Helistö et al. (1982); Ikonen et al. (1985). These oscillations are rather small, typically of the order of 1%. This is because the emitter used has a short coherence time. Note that no superflash was ever observed. In a refined “ echo” experiment, a coincidence detection made it possible to shift the phase of the emitter at a specific time during its exponential decay, leading to a revival of the forward transmitted intensity Helistö et al. (1991). Laser spectroscopy is, however, a much easier and flexible tool. First, the temporal or spectral properties of the source can be tuned almost at will, and second, a dilute cold atomic gas can be thought of as a collection of independent identical highly-resonant two-level systems.
We first consider a scheme where a laser beam is sent through a slab uniformly filled with resonant pointlike scatterers. In the stationary regime, scattering leads to an attenuation of the intensity, , of the transmitted coherent field , according to the Beer-Lambert law
| (1) |
where is the intensity of the incident field and is the optical thickness of the medium. The power lost in the coherent transmission, , leaves the medium in all directions Fioretti et al. (1998); Labeyrie et al. (2003). In general, since the positions of the scatterers are random, the reemitted field is incoherent (i.e., the phase of the incident field is lost). This statement is, however, not true in the forward direction, where the phase of the scattered field does not depend on the (transverse) positions of the scatterers 111Partial coherence exists in the backward direction as well. See, for example, Bidel et al. (2002) and references therein.. This cooperative effect of the atomic ensemble in the forward direction has already been explored by several authors, for example in superradiance laser Meiser et al. (2009); Bohnet et al. (2012), superradiance of a single photon emission Scully and Svidzinsky (2009), and in the underlying mechanical effects on the atomic cloud Bienaimé et al. (2010). Importantly, the attenuation of the transmitted field can be interpreted as the result of a destructive interference between the incident field and the field scattered in the forward direction. Denoting the forward scattered electric field by , one has at any time
| (2) |
For the useful case of a monochromatic field at frequency in the stationary regime, such an equality can be written for the complex field amplitudes. A geometrical representation of Eq. (2) is shown in Fig. 1(a), where the angle represents the relative phase between and . In general, the fields have two polarization components, so vectors should be used. Here, we consider a simpler situation where all fields have the same polarization.
In the stationary regime, energy conservation imposes . In other words, , and therefore, . However, since the forward scattered field is built upon the incident field, one might believe that its amplitude is bounded as such, . As a key result of this Letter, we show that the latter intuitive picture is incorrect. Indeed, we predict a forward scattered intensity arbitrarily close to and experimentally observe . The experimental value is mainly limited by the maximum optical thickness that can be obtained with our experimental setup. Hence, apart from the energy conservation argument, we find no other basic principles or theorems, such as causality or Kramers-Kronig relations, that limit the amplitude of the forward scattered field.
The system under investigation consists of a laser-cooled 88Sr atomic gas. The details of the cold atoms production line are given in Ref. Yang et al. (unpublished). The last cooling stage is performed on the intercombination line at transition wavelength , with a bare linewidth of . The number of atoms is . The temperature of the cold gas is , corresponding to an rms velocity of . Here, is the wave vector of the transition. The cloud has an oblate ellipsoidal shape with an axial radius and an equatorial radius with a peak density around . Using shadow imaging technique, we measure along an equatorial direction of the cloud, an optical thickness at resonance of . We note that , where is the light scattering mean free path. Since , the system is deeply in the dilute regime. Hence, all collective behaviors in dense media such as Dicke superradiance in free space Dicke (1954); Rehler and Eberly (1971); Bonifacio and Lugiato (1975); Gross and Haroche (1982), recurrent scattering Sokolov et al. (2009); Kwong et al. (unpublished), Lorentz-Lorenz and collective Lamb shift Pellegrino et al. (2014); Keaveney et al. (2012); Javanainen et al. (2014), can be disregarded. Atomic collisions are also negligible over the duration of the experiment in our dilute cold gas.
A probe laser beam is then sent across the cold atomic gas along an equatorial axis. The probe (diameter ) is tuned around the resonance of the intercombination line. Its power is , corresponding to , where is the saturation intensity of the transition. The probe is switched on for such that the stationary regime is reached without introducing significant radiation pressure on the atoms. The same probe sequence is repeated later without the atoms to measure . The transmitted photons along the propagation direction are collected on a photodetector, leading to a transverse integration of the intensity. During probing, we apply a bias magnetic field of along the beam polarization to address a two-level system corresponding to the transition.
First, we look at the stationary regime. We plot, in Fig. 1(b), as a function of the probe frequency detuning . To compare with analytical predictions, we model the ellipsoid geometry of the cloud by a slab geometry. In the frequency domain, the coherent transmitted electric field through the slab is given by
| (3) |
We define, , , , and , respectively, as the complex refractive index, the laser optical frequency, the speed of light in vacuum, and the thickness of the slab along the laser beam. For a dilute medium, we have Hetch and Zajac (1974). The two-level atomic polarizability is given by
| (4) |
where the integration is carried out over the thermal Gaussian distribution of the atomic velocity along the beam propagation direction (Doppler broadening). By inserting, in Eq. (3), the polarizability, the measured values of the atomic density, and the temperature, we compute the transmitted intensity and show the results in Fig. 1(b). The effective slab thickness of the cloud is chosen to match the measured optical thickness. The theoretical prediction agrees very well with the experimental data. However, close to resonance, the measured transmission is slightly higher than predicted. This mismatch is due to the finite transverse size of the cloud, which allows few photons in the wings of the laser beam to be directly transmitted.
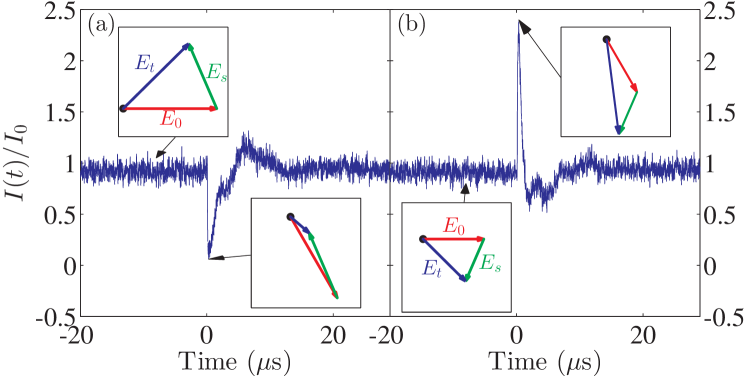
We now take advantage of the finite response time of the light-atom system to measure the forward scattered intensity directly. For this purpose, we abruptly switch off the probe beam. The switching time is (i.e. times faster than the excited state lifetime ). According to Eq. (2), if , we have . Hence, immediately after switching off the probe, the detector measures the forward scattered intensity of the stationary regime [i.e., ]. In the absence of a driving field, free induction decay occurs. If the probe is at resonance and the optical thickness is large, the stationary transmitted intensity is very small, i.e., so that Immediately after the probe is switched off, the atomic field does not change, so that and . The free induction decay, thus, leads to the emission of a coherent flash of light with a peak intensity equal to (see for example Fig. 1(b) in Ref. Chalony et al. (2011)). For a detuned probe field, one illustrative example of the temporal evolution of is given in Fig. 1(c). In this case, we observe a flash of light with the peak intensity clearly above . We define it as a coherent superflash. In the inset of Fig. 1(c), we compare the experimental signal and the theoretical prediction. This theoretical prediction is obtained by numerically calculating the inverse Fourier transform of Eq. (3) for an incident field that is a step function in the time domain. A good agreement is obtained, except at , where the finite response time of our detection scheme slightly smoothes the predicted discontinuity. The value of is obtained by extrapolating the (super)flash down to .
We plot in Fig. 1(d) the normalized forward scattered intensity as a function of the laser detuning. At resonance, we find and as in Ref. Chalony et al. (2011), meaning that the interference between the incident field and the forward scattered field is almost perfectly destructive (i.e. ). Far from resonance, so that In between these two extreme cases, passes through a maximum of at . At the same detuning, we get . Finding (i.e. a coherent superflash) is surprising for two reasons. First, as mentioned earlier, the forward scattered field is built upon the incident field. Second, it reaches its maximum value when the field is mostly transmitted (i.e. where we could expect that the incident field weakly interacts with the medium).
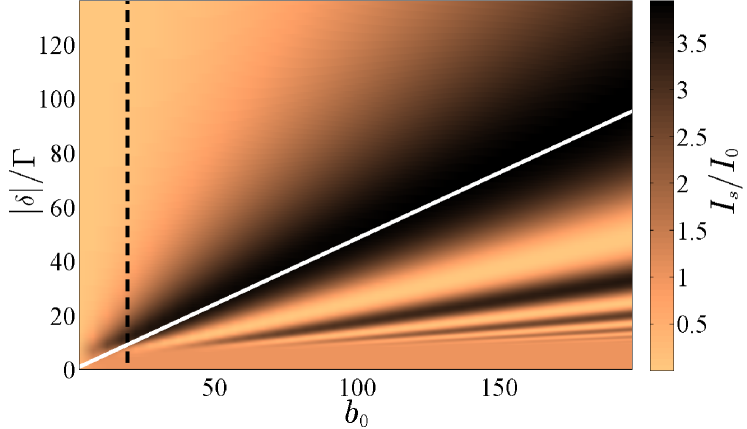
In the stationary regime, energy conservation imposes the transmitted intensity to be lower than the incident one, which, from Eq. (2), implies Thus, must lie inside a circle (represented by the white and light grey areas in Fig. 3) with center and radius The maximum is, thus, reached when implying that the maximum superflash is We tend to this limit as we increase the optical thickness, as shown in Fig. 2. For , the maximum superflash intensity at a given large occurs for . This corresponds to where Chalony et al. (2011). At this detuning, the superflash intensity is . At , the temperature of the experiment, . The detuning at maximum superflash intensity is then given by , a linear dependence on which can be seen in Fig. 2.
From our experimental measurements of (stationary transmitted probe intensity) and (immediately after switching off the probe), we extract the phase of the forward scattered field
| (5) |
However, an ambiguity exists in the phase calculated using Eq. (5), since we cannot distinguish between and . To disambiguate, the easiest way is to choose the sign giving the best agreement with Eqs. (3) and (4). The result of this procedure is represented by the dots in Fig. 3.
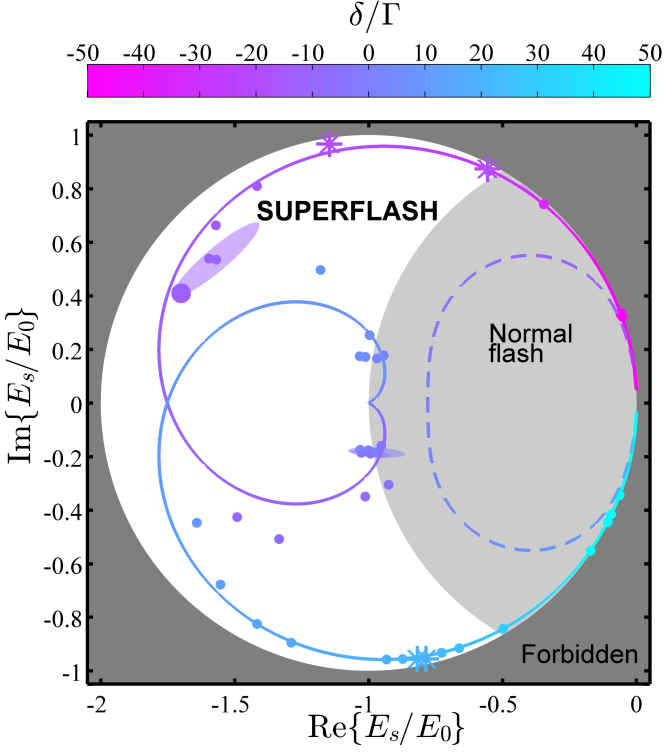
We have also added theoretical predictions in Fig. 3. We note that the phase angle is within the range (see the allowed circle in Fig. 3), which means that the forward scattered field always destructively interferes with , a necessary condition for a passive scattering medium. We also note that for large detunings . However, is close to zero, so stays close to the origin. As the detuning decreases, traces a curve as depicted in Fig. 3 until we reach a situation where . If this happens when the detuning is still relatively large, as it is in the experiment, a large superflash intensity is observed.
At very large optical thickness, goes back and forth in the range, leading to a potential observation of several superflashes by scanning the detuning at a given see Fig. 2. At low optical thickness, the excursion of is limited and no superflash occurs as is illustrated by the dashed curve in Fig. 3.
An additional measurement makes it possible to disambiguate the sign of phase . We insert, in the optical path of the probe, an electro-optic modulator (EOM) to adjust the phase delay of . By abruptly switching off the EOM bias voltage, we create an abrupt negative jump in the phase of . Depending on whether interferes constructively or destructively with after the phase jump, we observed a positive (super)flash [see Fig. 4(b)] or a negative flash [see Fig. 4(a)], respectively. We further vary the phase jumps in the range where the amplitude of the (super)flash necessarily passes through an extremum giving, without ambiguity, . We show as stars in Fig. 3 several values such a reconstructed field.
In conclusion, we have studied fast transient phenomena in the transmission of a probe beam through an optically thick cold atomic sample. When a detuned probe is abruptly switched off, a short coherent superflash is emitted with a peak intensity up to 4 times the incident intensity. By combining transient and stationary intensity measurements, we show that the coherent superflash comes from a phase rotation of the forward scattered field induced by the large optical thickness of the medium. The sensitivity of the transmitted intensity to the changes in the phase of the incident field suggests that an optically dense medium may be useful as a phase discriminator device and as a generator of pulse trains with repetition rates higher than Kwong et al. (unpublishedb).
The authors are grateful to R. Carminati, C. Salomon and J. Ye for fruitful discussions and to a referee for his-her very valuable comments. C. C. K. thanks the CQT and ESPCI institutions for funding his trip to Paris. This work was supported by the CQT/MoE funding Grant No. R-710-002-016-271. R. P. acknowledges the support of LABEX WIFI (Laboratory of Excellence Grant No. ANR-10-LABX-24) within the French Program “Investments for the Future” under Reference No. ANR-10-IDEX-0001-02 PSL∗.
References
- Slichter (1990) C. P. Slichter, Principles of Magnetic Resonance (Springer, 1990), vol. 1.
- Allen and Eberly (1974) L. Allen and J. H. Eberly, Optical Resonance and Two-Level Atoms (Dover Publication, New York, 1974).
- Bloembergen et al. (1948) N. Bloembergen, E. M. Purcell, and R. V. Pound, Phys. Rev. 73, 679 (1948).
- Hahn (1950) E. L. Hahn, Phys. Rev. 77, 297 (1950).
- Toyoda et al. (1997) K. Toyoda, Y. Takahashi, K. Ishikawa, and T. Yabuzaki, Phys. Rev. A 56, 1564 (1997).
- Pietiläinen et al. (1998) A. Pietiläinen, M. Kujala, and E. Ikonen, J. Opt. Soc. Am. B 15, 2823 (1998).
- Zamith et al. (2001) S. Zamith, J. Degert, S. Stock, B. de Beauvoir, V. Blanchet, M. A. Bouchene, and B. Girard, Phys. Rev. Lett. 87, 033001 (2001).
- Chalony et al. (2011) M. Chalony, R. Pierrat, D. Delande, and D. Wilkowski, Phys. Rev. A 84, 011401(R) (2011).
- Brewer and Shoemaker (1972) R. G. Brewer and R. L. Shoemaker, Phys. Rev. A 6, 2001 (1972).
- Foster et al. (1974) K. Foster, S. Stenholm, and R. G. Brewer, Phys. Rev. A 10, 2318 (1974).
- Brewer and Genack (1976) R. G. Brewer and A. Z. Genack, Phys. Rev. Lett. 36, 959 (1976).
- Judson and Rabitz (1992) R. S. Judson and H. Rabitz, Phys. Rev. Lett. 68, 1500 (1992).
- Helistö et al. (1982) P. Helistö, E. Ikonen, T. Katila, and K. Riski, Phys. Rev. Lett. 49, 1209 (1982).
- Ikonen et al. (1985) E. Ikonen, P. Helistö, T. Katila, and K. Riski, Phys. Rev. A 32, 2298 (1985).
- Shim et al. (2002) U. Shim, S. Cahn, A. Kumarakrishnan, T. Sleator, and J.-T. Kim, Jpn J. Appl. Phys. 41, 3688 (2002).
- Ducloy (1977) M. Ducloy, C. R. Acad. Sci. Paris B 285, 13 (1977).
- Wei et al. (2009) D. Wei, J. F. Chen, M. M. T. Loy, G. K. L. Wong, and S. Du, Phys. Rev. Lett. 103, 093602 (2009).
- Helistö et al. (1991) P. Helistö, I. Tittonen, M. Lippmaa, and T. Katila, Phys. Rev. Lett. 66, 2037 (1991).
- Fioretti et al. (1998) A. Fioretti, A. F. Molisch, J. H. Müller, P. Verkerk, and M. Allegrini, Opt. Commun. 149, 415 (1998).
- Labeyrie et al. (2003) G. Labeyrie, E. Vaujour, C. A. Müller, D. Delande, C. Miniatura, D. Wilkowski, and R. Kaiser, Phys. Rev. Lett. 91, 223904 (2003).
- Meiser et al. (2009) D. Meiser, J. Ye, D. R. Carlson, and M. J. Holland, Phys. Rev. Lett. 102, 163601 (2009).
- Bohnet et al. (2012) J. G. Bohnet, Z. Chen, J. M. Wiener, D. Meiser, M. J. Holland, and J. K. Thompson, Nature (London) 484, 78 (2012).
- Scully and Svidzinsky (2009) M. O. Scully and A. A. Svidzinsky, Science 325, 1510 (2009).
- Bienaimé et al. (2010) T. Bienaimé, S. Bux, E. Lucioni, P. W. Courteille, N. Piovella, and R. Kaiser, Phys. Rev. Lett. 104, 183602 (2010).
- Yang et al. (unpublished) T. Yang, K. Pandey, M. S. Pramod, F. Leroux, C. C. Kwong, E. Hajiyev, Z. Y. Chia, B. Fang, and D. Wilkowski (unpublished).
- Dicke (1954) R. H. Dicke, Phys. Rev. 93, 99 (1954).
- Rehler and Eberly (1971) N. E. Rehler and J. H. Eberly, Phys. Rev. A 3, 1735 (1971).
- Bonifacio and Lugiato (1975) R. Bonifacio and L. Lugiato, Phys. Rev. A 11, 1507 (1975).
- Gross and Haroche (1982) M. Gross and S. Haroche, Phys. Rep. 93, 301 (1982).
- Sokolov et al. (2009) I. M. Sokolov, M. D. Kupriyanova, D. V. Kupriyanov, and M. D. Havey, Phys. Rev. A 79, 053405 (2009).
- Kwong et al. (unpublished) C. C. Kwong, D. Wilkowski, D. Delande, and R. Pierrat (unpublished).
- Pellegrino et al. (2014) J. Pellegrino, R. Bourgain, S. Jennewein, Y. R. P. Sortais, and A. Browaeys, Phys. Rev. Lett. 113, 133602 (2014).
- Keaveney et al. (2012) J. Keaveney, A. Sargsyan, U. Krohn, I. G. Hughes, D. Sarkisyan, and C. S. Adams, Phys. Rev. Lett. 108, 173601 (2012).
- Javanainen et al. (2014) J. Javanainen, J. Ruostekoski, Y. Li, and S.-M. Yoo, Phys. Rev. Lett. 112, 113603 (2014).
- Hetch and Zajac (1974) E. Hetch and A. Zajac, Optics (Addison-Wesley, Reading, MA, 1974).
- Kwong et al. (unpublishedb) C. C. Kwong, T. Yang, D. Delande, R. Pierrat, and D. Wilkowski (unpublishedb).
- Bidel et al. (2002) Y. Bidel, B. Klappauf, J. C. Bernard, D. Delande, G. Labeyrie, C. Miniatura, D. Wilkowski, and R. Kaiser, Phys. Rev. Lett. 88, 203902 (2002).