Supporting Material for: Superionicity and Polymorphism in Calcium Fluoride at High Pressure
Abstract
In this supplemental document we explain the details of our ab initio density functional theory calculations and crystal structure searches performed in CaF2 under pressure. Also we report the computed -dependence of the formation energy of Frenkel pair defects in the cubic fluorite phase, and the vibrational phonon spectra and structural data of the predicted high- monoclinic phase. Calculated enthalpy energies in compressed SrF2 and BaF2 are also presented.
I Zero-temperature DFT calculations
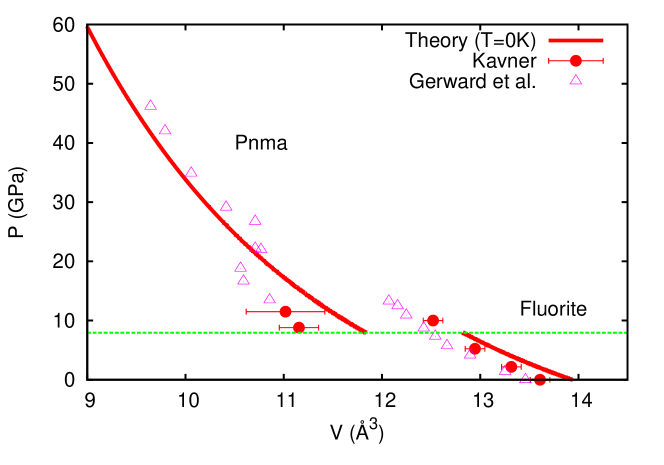

Total energy calculations were carried out in CaF2 under pressure in the cubic fluorite and orthorhombic cotunnite phases, employing the methods and parameters described in the main text of the present Letter. As it may be appreciated in the supplemental Fig. 1, the agreement between our calculated equation of state and experimental data from Refs. [kavner08, ; gerward92, ] is remarkably good.
In order to calculate the vibrational phonon frequencies of CaF2, we employed the direct approach [kresse95, ; alfe01, ]. In this method, the force-constant matrix is directly calculated in real-space by considering the proportionality between the atomic displacements and forces when the former are sufficiently small. Large supercells must then be constructed in order to guarantee that the elements of the force-constant matrix have all fallen off to negligible values at their boundaries, a condition that follows from the use of periodic boundary conditions. In the present work, we employed simulation boxes larger than atoms and dense -point grids in the calculation of the atomic forces with VASP. Computation of the nonlocal parts of the pseudopotential contributions was performed in reciprocal, rather than real, space. Once the force-constant matrix is thus obtained, we can Fourier transform it to obtain the phonon spectrum at any point. This step was done with the PHON code due to Alfè [alfe09a, ]. In using this code, we exploited the translational invariance of the system to impose the three acoustic branches to be exactly zero at the point, and used central differences in the atomic forces (i.e., we considered positive and negative atomic displacements).
We must note, however, that convergence of the force-constant matrix elements with respect to the size of the supercell in ionic materials may be slow due to the appearance of charge dipoles and macroscopic electric fields in the limit of zero wave vector. Fortunately, long-range dipole-dipole interactions can be modeled at the harmonic level from knowledge of the atomic Born effective charge tensors and the dielectric tensor of the material [gonze89, ; baroni01, ]. Taking advantage of this result, Wang et al. proposed a mixed-space approach in which accurate force constants are calculated with the direct approach in real space and long-range dipole-dipole interactions with linear response theory in reciprocal space [wang10, ; cazorla13, ]. In the present work, we used Wang et al. mixed-space approach to calculate the vibrational phonon frequencies of CaF2 at different volumes.
In the supplemental Fig. 2, the Raman frequencies that we have measured ( K) and calculated ( K) in -CaF2 under compression are represented. The agreement between our measurements and calculations is good (i.e., within the % of difference), especially in what concerns the variation of the Raman frequency with pressure which is found to be almost constant and equal to cm-1/GPa in the experiments and cm-1/GPa in the simulations. Both our experimental and theoretical results are in good agreement with previous experiments [speziale02, ].
II One-phase and Two-phase coexistence ab initio molecular dynamics simulations
Our ab initio molecular dynamics (AIMD) calculations were of two types: one-phase (i.e., solid and superionic phases) and two-phase coexistence (i.e., liquid and superionic phases coexisting in thermodynamic equilibrium) simulations. One-phase simulations were performed in the canonical ensemble while two-phase coexistence simulations in the microcanonical ensemble. In the simulations the temperature was kept fluctuating around a set-point value by using Nose-Hoover thermostats. Large simulation boxes containing and atoms were used in our one-phase and two-phase coexistence simulations, respectively. Periodic boundary conditions were applied along the three Cartesian directions in all the calculations. Newton’s equations of motion were integrated using the customary Verlet’s algorithm and a time-step length of ps. -point sampling for integration within the first Brillouin zone was employed in all our AIMD simulations.
Comprehensive one-phase molecular dynamics simulations were carried out in order to compute the and phase boundaries in CaF2 as a function of pressure. Calculations comprised large simulation boxes and long simulation times of up to ps. We systematically carried out simulations at temperature intervals of K, from up to K, at each considered volume.
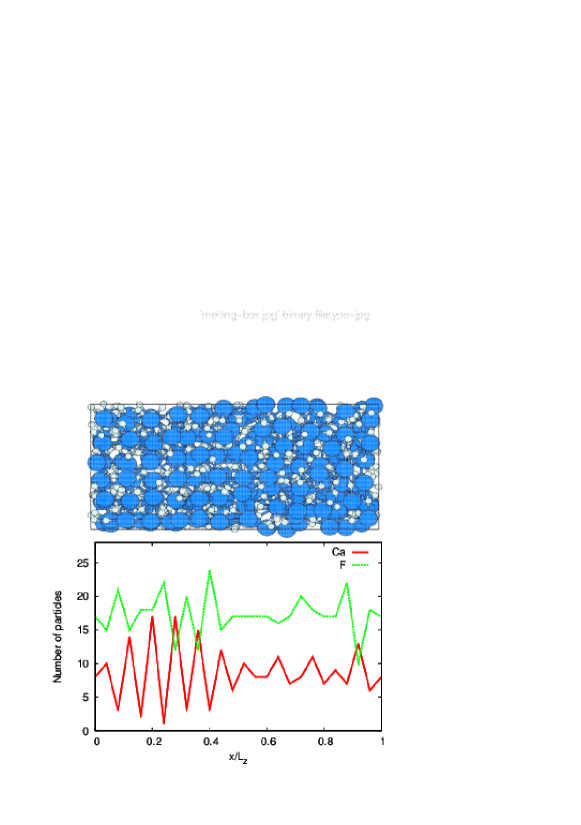
Following previous works [cazorla07a, ; cazorla07b, ; cazorla09, ; cazorla11, ; cazorla12, ; alfe09, ], we performed comprehensive two-phase coexistence MD simulations in order to determine the melting curve of CaF2 at low and high pressures. Starting with a supercell containing the perfect crystal structure (i.e. either cubic fluorite or orthorhombic ), we thermalize it at a temperature slightly below the expected melting temperature for about ps. The system remains in a superionic state. The simulation is then halted and the positions of the atoms in one half of the supercell are held fixed while the other half is heated up to a very high temperature (typically five times the expected melting temperature) for about ps, so that it melts completely. With the fixed atoms still fixed, the molten part is rethermalized to the expected melting temperature (for about ps). Finally, the fixed atoms are released, thermal velocities are assigned, and the whole system is allowed to evolve freely at constant for a long time (normally more than ps), so that the solid and liquid come into equilibrium. The system is monitored by calculating the average number of particles in slices of the cell taken parallel to the boundary between the solid and liquid. With this protocol, there is a certain amount of trial and error to find the overall volume which yields the coexisting solid and liquid system. An example of a successful coexistence run is shown in the supplemental Fig. 3.
III Formation energy of Frenkel pair defects under pressure
We calculated the formation energy of Frenkel pair defects (FPD) in cubic CaF2 at different pressures. We used a simulation box containing atoms and a Monkhorst-Pack -point grid for integrations within the first Brillouin zone. We found that the series of calculated energies (see the supplemental Fig. 4) could be very well fitted to the power law function
| (1) |
where the optimal values of the parameters are eV, eV and . It is noted that the formation energy of FPD increases monotonically and appreciably with compression.

IV Crystal structure searches
Our crystal structure searches performed in compressed CaF2 relied on two different strategies, namely (i) comprehensive atomic relaxations of configurations generated in constrained low- AIMD runs, and (ii) enthalpy calculation of phases that have been recently observed and predicted in isomorphic AB2 compounds under pressure.
In our restricted low- AIMD runs, we used a small simulation cell containing atoms in the orthorhombic phase and set the temperature to ambient conditions. Consistently to the observed transition, we constrained the Ca2+ cations not to move during the dynamical simulations. The total duration of these AIMD runs was ps. Once these simulations were finished, we randomly selected configurations out of and performed atomic and crystal cell relaxations in them. During the geometry optimizations all cations and anions were allowed to move. Subsequently, we identified the crystal symmetry of the final equilibrium structures with the ISOTROPY package [isotropy, ]. Following this strategy, we obtained the five candidate high- crystal phases that we mention in the main text of the present Letter (i.e., orthorhombic and , and monoclinic , and ).
We also computed the energy of the post-cotunnite and phases in CaF2 under pressure. These phases have been recently observed and predicted in bulk AuIn2 and AuGa2 respectively [godwal10, ; godwal13, ], which are isomorphic materials to CaF2. By following this strategy, however, we did not find any promising high- candidate crystal phase since their corresponding enthalpies were too large in comparison to those of the crystal structures obtained with strategy (i).
V Structural data, phonons and enthalpy of the predicted high- monoclinic phase


| Å | Å | Å | ||
| Å | Å | Å | ||
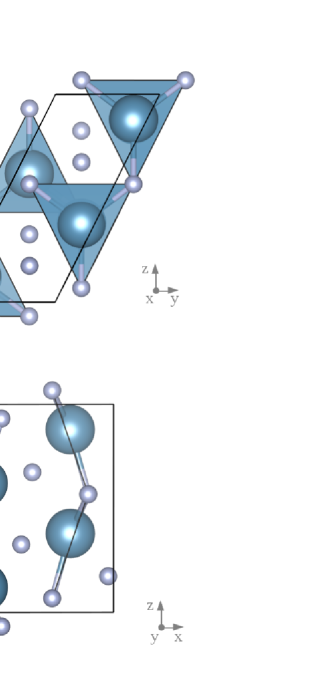
A sketch of the new high- monoclinic phase predicted in CaF2 at high- is shown in the supplemental Fig. 5. This structure has a similar cation coordiantion polyhedra to that of the orthorhombic phase. On it each calcium is coordinated to fluorine atoms that form an elongated tricapped trigonal prism. Structural data of this monoclinic phase obtained at different pressure conditions are enclosed in Table I.
We computed the phonon spectrum of this high- monoclinic phase at different pressures employing the methodology explained in this supplemental document (see Sec. I), and found that it was vibrationally and mechanically stable (see the supplemental Fig. 6).
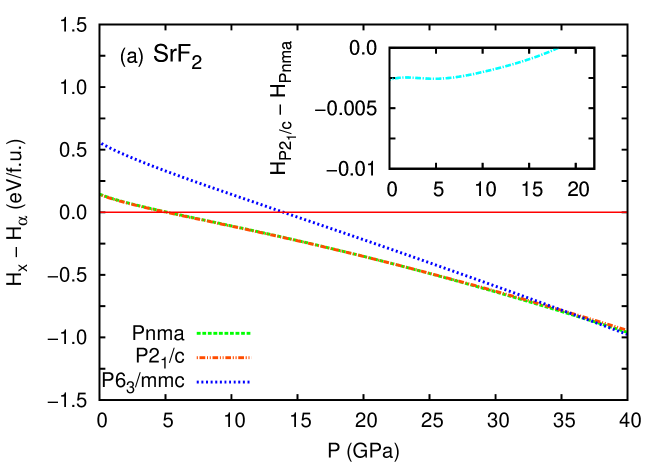
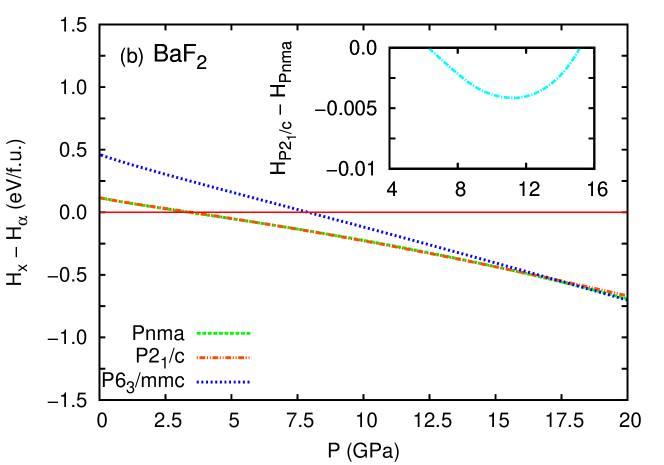
The results of our enthalpy calculations in SrF2 and BaF2 compounds are enclosed in the supplemental Fig. 7. In particular, we computed the enthalpy energy of the cubic fluorite, orthorhombic , hexagonal , and monoclinic phases in the corresponding pressure regimes of interest. As we found in CaF2, the monoclinic phase turns out to be energetically very competitive with respect to the orthorhombic phase, and actually under some conditions the enthalpy difference between the two phases is zero within our numerical accuracy (i.e., meV/f.u.).
References
- (1) A. Kavner, Phys. Rev. B 77, 224102 (2008).
- (2) L. Gerward, J. S. Olsen, S. Steenstrup, M. Malinowski, S. Asbrink, and A. Waskowska, J. Appl. Crystallogr. 25, 578 (1992).
- (3) G. Kresse, J. Fürthmuller, and J. Hafner, Europhys. Letter. 32, 729 (1995).
- (4) D. Alfè, G. D. Price, and M. J. Gillan, Phys. Rev. B 64, 045123 (2001).
- (5) D. Alfè, Comput. Phys. Commun. 180, 2622 (2009).
- (6) X. Gonze and J.-P. Vigneron, Phys. Rev. B 39, 13120 (1989).
- (7) S. Baroni, S. de Gironcoroli, A. del Corso, and P. Giannozzi, Rev. Mod. Phys. 73, 515 (2001).
- (8) Y. Wang, J. J. Wang, W. Y. Wang, Z. G. Mei, S. L. Shang, L. Q. Chen, and Z. K. Liu, J. Phys.: Condens. Matter 22, 202201 (2010).
- (9) C. Cazorla and J. Íñiguez, Phys. Rev. B 88, 214430 (2013).
- (10) S. Speziale and T.S. Duffy, Phys. Chem. Minerals 29, 465 (2002).
- (11) C. Cazorla, M. J. Gillan, S. Taioli, and D. Alfè, J. Chem. Phys. 126, 194502 (2007).
- (12) S. Taioli, C. Cazorla, M. J. Gillan, and D. Alfè, Phys. Rev. B 75, 214103 (2007).
- (13) C. Cazorla, D. Alfè, and M. J. Gillan, J. Chem. Phys. 130, 174707 (2009).
- (14) D. Alfè, C. Cazorla and M. J. Gillan, J. Chem. Phys. 135, 024102 (2011).
- (15) C. Cazorla, D. Alfè, and M. J. Gillan, Phys. Rev. B 85, 064113 (2012).
- (16) D. Alfè, Phys. Rev. B 79, 060101(R) (2009).
- (17) H. T. Stokes, D. M. Hatch, and B. J. Campbell, (2007). ISOTROPY, stokes.byu.edu/isotropy.html.
- (18) B. K. Godwal, S. Speziale, M. Voltolini, R. Wenk, and R. Jeanloz, Phys. Rev. B 82, 064112 (2010).
- (19) B. K. Godwal, S. Stackhouse, J. Yan, S. Speziale, B. Militzer, and R. Jeanloz, Phys. Rev. B 87, 100101(R) (2013).