ALMA HINTS AT THE PRESENCE OF TWO COMPANIONS IN THE DISK AROUND HD 100546
Abstract
HD 100546 is a well-studied Herbig Be star-disk system that likely hosts a close-in companion with compelling observational evidence for an embedded protoplanet at 68 AU. We present ALMA observations of the HD 100546 disk which resolve the gas and dust structure at (sub)mm wavelengths. The CO emission (at 345.795 GHz) originates from an extensive molecular disk (39020 AU in radius) whereas the continuum emission is more compact (23020 AU in radius) suggesting radial drift of the mm-sized grains. The CO emission is similar in extent to scattered light images indicating well-mixed gas and m-sized grains in the disk atmosphere. Assuming azimuthal symmetry, a single-component power-law model cannot reproduce the continuum visibilities. The visibilities and images are better reproduced by a double-component model: a compact ring with a width of 21 AU centered at 26 AU and an outer ring with a width of 753 AU centered at 1903 AU. The influence of a companion and protoplanet on the dust evolution is investigated. The companion at 10 AU facilitates the accumulation of mm-sized grains within a compact ring, 20–30 AU, by 10 Myr. The injection of a protoplanet at 1 Myr hastens the ring formation ( 1.2 Myr) and also triggers the development of an outer ring ( 100–200 AU). These observations provide additional evidence for the presence of a close-in companion and hint at dynamical clearing by a protoplanet in the outer disk.
1 INTRODUCTION
Transition disks (TDs) are important for studying the advanced stages of protoplanetary disk evolution (see, e.g., Espaillat et al., 2014). TDs were originally identified as sources for which the spectral energy distribution (SED) demonstrated a lack of near-infrared excess despite the presence of strong mid- to far-infrared excess. This was attributed to a gap in the inner disk devoid of small grains (e.g., Strom et al., 1989). Theory suggests gaps in TDs are cleared by close-in companions, with other disk-dispersal mechanisms, e.g., grain growth or photoevaporation, happening in parallel (see, e.g., Armitage, 2011; Williams & Cieza, 2011; Espaillat et al., 2014). SEDs provide indirect evidence of gaps in TDs; however, long-baseline interferometry at (sub)mm wavelengths has revealed their ring-like morphology (e.g., Andrews et al., 2011). The Atacama Large Millimeter/Submillimeter Array (ALMA) has revealed extreme asymmetries in the dust emission in several systems, indicative of dust traps triggered by the interaction between the disk and a close-in companion (Casassus et al., 2012; van der Marel et al., 2013) or gravitational instabilities (Fukagawa et al., 2013). ALMA observations have also demonstrated that gaps can contain a significant reservoir of molecular gas (Bruderer et al., 2014).
We present ALMA Cycle 0 observations of the transition disk encompassing HD 100546 which reveal the spatially-resolved gas and dust structure at (sub)mm wavelengths. Pineda et al. (2014) have already published these data; however, we reach different conclusions based on more thorough data processing.
2 HD 100546
HD 100546 is a 2.4 B9V Herbig Be star located at 1036 pc which has a complex circumstellar environment (e.g., van den Ancker et al., 1998; Grady et al., 2001). Coronographic imaging show that the small grains extend to large radii ( 500 AU) and reveal evidence of spiral arms and disk brightness asymmetries (e.g., Pantin et al., 2000; Augereau et al., 2001; Grady et al., 2001; Ardila et al., 2007; Boccaletti et al., 2013). SED models of the dust emission suggest a gap within 10–13 AU and the presence of an inner tenuous dust disk, 0.7 AU (Bouwman et al., 2003; Benisty et al., 2010; Tatulli et al., 2011; Panić et al., 2014). Observations of [OI] (6300 Å) line emission and OH and CO rovibrational transitions confirm the presence of residual gas close to the star with the observed dynamical perturbation of the gas likely induced by a massive close-in companion (Acke & van den Ancker, 2006; Brittain et al., 2009; van der Plas et al., 2009; Goto et al., 2012; Liskowsky et a., 2012; Brittain et al., 2013; Bertelsen et al., 2014).
Emission at 1.3 and 3.4 mm was detected using the Swedish-ESO 15 m Submillimeter Telescope (SEST) and the Australia Telescope Compact Array (ATCA) yielding a total flux density of 46520 and 363 mJy, respectively (Henning et al., 1994; Wilner et al., 2003). A plethora of molecular lines have been observed at far-infrared to (sub)mm wavelengths including emission from 12CO, 13CO, OH, and \ceCH+ (see, e.g., Panić et al., 2010; Sturm et al., 2010; Thi et al., 2011; Meeus et al., 2012; Fedele et al., 2013a). These data have allowed contraints on the radial behaviour of the gas temperature structure, and indicate thermal decoupling of the gas and dust in the disk atmosphere (Bruderer et al., 2012; Fedele et al., 2013b; Meeus et al., 2013).
The detection of significant emission from a point source at a deprojected radius of 6810 AU (Quanz et al., 2013) is of utmost importance in indicating planet formation around HD 100546. High-contrast angular differential imaging revealed that the source emission coincides with a reduction in surface brightness seen in corresponding polarimetric differential imaging (Quanz et al., 2011). Quanz et al. (2013) conclude that the most likely explanation is a young gas-giant planet (or protoplanet) caught in the act of formation, reasoning that a mature massive planet (coeval with the star) would have had sufficient time to significantly perturb the structure of the disk.
3 OBSERVATIONS
HD 100546 was observed during ALMA Cycle 0 operations on 2012 November 18 using 24 antennas with baseline lengths between 21 and 375 m (program 2011.0.00863.S, P. I. C. Walsh). The source was observed in seven spectral windows in Band 7, each with a bandwidth of 469 MHz and a channel width of 0.122 MHz (0.24 and 0.21 km s-1 at 300 and 345 GHz, respectively, applying Hanning smoothing). The central frequencies in each spectral window are 300.506, 301.286, and 303.927 GHz for the first execution, and 344.311, 345.798, 346.998, and 347.331 GHz for the second execution. The total on-source observation time was 13 and 14 mins, respectively. The data were calibrated using the Common Astronomy Software Package (CASA), version 3.4. The quasar, 3C 297, was used as bandpass calibrator with Titan and a quasar, J1147-6753, used for amplitude and phase calibration, respectively. Self-calibration and imaging were performed using CASA version 4.1. During imaging it was noticed that the telescope pointing had not taken into account the proper motions of the source ( = 11h 33m 2544058, = mas yr-1; = ° 11′ 412363, = mas yr-1). The phase center of the observations was subsequently corrected using the CASA task, fixvis. The continuum bandwidth amounted to 1.48 and 1.83 GHz averaged at 302 and 346 GHz. Continuum and line imaging were performed using the CLEAN algorithm with Briggs weighting (robust = 0.5) resulting in synthetic beam sizes of (23°) and (38°) at 302 and 346 GHz. The synthesized beam is elongated perpendicular to the major axis of the disk owing, in part, to the low declination of the source (-70°). The continuum was subtracted from line-containing channels using the CASA task, uvcontsub, in advance of imaging the CO emission. The achieved rms for the continuum was 0.4 and 0.5 mJy beam-1 at 302 and 346 GHz, respectively, with an rms of 19 mJy beam-1 channel-1 attained for the CO-containing channels.
4 RESULTS
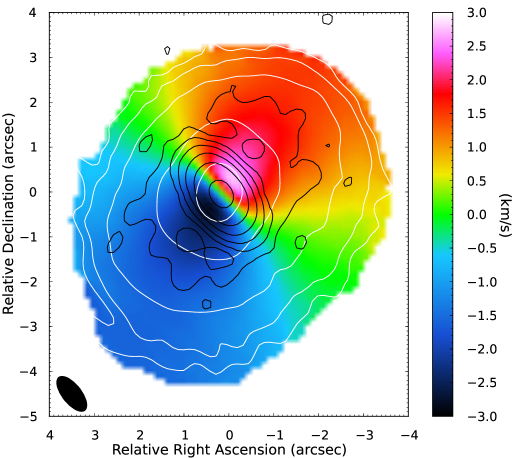
Figure 1 presents the CO =3–2 first moment map overlaid with contours of the integrated intensity and the continuum emission at 870 m. The integrated intensity was determined between and km s-1 relative to the source velocity (constrained by these data to 5.7 km s-1), corresponding to channels containing significant emission ( 3). The CO emission is detected with a peak signal-to-noise of 163 in the channel maps. The continuum emission is detected with a peak signal-to-noise of 1525 and 1320 and a total flux density of 0.980 and 1.240 Jy (summing over all flux 3 ) at 302 and 346 GHz, respectively. The estimated absolute flux calibration uncertainties are 10%. These flux densities are consistent with previous mm observations (Henning et al., 1994; Wilner et al., 2003) and yield a dust spectral index ( ), 0.7–0.8 between 3.4 and 1.0 mm, that falls to between 1.0 mm and 870 m, indicating that the continuum emission is entering the optically thick regime at submillimeter wavelengths. The total dust mass, Mdust , is 0.035 MJup, assuming cm2 g-1 at 300 GHz, and K (see, e.g., Andrews et al., 2011; Bruderer et al., 2012).
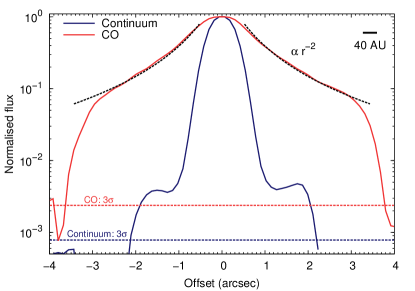
Figure 2 shows the continuum flux density at 346 GHz and CO integrated intensity along the major axis of the disk. The data confirm the radius of the molecular disk, 39020 AU (the error corresponds to half the width of the synthesised beam). The CO emission is similar in extent to the scattered light images from Ardila et al. (2007) suggesting that the molecular gas and micron-sized grains are well mixed in the disk atmosphere. The CO brightness distribution follows a behaviour similar to that seen for the micron-sized grains. The size of the molecular disk is approaching the largest resolvable angular scale; hence, the drop beyond may be caused by spatial filtering. However, the total integrated CO flux in these data is 151 Jy km s-1 which is around 92% of the flux measured with APEX (Panić et al., 2010). Hence, it is unlikely that the disk extends significantly beyond the radius derived here. The mm continuum emission extends to only 23020 AU and has two components: strong emission from the inner disk () and a weaker outer component (1″–22) with a peak flux density 4–5% of the central flux. The self-calibration procedure (using a mask containing only the strong continuum component) significantly increased the dynamic range of the observations improving the peak signal-to-noise at 346 GHz from 150 to 1320, allowing the weak extended emission to be revealed.
All subsequent analysis is conducted in the visibility domain. This allows a search for evidence of gaps or cavities which are not visible in the images. As a first step, the CASA task uvmodelfit was used to fit the continuum visibilities assuming the emission arises from a elliptical disk. This resulted in an inclination of 443°and a position angle (measured East from North) of 1464°, respectively, in excellent agreement with previous observations (see, e.g., Pantin et al., 2000; Augereau et al., 2001; Grady et al., 2001; Ardila et al., 2007; Panić et al., 2010).
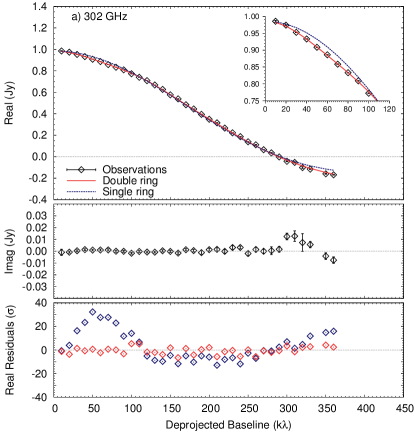
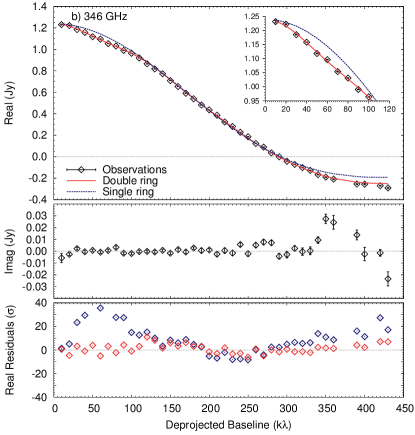
Without any further knowledge on the structure we assume a circular-symmetric surface-brightness distribution. Visibilities of such distributions depend only on the deprojected baseline length, , where and assuming the -axis is aligned with right ascension (see, e.g., Berger & Segransan, 2007). Here, are the observed visibility coordinates, is the source inclination, and is the disk position angle. Figure 3 presents the binned visibilities (in 10 k bins) as a function of . The error bars correspond to the standard error in each bin. The imaginary components show very small scatter around zero 250–300 k, confirming the assumption of a symmetric brightness distribution a posteriori (a point-symmetric brightness distribution has zero imaginary components). For k, the scatter in the imaginary components increases, which may indicate an asymmetry in the continuum emission; however, this may also be caused by coarser the coverage at long baselines. Higher spatial resolution observations are needed to confirm any asymmetry at small spatial scales. The real components of the visibilities decrease as a function of the deprojected baseline indicating the continuum emission is resolved and there is a zero crossing (null) at 290 k. The Fourier transform of an infinitesimally narrow ring is a Bessel function of the first kind, : a null suggests the emission originates from a ring with a finite width (e.g., Berger & Segransan, 2007; Hughes et al., 2007). Pineda et al. (2014) determine a null position at 250 k. This is likely due to an incorrect deprojection related to the convention of the direction of the -axis relative to right ascension (Berger & Segransan, 2007; Hughes et al., 2007).
For a ring, the real component of the visibilities is given by
| (1) |
(Berger & Segransan, 2007). The intensity, , is modelled as a power-law,
| (2) |
The flux scaling factor, , is determined using the total observed flux, , i.e, . and were varied between 0 and 50 AU and 20 and 400 AU, respectively, for = 0, 1, and 2, using a small step size (1 AU) to adequately sample the parameter space.
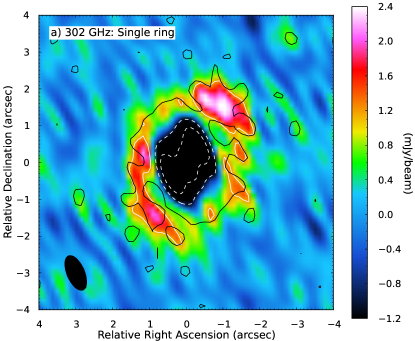
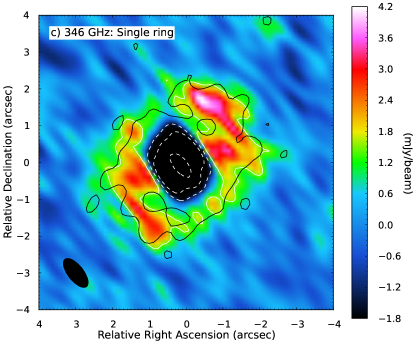
The best-fit model has an inner and outer radius of 16 and 51 AU, and a power-law index of 2 (see Figure 3). This model corresponds to a deep global minimum in the value indicating that the estimated uncertainties are smaller than the step size of the grid (1 AU). The model residuals were imaged using an identical coverage as the observations (see Figure 4). The residuals in both the visibility and image domains are large ( 3) indicating a poor fit. The images reveal significant extended, weak continuum emission (peak residuals = 6 – 8) . Pineda et al. (2014) do not see this extended emission because no self calibration of the data was performed.
To include this more extended component, the model was adapted to include i) a compact ring with a gaussian brightness distribution,
| (3) |
(Pérez et al., 2014) and ii) an extended disk/ring with a flat brightness distribution ( = 0). A low-resolution grid was run (5 AU) to determine the location of the global minimum in the value. A subsequently denser grid was run in which and were varied between 20 and 50 AU and 5 and 20 AU, respectively, and and between 10 and 200 AU and 100 and 400 AU. This grid included models composed of both overlapping and distinct rings. A small step size of 0.5 AU was chosen to allow quantification of the errors via Bayesian inference. For simplicity, the total flux contribution from the compact and extended components were fixed at 0.962 and 0.024 Jy at 302 GHz and 1.190 and 0.048 Jy at 346 GHz, respectively. This was set by the flux in the residual images.
The visibilities are best reproduced by a compact ring with a peak brightness at 26 AU and a FWHM of 21 AU and an outer ring with a width of 753 AU centered at 1903 AU (see Figure 3). The data exclude overlapping rings in favour of two distinct rings of emission. The estimated dust masses for the inner and outer rings are 2.5 10-2 and 1.4 10-3 MJup, assuming disk temperatures of 80 and 40 K at 30 and 190 AU (see, e.g., Bruderer et al., 2012).
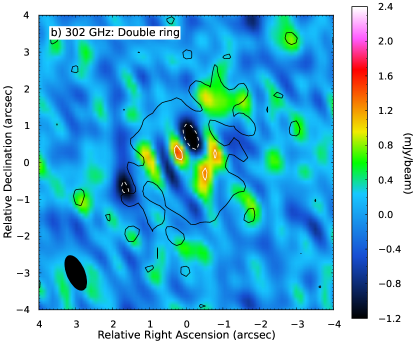
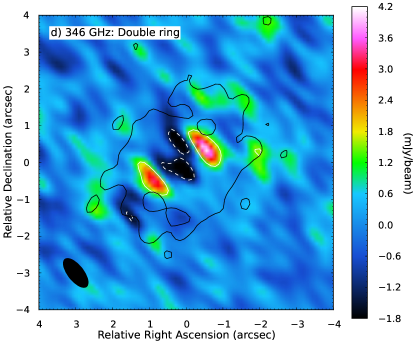
Figure 4 shows the residual images for the “double-ring” model. The peak residuals at 302 and 346 GHz are 1.5 mJy (3.8) and 4.1 mJy (8.2). However, these are restricted to small regions and are likely owing to deviations from circular symmetry also suggested by non-zero imaginary components on long baselines (see Figure 3).
5 DISCUSSION
Previous observations show that the mm-sized grains are not necessarily cospatial with the molecular gas in protoplanetary disks (Isella et al., 2007; Andrews et al., 2012; de Gregorio-Monsalvo et al., 2013). This can be explained by radial drift: dust grains feel a drag force as they move through the sub-Keplerian gas causing a loss of angular momentum and migration inwards towards the star (e.g., Birnstiel et al., 2010). When a massive companion opens a gap in the disk (e.g., Kley & Nelson, 2012), this halts the migration of grains because of the presence of a positive pressure gradient at the outer edge of the gap. Grains can accumulate and grow in this “pressure trap” with the peak and structure of the pressure profile dependent on the disk viscosity and the location and mass of the companion (Pinilla et al., 2012).
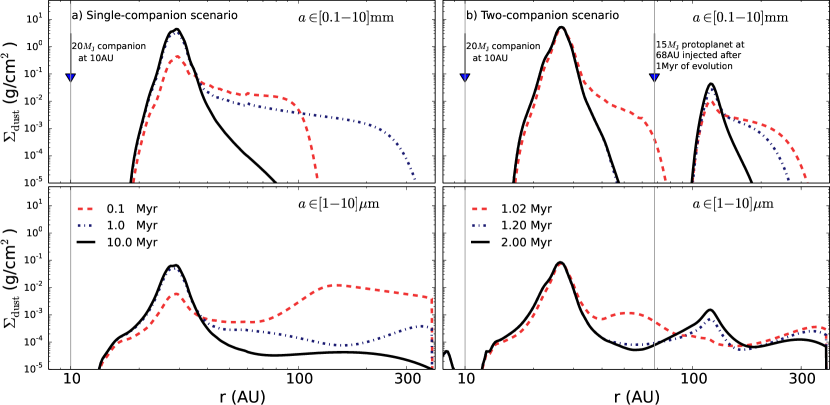
Observations of HD 100546 support the presence of a close-in companion (e.g., Acke & van den Ancker, 2006; Liskowsky et a., 2012; Brittain et al., 2013). Mulders et al. (2013) derived a lower limit of 20 MJup for the companion mass and constrained the disk viscosity to . A potential protoplanet has also been observed at 6810 AU (Quanz et al., 2013). The ALMA observations suggest the mm-sized grains are located in two rings: one between the proposed companions and the other beyond the outer protoplanet. To investigate the influence of companions on the dust evolution in HD 100546, we model the dust growth and migration for two scenarios (Birnstiel et al., 2010; Pinilla et al., 2012): (a) a 20 MJup companion at 10 AU only, and (b) both a 20 MJup companion and a protoplanet (15 MJup) at 68 AU. We assume an initial particle size, 1m, a disk viscosity, , a stellar mass, 2.4 , and a dust mass, (Mulders et al., 2013). The model from Mulders et al. (2013) is extrapolated to larger radii (400 AU) using a power-law and assuming a gas-to-dust mass ratio of 100. The younger protoplanet is injected into the simulations at 1 Myr.
Figure 5 presents the surface density of mm-sized and m-sized grains at different simulation times. For the single-companion scenario, long evolution times are required, 10 Myr, for the grains to grow to mm sizes in the outer regions (100–400 AU) and migrate inwards to accumulate in a radial pressure trap with a peak at 30 AU and a width of 20 AU. For the two-companion scenario, the surface density decreases sharply in the region between the two companions upon introduction of the protoplanet after 1 Myr of dust evolution. The resulting steep pressure gradient causes grains to migrate inwards on shorter timescales, 0.2 Myr. The injection of the protoplanet at 68 AU generates a second ring at 100 AU with a surface density 100–1000 times lower than that for the inner ring. Around 1.0 Myr of additional evolution is required for this ring to narrow to a width 100 AU. These results are qualitatively in agreement with the ALMA observations which also show a contrast of 100 between emission from the inner and outer ring. The m-sized grains extend from 12–13 AU to 400 AU which is consistent with scattered light observations and SED models of the source.
These observations and simulations support the presence of a massive companion orbiting within the inner gap and a protoplanet embedded within the outer disk. Numerical models of dust evolution including two companions recreate the inner ring of mm emission and the extended weaker emission seen in the ALMA data. Particle trapping by the inner companion alone cannot explain the nature of the outer ring.
References
- Acke & van den Ancker (2006) Acke, B. & van den Ancker, M. E. 2006, A&A, 449, 267
- van den Ancker et al. (1998) van den Ancker, M. E., de Winter, D., & Tijn A Dije, H. R. E. 1998, A&A, 330, 145
- Andrews et al. (2011) Andrews, S. M., Wilner, D. J., Espaillat, C., et al. 2011, ApJ, 732, 42
- Andrews et al. (2012) Andrews, S. M., Wilner, D. J., Hughes, A. M., et al. 2012, ApJ, 744, 162
- Ardila et al. (2007) Ardila, D. R., Golimowski, D. A., Krist, J. E., et al. 2007, ApJ, 665, 512
- Armitage (2011) Armitage, P. J. 2011, ARA&A, 49, 195
- Augereau et al. (2001) Augereau, J. C., Lagrange, A. M., Mouillet, D., & Ménard, F. 2001, A&A, 365, 78
- Benisty et al. (2010) Benisty, M., Tatulli, E., Ménard, F., & Swain, M. R. 2010, A&A, 511, A75
- Berger & Segransan (2007) Berger, J. P. & Segransan, D. 2007, New Astronomy Reviews, 51, 576
- Bertelsen et al. (2014) Bertelsen, R .P. Hein, Kamp, I., Goto, M., et al. 2014, A&A, 561, A102
- Birnstiel et al. (2010) Birnstiel, T., Dullemond, C. P., & Brauer, F. 2010, A&A, 513, A79
- Boccaletti et al. (2013) Boccaletti, A., Pantin, E., Lagrange, A.-M., et al. 2013, A&A, 560, A20
- Bouwman et al. (2003) Bouwman, J., de Koter, A., Dominik, C., & Waters, L. B. F. M. 2003, A&A, 401, 577
- Brittain et al. (2009) Brittain, S. D., Najita, J. R., & Carr, J. S. 2009, ApJ, 702, 85
- Brittain et al. (2013) Brittain, S. D., Najita, J. R., Carr, J. S., et al. 2013, ApJ, 767, 159
- Bruderer et al. (2012) Bruderer, S., van Dishoeck, E. F., Doty, S. D., & Herczeg, G. J. 2012, A&A, 541, A91
- Bruderer et al. (2014) Bruderer, S., van der Marel, N., van Dishoeck, E. F., & van Kempen, T. A. 2014, A&A, 562, A26
- Casassus et al. (2012) Casassus, S., van der Plas, G., Perez M., S., et al. 2012, Nature, 493, 191
- Espaillat et al. (2014) Espaillat, C., Muzerolle, J., Najita, J., et al. 2014, in Protostars and Planets VI (University of Arizona Press)
- Fedele et al. (2013a) Fedele, D., Bruderer, S., van Dishoeck, E. F., et al. 2013a, A&A, 559, A77
- Fedele et al. (2013b) Fedele, D., Bruderer, S., van Dishoeck, E. F., et al. 2013b, ApJ, 776, L3
- Fukagawa et al. (2013) Fukagawa, M., Tsukagoshi, T., Momose, M., et al. 2013, PASJ, 65, L14
- Grady et al. (2001) Grady, C. A., Polomski, E. F., Henning, Th., et al. 2001, ApJ, 122, 3396
- de Gregorio-Monsalvo et al. (2013) de Gregorio-Monsalvo, I., Ménard, F., Dent,W., et al. 2013, A&A, 557, A133
- Goto et al. (2012) Goto, M., van der Plas, G., van den Ancker, M., et al. 2012, A&A, 539, A81
- Henning et al. (1994) Henning, Th., Launhardt, R., Steinacker, J., & Thamm, E. 1994, A&A, 291, 546
- Hughes et al. (2007) Hughes, A. M., Wilner, D .J., Calvet, N., et al. 2007, ApJ, 664, 536
- Isella et al. (2007) Isella, A., Testi, L., Natta, A., et al. 2007, A&A, 469, 213
- Kley & Nelson (2012) Kley, W. & Nelson, R. P. 2012, ARA&A, 50, 211
- Kóspál et al. (2013) Kóspál, Á., Moór., A., Juhász, A., et al. 2013, ApJ, 776, 77
- Liskowsky et a. (2012) Liskowsky, J. P., Brittain, S. D., Najita, J .R., et al. 2012, ApJ, 760, 153
- van der Marel et al. (2013) van der Marel, N., van Dishoeck, E. F., Bruderer, S., et al. 2013, Science, 340, 1199
- Meeus et al. (2012) Meeus, G., Montesinos, B., Mendigutía, I., et al. 2012, A&A, 544, A78
- Meeus et al. (2013) Meeus, G., Salyk, C., Bruderer, S., et al. 2013, A&A, 559, A84
- Mulders et al. (2013) Mulders, G. D., Paardekooper, S.-J., Panić, O., et al. 2013, A&A, 557, A68
- Panić et al. (2010) Panić, O., van Dishoeck, E. F., Hogerheijde, M. R., et al. 2010, A&A, 519, A110
- Panić et al. (2014) Panić, O., Ratzka, Th., Mulders, G. D., et al. 2014, A&A, 562, A101
- Pantin et al. (2000) Pantin, E., Waelkens, C., & Lagage, P. O. 2000, A&A, 361, L9
- Pérez et al. (2014) Pérez, L., Isella, A., Carpenter, J. M., & Chandler, C. J. 2014, ApJ, 783, L13
- Pineda et al. (2014) Pineda, J. E., Quanz, S. P., Meru, F., et al. 2014, ApJ, 788, L34
- Pinilla et al. (2012) Pinilla, P., Benisty, M., & Birnstiel, T. 2012, A&A, 545, A81
- van der Plas et al. (2009) van der Plas, G., van den Ancker, M. E., Acke, B., et al. 2009, A&A, 500, 1137
- Quanz et al. (2011) Quanz, S. P., Schmid, H. M., Geissler, K., et al. 2011, ApJ, 738, 23
- Quanz et al. (2013) Quanz, S. P., Amara, A., Meyer, M. R., et al. 2013, ApJ, 766, L1
- Strom et al. (1989) Strom, K. M., Strom, S. E., Edwards, S., Cabrit, S., & Skrutskie, M. F. 1989, AJ, 97, 5
- Sturm et al. (2010) Sturm, B., Bouwman, J., Henning, Th., et al. 2010, A&A, 518, L129
- Tatulli et al. (2011) Tatulli, E., Benisty, M., Ménard, F., et al. 2011, A&A, 531, A1
- Thi et al. (2011) Thi, W.-F., Ménard, F., Meeus, G., et al. 2011, A&A, 530, L2
- Williams & Cieza (2011) Williams, J. P. & Cieza, L. A. 2011, ARA&A, 49, 67
- Wilner et al. (2003) Wilner, D. J., Bourke, T. L., Wright, C. M., et al. 2003, ApJ, 596, 597