GMRT radio continuum study of Wolf Rayet galaxies I:NGC 4214 and NGC 4449
Abstract
We report low frequency observations of Wolf-Rayet galaxies, NGC 4214 and NGC 4449 at 610, 325 and 150 MHz, using the Giant Meterwave Radio Telescope (GMRT). We detect diffuse extended emission from NGC 4214 at and NGC 4449. NGC 4449 is observed to be five times more radio luminous than NGC 4214, indicating vigorous star formation. We estimate synchrotron spectral index after separating the thermal free-free emission and obtain (S) for NGC 4214 and for NGC 4449. About of the total radio emission from NGC 4214 and from NGC 4449 at 610 MHz is thermal in origin. We also study the spectra of two compact star-forming regions in NGC 4214 from 325 MHz to 15 GHz and obtain for NGC 4214-I and for NGC 4214-II. The luminosities of these star-forming regions () appear to be similar to those in circumnuclear rings in normal disk galaxies observed with similar linear resolution. We detect the supernova remnant SNR J1228+441 in NGC 4449 and estimate the spectral index of the emission between 325 and 610 MHz to be in the epoch 2008-2009. The galaxies follow the radio-FIR correlation slopes suggesting that star formation in Wolf - Rayet galaxies, which are low-metallicity systems, are similar to that of normal disk galaxies.
keywords:
galaxies: starburst – galaxies: radio continuum – galaxies : wolf – rayet: individual: NGC 4214, NGC 44491 Introduction
Wolf - Rayet (WR) galaxies show broad emission lines in the optical spectrum due to WR stars. Broadband studies of the spectrum, from radio to optical, of the dwarf galaxy He 2-10 indicated the presence of to WR stars (Allen et al. 1976). The discovery of WR galaxies has been serendipitous until a catalogue of 37 WR galaxies was first compiled by Conti (1991). 139 new members were added by Schaerer et al. (1999). Currently 846 WR galaxies are known, following the SDSS Data Release 6 (DR6; Adelman-McCarthy et al. 2008). WR features in a galaxy provide useful information about the star-formation processes in the system like the age and strength of the starburst. The WR phase is characterised by the ejection of the outer layers of evolved massive stars by stellar winds. These galaxies, along with blue compact dwarf and irregular star-forming galaxies, are collectively referred to as Hii galaxies.
| Galaxy | Right Ascension(1) | Declination(1) | Distance | (5) | (5) | 12+log | (10) | FHα |
|---|---|---|---|---|---|---|---|---|
| (J2000) | (J2000) | (Mpc) | (arc min) | (mag) | ||||
| NGC 4214 | 2.94(2) | (6) | (8) | |||||
| NGC 4449 | 3.9(3) | (7) | (9) |
Some of these Hii galaxies have been studied at radio wavelengths. A sample of 26 blue compact dwarf (BCD) galaxies was studied at high radio frequencies (1 GHz) by Klein et al. (1991). For five galaxies, they found a steep non-thermal spectrum () after separation of the thermal free–free component of the radio emission. They suggested a new relation between the radio spectral index and optical luminosity where they find that the spectral index is steeper for luminous objects. The galaxies were found to follow the radio - FIR correlation observed in normal disk galaxies. A high resolution radio continuum study between 1.4 GHz and 15 GHz along with H observations of nine WR galaxies revealed flat () radio spectra and in many cases inverted spectra between 5 and 15 GHz (Beck et al. 2000). They explain that this is due to WR galaxies harbouring young starbursts and hence the spectrum is dominated by free-free emission from the star-forming regions. However, a spectral study of seven such Hii galaxies at 325 MHz by Deeg et al. (1993) revealed a range of spectral behaviour. They noted that a variety of emission, absorption and energy-loss mechanisms are responsible for the shape of the radio spectra. They do not find steep non-thermal spectra in their sample, unlike Klein et al. (1991). A recent radio continuum study of five BCD galaxies using the Giant Metrewave Radio Telescope (GMRT) by Ramya et al. (2011) also resulted in a range of spectral shapes at low radio frequencies, which they suggest could be indicative of environmental effects. They found that the extended radio emission is generally detected in galaxies residing in a group environment whereas localised emission, which seems to correlate with the H emission, is detected in galaxies evolving in a relatively isolated environment. Thus, the former shows a steeper spectrum as compared to the latter. However, their sample is small and it will be interesting to check for a larger number of Hii galaxies.
It is important to increase the sample of Hii galaxies studied at low radio frequencies and disentangle the different physical mechanisms which play a role in shaping their evolution and spectra. We are studying the low radio frequency properties of a sample of seven WR galaxies using the GMRT. We plan to combine this with the higher radio frequency data and model their spectra, separate the thermal contribution to the spectrum and estimate the non - thermal spectral index. It will be interesting to examine the influence of environment on the morphology of the radio continuum emission and the low radio frequency spectrum and compare the low radio frequency continuum properties of these low-metallicity systems with disk star-forming galaxies.
In this paper, we present low-frequency study of two well-known WR galaxies of our sample, namely, NGC 4214 and NGC 4449. Both galaxies are classified as Magellanic irregular and are located in the Canes Venatici region. Some properties of these galaxies are listed in Table 1. In §2 we describe observations, data calibration and imaging processes. The results are presented in §3 and discussed in §4. The conclusion is presented in the last section. We use the convention of spectral index defined via .
1.1 NGC 4214
NGC 4214 is a nearby barred S-shaped Magellanic irregular galaxy having nearly face-on orientation (Allsopp 1979). It has been identified as a starburst galaxy with an inner starburst region and an older red disk and has been the subject of extensive multi-wavelength research. NGC 4214 has two main regions of star formation - the northern one (RA=12h15m39s, DEC=, J2000) has a shell-type morphology visible at high angular resolution near the centre of the galaxy which is known in literature as NGC 4214-I. A smaller second star forming complex located to the south (RA=12h15m40s, DEC=, J2000) of NGC 4214-I is known as NGC 4214-II. NGC 4214 is a member of the group LGG 291 (Garcia 1993) which contains 14 galaxies. The two closest members are the dwarf galaxy DDO 113 and the star-forming irregular galaxy NGC 4190 having similar radial velocities as NGC 4214. These galaxies are within angular separation of from NGC 4214 and consequently hace been in the field of view. The distance to NGC 4214 reported in literature ranges from 2 Mpc to 7 Mpc. Throughout this paper, we use a distance of 2.94 Mpc (Maíz-Apellániz et al. 2002) and thus 1′′ corresponds to 14 pc. NGC 4214 is a gas-rich blue galaxy with a thick disk (Maiz-Apellaniz et al. 1997).
Diffuse X-ray emission from hot gas is detected in this galaxy (Ott, Walter & Brinks 2005). Intense UV emission observed from this galaxy is believed to be due to its low dust content, leading to inefficient processing of UV to longer wavelengths (Fanelli et al. 1997). MacKenty et al. (2000) detected several young (10 Myr) star-forming complexes of various ionised gas morphologies with sizes 10-200 pc in their HST observations. In addition, they reported that the extended diffuse ionised gas in NGC 4214 contributes 40 of the total H and O III 5007 emission of the galaxy. The Hi gas in this galaxy is observed to be times the Holmberg radius in extent (Allsopp 1979). NGC 4214 has been studied in the radio continuum by Allsopp (1979); Beck et al. (2000); MacKenty et al. (2000) and recently by Kepley et al. (2011). Beck et al. (2000) studied the radio continuum emission from the star forming regions NGC 4214-I and NGC 4214-II at 15, 8.3, 5 and 1.4 GHz using VLA at high angular resolution. Interestingly, they found that the spectrum was rising between 5 and 15 GHz, indicating the presence of optically thick free-free thermal emission. Kepley et al. (2011) estimated a magnetic field of G in the central parts and G at the edges and do not detect significant polarisation on scales larger than 200 pc.
1.2 NGC 4449
NGC 4449 is a typical type 1 Magellanic irregular galaxy with star formation occurring throughout the galaxy at a rate almost twice that of the LMC (Thronson et al. 1987; Hunter et al. 1999). The distance to the galaxy reported in the literature ranges from 2.9 Mpc to 5.4 Mpc. Throughout this paper, we use a distance of 3.9 Mpc given by Annibali et al. (2008) and thus corresponds to 19 pc. This galaxy has been studied extensively in the optical bands ( e.g. Crillon & Monnet (1969); Kewley et al. (2002)), in the radio (Seaquist & Bignell 1978; Klein & Gräve 1986; Hunter 1991; Klein et al. 1996), in the Hi (Rogstad et al. 1967; van Woerden et al. 1975) and in CO (Tacconi & Young 1985; Sasaki et al. 1990; Böttner et al. 2003). NGC 4449 appears to be undergoing tidal interaction with the neighbouring dwarf galaxy DDO 125 (Hunter et al. 1998; Theis & Kohle 2001).
Klein et al. (1996) have studied NGC 4449 using WSRT and detected a large synchrotron halo ( kpc) around the central star forming region at 610 MHz. At the distance of 3.9 Mpc, the halo extent is about 7.4 kpc (Klein et al. 1996). They found the radio spectrum of the synchrotron radiation between 610 MHz and 24 GHz to be in the central regions and in the halo regions. They fitted a combination of thermal and non-thermal emission to the integrated spectrum between 610 MHz and 24 GHz and found the global non-thermal spectral index to be . This galaxy is found to be rich in Hi, with MHI = (Epstein 1964) and the Hi halo extends to 6 times the Holmberg radius (Hunter et al. 1998). X-ray observations of NGC 4449 show a circular region of diffuse emission 1′ north of the centre of the galaxy (Ott et al. 2005). Chyży et al. (2000) studied the polarised radio continuum emission of NGC 4449, at 8.46 and 4.86 GHz and found a regular galaxy-scale magnetic field of strength G. They point out that the strong magnetic fields are intriguing since the galaxy exhibits slow rotation which cannot support the dynamo action required to amplify the magnetic field. They also detect the large continuum halo at 8 GHz.
2 Observations and Data Reduction
Both the galaxies were observed using the GMRT; (Swarup et al. 1991; Ananthakrishnan 2005) in the radio continuum at 150, 240, 325 and 610 MHz. The 240 and 610 MHz observations were simultaneous in the dual band mode. It is remarked that the 240 MHz data of both the galaxies were corrupted to the extent that even after extensive flagging the final image quality was suspect. We hence did not use 240 MHz data in the analysis presented here. Since the galaxies are closely located in the sky, they were observed in the same observing run with common calibration scans. The target source scans alternated between the two galaxies resulting in better uv-coverage for both the galaxies.
The 240 and 610 MHz observations were simultaneous in the dual band mode. All the observations were done in the non-polar mode of observing known as the Indian polar mode. The details of these observations are given in Table 2. We also analysed GMRT archival data at 610 MHz for NGC 4214 from August 2007. These single frequency observations have better sampling of short spacings and hence are presented in this paper.
| Observing Band (MHz) | 150 | 325 | 610# |
|---|---|---|---|
| Observation date | 28/10/2012 | 23/12/2009 | 20/12/2008 |
| Pointing Centre - NGC 4214 | and | ||
| Pointing Centre - NGC 4449 | and | ||
| Receiver Bandwidth (MHz) | 16 | 32 | 16 |
| No. of Antennas∗ | 27 | 29 | 28 |
| Primary Calibrator(s) | 3C286 | 3C147 | 3C147, 3C286 |
| Flux density (Jy)† | 31.05 | 52.69 | 38.12, 21.01 |
| Secondary calibrator(s) | 3C286 | 1123055 | 1227365 |
| Flux density (Jy)‡ | 31.05 | 6.70.15 | 1.80.03 |
| Telescope time (hrs) | 9 | 7 | 7 |
# Dual band observation (240 & 610 MHz).
∗ Maximum number of operational antennas during the observation.
Set by SETJY task : Using (1999.2) VLA or Reynolds (1934-638) coefficients.
Flux density and error from GETJY
| Galaxy Name | NGC 4214 | NGC 4449 | ||||
|---|---|---|---|---|---|---|
| Observing Bands | 150 (MHz) | 325 (MHz) | 610 (MHz) | 150 (MHz) | 325 (MHz) | 610 (MHz) |
| Beam Size(ROBUST=0) | ||||||
| Position Angle | ||||||
| RMS noise level (mJy beam-1) | 3.2 | 0.34 | 0.09 | 2.3 | 1.4 | 1.1 |
| Beam Size (ROBUST=5) | ||||||
| Position Angle | ||||||
| RMS noise level (mJy beam-1) | 6.2 | 0.56 | 0.13 | 4.3 | 1.9 | 0.22 |
| Shortest spacing (k) | 0.04 | 0.06 | 0.20 | 0.04 | 0.06 | 0.20 |
| m | m | m | m | m | m | |
| Longest spacing (k) | 13 | 27 | 50 | 13 | 27 | 50 |
| km | km | km | km | km | km | |
| Largest Visible structure# | ||||||
Note: # Corresponding to the shortest spacing present in our data.
The observations started and ended with a 15m observing run on an amplitude/bandpass calibrator (3C 286 or 3C 147). The phase calibrator was observed for about 5m after every 20m on a target galaxy. All the observations except the last one in 2012 used the old, now decommissioned GMRT hardware correlator. The 2012 run used the new GMRT software backend. These observations used a baseband width of 16 MHz. The raw data obtained in the local format were converted into FITS and this data file was then imported into the NRAO AIPS111AIPS software is produced and maintained by the National Radio Astronomy Observatory, a facility of the National Science Foundation operated under cooperative agreement by Associated Universities, Inc. software. The data were edited, calibrated and imaged using standard tasks in AIPS. After an initial round of flagging, the single channel data of the amplitude calibrator were calibrated and then the editing of bad data and calibration were iteratively repeated. The data for antennas with relatively large errors in antenna-based gain solutions were examined and flagged. Once the gain calibration was satisfactory, the calibrated data were used to obtain the bandpass calibration tables. Once the bandpass calibration became satisfactory, i.e. the closure errors were less than one percent, the bandpass gain tables were applied to the data and the channel data averaged to generate continuum data sets. To avoid bandwidth smearing at low frequencies due to large fields of view, we averaged 20 channels at 610 MHz, 7 channels at 325 MHz and 4 channels at 150 MHz corresponding to channel widths of 1.8 MHz, 0.9 MHz and 0.4 MHz, respectively. Thus a SPLAT data base with these channel widths was generated for further analysis. The amplitude and phase calibrator data were used to obtain the gains of the antennas which were then applied to the target source. Bad data on the target source were edited and the final calibrated visibility data were obtained.
These data were then imaged by creating multiple facets across the primary beam to avoid wide-field effects in the image plane. 25 facets were used for imaging data at 610 MHz whereas 49 facets were used at 325 and 150 MHz. This image was used as the model for the first round of phase-only self-calibration. On average two to three rounds of phase-only self-calibration were required, followed by a final round of amplitude and phase self-calibration. This procedure improved the images at all the frequencies. All facets were combined using the task FLATN to produce a final map at each observing frequency. Moreover, we made maps using a range of different weighting schemes with robustness parameters, where +5 is a pure natural weight and -5 is a pure uniform weight (Briggs 1995). This resulted in different beam sizes and signal-to-noise ratios. We also made images after including a uv cutoff in the data to examine the presence of features on different angular scales. The final images were corrected for primary-beam attenuation before undertaking flux density measurements.
The presence of a strong source close to NGC 4449 affected the image quality and to improve the image, we removed this source using the task UVSUB in AIPS. While this did improve the images, it was difficult to remove all the artifacts. In particular the final image at 325 MHz was badly affected and therefore, we do not present the image but include the flux density estimates at this frequency, with the caveat that the value quoted might have a large systematic error.
3 Results
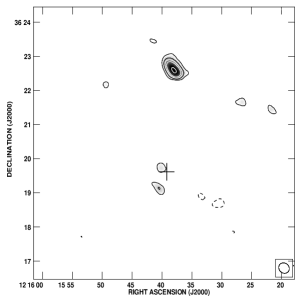
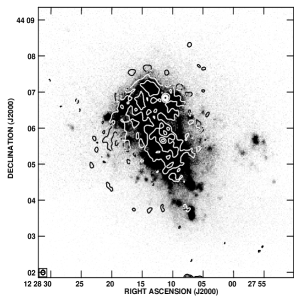
The final images made at 610, 325 and 150 MHz for the two galaxies are shown in Figures 1 and 2 and the image parameters along with the results are listed in Table 3. The flux densities for both the galaxies estimated at the different GMRT frequencies are listed in Table 4, along with the values obtained from literature. The spectrum is shown in Figure 4. It is to be noted that the systematic errors on the GMRT flux denstities estimated using the noise statistics in a similar region around the source were larger than the statistical errors.
3.1 NGC 4214
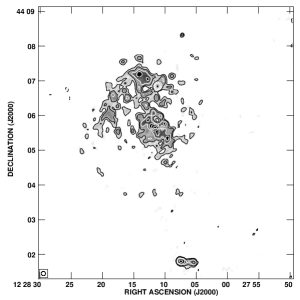
The images of NGC 4214 at 150, 325 and 610 MHz made with robust weighting= 0 are shown in Figure 1. The 325 MHz image, which has an rms noise of 0.34 mJy/beam, detects the emission from both the central region and the diffuse halo . The 150 MHz detects only the compact emission from the central parts of the galaxy while the 610 MHz image has picked up emission from diffuse regions immediately surrounding the central compact regions. In Figure 1 the radio emission is observed to extend towards the north from the main disk of the galaxy along a narrow ridge which connects to the northern region. The emission at 325 MHz appears to be fragmented at several locations in the main disk of the galaxy, some of which could be imaging artifacts. We do not detect the diffuse extended emission at 150 MHz. To understand this let us note that the 1 sigma rms noise in the image is 3.2 mJy/beam for a beam size of about , whereas the brightness at 150 MHz, arrived at after employing the brightness of the diffuse region at 325 MHz and a spectral index of 1, is expected to be 3.3 mJy beam-1 and which is below the 3 sigma sensitivity of our 150 MHz image. As shown in Figure 1, we detect the intense star forming regions NGC 4214-I (northern) and NGC 4214-II (southern) in the centre of NGC 4214. We also analysed the 1.4 GHz VLA archival data (AM236) observed in A configuration and have detected the star-forming regions NGC 4214-I and NGC 4214-II in addition to another star-forming complex in the north-west of these regions. Moreover at all the three bands, emission is detected from a region located in the north around right ascension of and declination of .
NVSS images show extended emission from this galaxy. We made a low resolution map at 325 MHz to match the resolution of the NVSS. These maps, were then used to generate a spectral index distribution across the galaxy. The spectral index across the galaxy varies from in the outer parts of the halo emission to in the central parts of the galaxy.
NGC 4190 ( , (J2000)) lying within the field of view of NGC 4214 is detected at 325 MHz with a flux density of 8.11.0 mJy.
3.2 NGC 4449
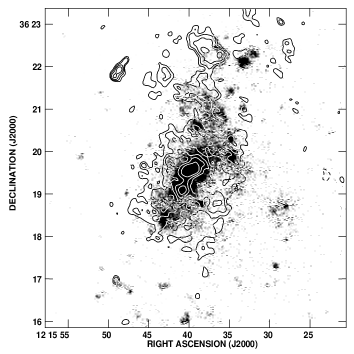
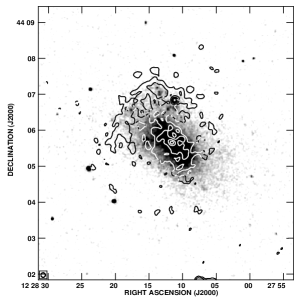
The 150 and 610 MHz images made with robust=5 weighting which are sensitive to the extended emission are shown in Figure 2. A spiral arm-like extension from east to west in the north of the galaxy is seen (Figure 2). Diffuse radio emission is detected with two radio peaks embedded within it. The southern compact source is the centre of the galaxy whereas the northern source is the supernova remnant J1228+441. The fragmented emission is likely due to imaging artifacts introduced by the sparse longer baselines in the data. The presence of a strong source located about 7′ to the southwest of the galaxy resulted in enhanced artifacts in our images.
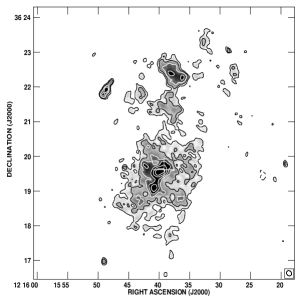
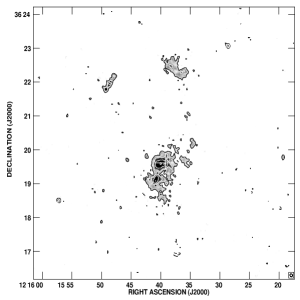
The double source seen to the south of NGC 4449 in both the 610 and 150 MHz images is most likely a distant radio galaxy as suggested by Chyży et al. (2000).
| (MHz) | NGC 4214 | NGC 4449 | References |
| (mJy) | (mJy) | ||
| 150 | 1,1 | ||
| 325 | 1,1 | ||
| 609 | 2 | ||
| 610 | 1,1 | ||
| 1400 | 3,3 | ||
| 1400 | 4 | ||
| 1400 | 5 | ||
| 1400 | 6 | ||
| 1415 | 7 | ||
| 1600 | 6 | ||
| 2380 | 8 | ||
| 2700 | 9 | ||
| 3300 | 6 | ||
| 4750 | 10 | ||
| 4850 | 11 | ||
| 4850 | 12 | ||
| 4860 | 4 | ||
| 5000 | 13 | ||
| 8460 | 14 | ||
| 8460 | 4 | ||
| 10550 | 2 | ||
| 10770 | 15 | ||
| 10770 | 10 | ||
| 24500 | 10 |
The estimated systematic errors are quoted here.
# shows the datapoints plotted in Figure 4
References:(1) This paper; (2) Klein
et al. (1996); (3) NVSS; (4) Kepley et al. (2011);
(5) Condon
et al. (2002); (6) Mas-Hesse &
Kunth (1999) Radio data taken at Nancay Radio Telescope;
(7) Hummel (1980); (8) Dressel &
Condon (1978); (9) Haynes &
Sramek (1975);
(10) Klein &
Gräve (1986); (11) Becker
et al. (1991); (12) Gregory &
Condon (1991);
(13) Sramek (1975); (14) Schmitt
et al. (2006); (15) Israel & van
der Hulst (1983)
NVSS detects extended emission enclosing the entire disk of NGC 4449. We used the NVSS 1.4 GHz map of NGC 4449, which has an angular resolution of 45′′ and 150 MHz (robust=5) image after smoothing the latter to the NVSS resolution to generate a spectral index map of the radio emission. The spectral index across the galaxy varies from 1.5 in the outer regions to 0.5 in the inner regions.
3.3 Estimating the thermal emission
The continuum emission at radio frequencies is mainly due to two emission processes - namely synchrotron (also referred to as nonthermal) emission from relativistic electrons accelerated in an ambient galactic magnetic field and thermal free–free emission from star forming Hii regions. Owing to the steep spectral index, of the nonthermal emission () compared to the thermal emission which has a spectral index of , it is expected to dominate at low ( GHz) radio frequencies. Relativistic electrons are believed to be accelerated in supernova shock fronts by diffusive shock acceleration mechanism and are injected into the interstellar medium (ISM) with (Bell 1978; Bogdan & Volk 1983; Biermann & Strom 1993). This has been confirmed by observations of galactic supernova remnants (see Kothes et al. 2006; Green 2009). The electrons, then, propagate away and lose energy in the process mainly due to synchrotron and/or inverse-Compton cooling and thereby changing (see e.g. Longair 2011). The study of can throw meaningful insight into the energy loss/gain mechanisms of relativistic electrons giving rise to the nonthermal emission. However, due to the presence of thermal emission, the global spectral index is contaminated and is flatter than actual, particularly in giant Hii regions harbouring recent star formation activity.
This, therefore, necessitates separating the thermal emission from the total emission in these galaxies which have massive ongoing star formation (Walter et al. 2001; Reines et al. 2008). We estimate the thermal emission from these galaxies, employing H emission, following Tabatabaei et al. (2007), since H and thermal free–free emission arise in the same ionised gas. The thermal emission flux density () at a frequency is given by,
| (1) |
Here, is the Boltzmann constant, is the velocity of light, is the temperature of thermal electrons assumed to be K and is the free–free optical depth. is related to the emission measure () as
| (2) |
The is determined from the H intensity () of the galaxy using equation (9) in Valls-Gabaud (1998),
| (3) |
Here, is the electron temperature in units of K.
Thermal emission was computed for NGC 4214 and NGC 4449 for each pixel from the H maps observed with the 2.3-meter BOK telescope at Kitt Peak National Observatory, downloaded from the NED. The galaxies were observed at a centre wavelength of 6850 Å, with a filter width of 68.7 Å. The counts per second in these maps were converted to apparent magnitude using the zero-point given in the FITS file header. The specific intensity () was calculated from i.e. , which was converted to the desired flux units of from, . The thermal emission map determined based on the H maps has an angular resolution of . The optically thin free–free emission was then removed from the total flux density at all frequencies, and the remnant flux was assumed to be due to synchrotron emission. Integrated radio spectrum of NGC 4214 and NGC 4449 are displayed in Figure 4 and 4 where solid, dot-dashed and dashed lines represent, respectively, the total, the nonthermal, and the the thermal components. A power law fitting gives us for NGC 4214 and for NGC 4449.
We note that the H emission suffer due to extinction from dust present in these galaxies. The dust extinction was estimated, using the optical depth, , of the obscuring dust at FIR wavelength of m (Tabatabaei et al. 2007). We used the MIPS data of the Spitzer space telescope to estimate the dust temperature and thus . was estimated by fitting a modified black body spectrum of the form, between 70 and 160 m, where is the Planck function. Here, is the flux at a FIR frequency and is the power-law index of dust absorption efficiency assumed to be 2 (Draine & Lee 1984). The optical depth at H wavelength was estimated by extrapolating using the standard dust model for our galaxy (Krügel 2003). In dense Hii regions, the extinction was found to be , while in other parts it was . Thus, the H flux and thereby the thermal emission at radio frequencies determined by us in this study are lower limits.
4 Discussion
4.1 NGC 4214
4.1.1 Morphology and correlation with emission at other wavebands


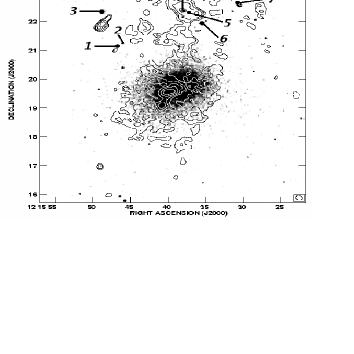
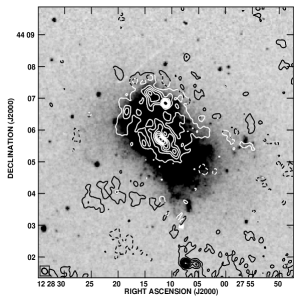
In Figures 3 and 3, the radio contours at 325 MHz are shown superposed on the GALEX222Galaxy Evolution Explorer is an orbiting ultraviolet space telescope. FUV (1350 - 1750Å) and 2MASS NIR images. Scattered star–forming regions are seen to the west, south and north of the intense star forming disk of NGC 4214 in the UV images, whereas the NIR emission has a boxy morphology. Radio emission at 325 MHz is detected from the entire FUV disk. The angular extent of the 325 MHz halo is about 2.3 kpc. While radio emission is detected from a part of the northern star forming region, no radio emission is seen to be associated with the ultraviolet emission in the west and south of the disk of the galaxy. We note that there are two more discrete radio continuum regions in the field, similar to as pointed out earlier by Kepley et al. (2011) - one in the northern part of NGC 4214 and the other in the northeast. While FUV emission is associated with the western part of the northern star forming region, no such emission is associated with the source in the north-east. Our high-resolution images (e.g. Figure 1) show the source in the north-east to be a double source and our results support the conclusion by Kepley et al. (2011) about it being a background radio galaxy.
The NUV and FUV emissions show the galaxy to be undergoing vigorous star formation, which extends along a bridge-like feature to the north. Radio emission at 325 MHz is also detected along the bridge-like extension and the northern star forming region. The SFR estimated from the non-thermal emission is . The UV emission appears to be of irregular morphology, with the star formation triggered at various locations along a thick and almost north-south ridge. While the extent along the major axis of the galaxy is similar, the radio continuum appears to be boxy in nature (Figure 3). The old stellar population is distributed in a spherical halo resembling a large globular cluster as is also seen in the I band image of Fanelli et al. (1997). The radio continuum appears to be more extended than the NIR emission. No NIR emission is detected along the bridge-like extension or from the northern star-forming region, indicating a fairly recent star formation episode in these regions. The radio emission associated with this northern region is more extended in the east compared to the FUV (see Figure 3). Two radio peaks are visible in this northern region at 610 and 325 MHz, with the eastern peak coinciding with the 2MASS source, 2MASX J121537953622218, which is classified as a background galaxy (see Figure 3). The western radio peak region shows the presence of FUV emission and is a star-forming region in NGC 4214. At 150 MHz the emission from the northern region is seen to be exceptionally bright in comparison with the rest of the galaxy. The spectrum of this northern region between 150 and 610 MHz is fitted by a single power-law with a spectral index of . X-ray emission has been detected from this region by Ott et al. (2005). The emission at 150 MHz shows a single peak coincident with the 2MASS galaxy. Thus, we suggest that the northern region consists of two distinct parts - the western part which is associated with the star-forming region in NGC 4214 and the eastern part which is associated with the background galaxy 2MASX J1253795+362218 (Srivastava, Kantharia & Srivastava 2011). The two peaks are easily identifiable in our 610 MHz image in Figure 1. The radio galaxy to the north-east and the galaxy in the north are likely part of a larger distant cluster.
An alternative scenario is provided by Kepley et al. (2011) who suggest that the entire northern part is a star-forming region of age Myr and the emission at 20 cm is elongated due to a uniform magnetic field with a strength of 7.6 G. The central star forming regions are well resolved and compare well with the higher radio frequency maps by Beck et al. (2000). The molecular gas has been reported confined to three distinct regions - NGC 4214-I, NGC 4214-II and and a region 760 pc to the north-west (Walter et al. 2001). Star-forming regions are close to all the three clouds and radio continuum emission is detected from these. Starbursting dwarf galaxies tend to be Hi - rich (Thuan & Martin 1981; Taylor et al. 1995). The Hi from NGC 4214 is reported to be extended (Allsopp 1979). However, the radio continuum at 325 MHz is found to bear little resemblance to this.
4.1.2 The global spectrum
In this subsection, we discuss the global spectrum of NGC 4214 after combining our three-frequency radio data with data from literature. The data are listed in Table 4 and the entries marked by a # are plotted in Figure 4. The integrated spectral index down to 610 MHz is fitted by a power-law spectrum of index . This is similar to the value of determined by Kepley et al. (2011) for 1 GHz. The presence of the halo emission detected at 325 MHz makes the galaxy similar to normal star-forming disk galaxies and NGC 4449 (Klein et al. 1996). We note that the low frequency spectrum includes a contribution from the region located to the north of the galaxy.
Integrated radio spectrum presented in Figure 4 reveals that the thermal emission starts becoming significant at higher radio frequencies, with about 40% of the total emission near 5 GHz and 22% at 610 MHz being thermal in origin. This is significantly higher than 10 thermal emission at 1 GHz found for normal star-forming galaxies. We determine the synchrotron flux density by subtracting the thermal emission from the total flux density at all frequencies of observation and represent it in Figure 4 by dot-dash line. It is pointed out that the flux density is high at 325 MHz due to contribution from diffuse halo emission and is low at 150 MHz due to sensitivity issues, hence, we excluded these points from the power-law fit to the non-thermal spectrum and and we estimated to be for NGC 4214. Thus a combination of synchrotron spectrum with index and free-free thermal emission with index explains well the observed spectrum between 610 MHz and 8.7 GHz (Figure 4). From the spectral index map made between our 325 MHz and 1.4 GHz (NVSS), we find that the spectrum of the halo emission in the outer parts of the galaxy is , indicative of an aged electron population.
4.1.3 The compact star forming regions: NGC 4214-I and NGC 4214-II
As shown in Figure 1, we detect the intense star forming regions in the centre of NGC 4214: NGC 4214-I and NGC 4214-II. These regions are detected at 325 MHz as surrounded by diffuse extended. To study these compact regions, we imaged the GMRT data by excluding baselines shorter than 3, so that the extended emission was resolved (see Figure 5). We study the spectra of these two regions from 325 MHz to 15 GHz after including the high frequency data between about 4 to 15 GHz from Beck et al. (2000) (see Figures 5, 6). As noted in the previous section, the low sensitivity of the 150 MHz image did not allow detection of the diffuse emissions from these regions. Besides, the flux densities of NGC 4214-I and NGC 4214-II are also lower than predicted by a non-thermal spectrum (see Figure 6), implying that thermal absorption could also be a reason for non-detection of the diffuse emissions. Since it is difficult to disentangle the two effects with the current data, we have excluded the 150 MHz point from our analysis. The spectra of both the regions display similar behaviour but significantly different from the global spectrum (see Figure 4), especially at high radio frequencies. The spectra shown in Figure 6 appear to consist of three components: the synchrotron non-thermal emission dominating at the lowest frequencies, the optically thin ) free-free thermal emission and the optically thick () free-free thermal emission dominating at the higher frequencies. We note that the last component () has been studied by Beck et al. (2000) who suggested a turnover frequency for this component to be GHz. We have tried to ensure that all the data points used in our analysis (see Figure 6) were sensitive to the largest angular scale that we are probing for the two regions. We have excluded 8 GHz data point (Beck et al. 2000) from our analysis on the ground that the largest angular scale probed by them was 15′′ and hence, it is likely that the flux is missed out.
In the first step of the analysis, the optically thin thermal emission was estimated by extrapolating from the H map of the region. No correction for internal extinction was made to the H map. The estimated spectrum is shown by the dashed lines in Figure 6. We, then subtracted this thermal emission from the total flux density at each frequency. In the second step, the remaining emission was fitted by a combination spectrum of the type:


| (4) |
This simple model resulted in a reasonably good fit (solid line curve in Figure 6) to the data for both the complexes. While the optically thick component was fixed to vary as , the non-thermal spectral index was a free parameter in the model. The best fits gave = for NGC 4214-I and = for NGC 4214-II.
The thermal contribution due to the optically thin component for NGC 4214-I at 325 MHz, 610 MHz and 1.4 GHz are about 35%, 40% and 42% whereas for NGC 4214-II, it is about 32%, 49% and 54% respectively. Kepley et al. (2011) also estimate the thermal emission at 1.4 GHz in central parts to be about 50% of the total emission. The complex spectrum of NGC 4214-I and II indicate the presence of 1 ultra-compact HII regions, 1 diffuse thermal and non-thermal emission.
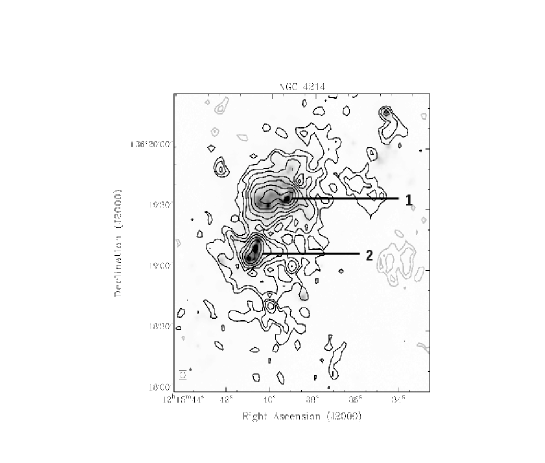
A detailed look at Figure 5 shows two radio peaks in NGC 4214-I, the eastern peak is diffuse and intense at 325 MHz whereas the western peak is strongest at 1.4 GHz. This indicates a steeper spectrum in the east and hence possibly an older star-forming region. The H image (see Figure 7) shows bright compact regions in both the eastern and western half of NGC 4214-I surrounded by diffuse emission. The eastern H peaks are displaced to the south of the radio peak at 610 MHz whereas the western H peak coincides with the radio peak. We recall that such displacement is commonly seen in the circumnuclear rings in disk galaxies and is believed to be due to the presence of dust. Good correlation between the location of the 610 MHz emission and the H emission is also observed in NGC 4214-II (see Figure 7) indicating lower dust extinction in this star forming region. We note that this galaxy is overall a dust-deficient galaxy (MacKenty et al. 2000) with the stellar clusters in NGC 4214-I of age 3 - 4 Myr, whereas the clusters in NGC 4214-II are younger at about 2.5 - 3 Myr.
The radio luminosity at 610 MHz is WHz-1 for NGC 4214-I and WHz-1 for NGC 4214-II for a resolution of about 200 pc. The luminosities of these star-forming regions (1019 W Hz-1) appear to be similar to those in circumnuclear rings of typical diameter pc in several normal disk galaxies observed with similar linear resolution. For example, Kodilkar et al. (2011), who have done a radio study of the circumnuclear ring in NGC 2997 with a linear resolution of 200 pc, find that the luminosity of the five star-forming clumps resolved in the ring at 1.4 GHz is between to W Hz-1. Moreover, Kodilkar et al. (2011) estimate an equipartition magnetic field of about 30 G for the circumnuclear ring in NGC 2997 which is similar to that estimated for the central regions of NGC 4214 by Kepley et al. (2011). Thus star-forming regions in the centre of NGC 4214 appear to display properties similar to the centres of normal disk galaxies. This is important since NGC 4214 is a dwarf WR galaxy of lower metallicity and it is instructive to compare their star-forming complexes with those in the better studied disk galaxies.
Finally, we comment on the possible corrections that can be included to improve this study. Firstly, the correction for extinction in the H signal due to dust in NGC 4214 can be included. We estimate a maximum variation of 20% in the estimates of thermal emission due to extinction. Including dust extinction might lead to a synchrotron spectrum that is steeper than the estimated for NGC 4214-I. The effect of dust does not seem to be observable in the H image of NGC 4214-II (see Figure 7). This would indicate that only small corrections will have to be made on the estimated non-thermal spectrum. Secondly, the radio maps used to obtain this interesting result are made with varying uv coverage of the fixed antenna configuration of GMRT. Being low radio frequencies, the data are subject to extensive flagging. Thus, there is a possibility that the images might be sensitive to somewhat different angular extents.
4.2 NGC 4449
This galaxy has been extensively studied in various wavebands including low radio frequencies. Klein et al. (1996) studied the galaxy at 610 MHz with the WSRT and detected an extended synchrotron halo around the optical galaxy. Chyży et al. (2000) have detected the radio halo at 8.46 and 4.86 GHz and mapped the galaxy in polarised emission. Our continuum observations trace the regions of large scale regular magnetic field seen by Chyży et al. (2000). Extended radio emission was detected at all the observed GMRT bands of 150 MHz, 325 MHz and 610 MHz.
4.2.1 Comparing with emission at other wavebands
The radio emission detected at 150 MHz and 610 MHz is shown in Figure 2. We estimate the size of the 150 MHz halo to be about 4 kpc which is similar to the size of 3.5 kpc that Chyży et al. (2000) estimate but smaller than the 7 kpc that Klein et al. (1996) estimate. The spiral arm-like feature in the north of the galaxy, clearly detected in our 610 MHz images shown in Figures 8 and 8 has highly ordered magnetic field (Chyży et al. 2000; Klein et al. 1996). Polarization study by Chyży et al. (2000) reveals intriguing galaxy-scale magnetic fields of G, even though the galaxy is a slow, chaotic rotator.
NGC 4449 is estimated to be about five times more luminous than NGC 4214, indicating vigorous star formation in NGC 4449. The star formation rates estimated from the non-thermal emission is . About 10 ULXs (X-ray luminosity ) have been detected in NGC 4449 (Ott et al. 2005) which confirms the heightened level of activity in this galaxy. We have overlaid the radio contours at 610 MHz on the GALEX FUV map in Figure 8 and NIR image from 2MASS in Figure 8. The FUV map show an almost north-south distribution of vigorous star formation, whereas the 2MASS emission is boxy in nature and centrally concentrated. This is similar to NGC 4214 discussed in the previous section. While the 2MASS emission shown in Figure 8 is symmetric about the centre of the galaxy, the ultraviolet and radio emission are asymmetric, with excess emission detected in the north of the galaxy. The ultraviolet emission extends further south compared to the radio continuum emission. The spiral arm-like feature seen in the north of the galaxy shows a counterpart in the ultraviolet. However, it is seen to skirt the NIR emission in the galaxy, indicating the recent star formation there. The extent of disk in south is similiar to radio. The X-ray emission is surrounded by an extended HI envelope (see e.g. Yun et al. 1994; Hunter et al. 1998).
4.2.2 The global spectrum
Our multi-frequency data alongwith the integrated flux density data available in literature are listed in Table 4. Figure 4 shows the global spectrum of NGC 4449 in the frequency range of 150 MHz to 22 GHz. Chyży et al. (2000) have presented spectral-index maps between 8.46 GHz and 4.86 GHz and find that the spectral index changes from in strongly star forming regions to locally in the outer southern region. They also reported that the radio-bright peaks coincide with strongly star-forming regions which show increased thermal fractions (up to 80 at 8.46 GHz). Klein et al. (1996), estimated a thermal fraction at 1 GHz of and a non-thermal spectral index = 0.70.1.
Figure 4 reveals that about 20% of the total emission near 5 GHz is thermal in origin. The synchrotron spectral index for NGC 4449 using 150 MHz and 22 GHz data is estimated to be . The 325 MHz point was excluded. Interestingly, Klein et al. (1996) record a flux density of 480 mJy at 610 MHz. The spectral index between this and our 325 MHz data is 0.74. Thus a combination of a synchrotron spectrum with index 0.49 and free-free thermal emission with index 0.1 explains the observed spectrum between 150 MHz and 22 GHz as shown in Figure 4. We estimate that about 9% of the total emission at 610 MHz is thermal in origin, which is similar to normal disk galaxies but less than to what we estimate for NGC 4214 (). One possible reason could be the higher dust extinction in NGC 4449 leading to an under estimation of the thermal fraction at radio frequencies from the H map. Alternatively, the continuous massive star formation in NGC 4449 might be arising enhanced non-thermal emission in the galaxy. The spectral index is flatter than found in normal galaxies, suggesting continuous star formation injecting energy into the relativistic plasma.
4.2.3 The supernova remnant SNR J1228+441:
The flux density of the supernova remnant SNR J1228+441 was estimated from images made after excluding the short baselines. The SNR was unresolved in all our images and is the most intense feature in NGC 4449 at all GMRT frequencies. This SNR is five time more luminous than Cas A at 20cm (Chomiuk & Wilcots 2009). It has been extensively monitored (e.g. Lacey et al. (2007) and references therein). Lacey et al. (2007) report steepening of the spectral index from in 1994 to in 2001-2002, showing rapid evolution. Reines et al. (2008) using high–resolution VLA data at several frequencies find that the supernova remnant had a spectral index of between 3.6 cm and 6 cm and an index of between 1.3 cm and 3.6 cm between 2001 and 2002, indicating a break in the spectrum. From our observations at 325 and 610 MHz in 2008-2009, we estimate flux densities of 35.29.1 mJy and 11.22.9 mJy, respectively, and at 150 MHz in 2012, we estimate a flux density of 32.45.1 mJy. The spectral index between 325 and 610 MHz is calculated to be for epoch 2008-2009.
4.3 Radio–FIR correlation
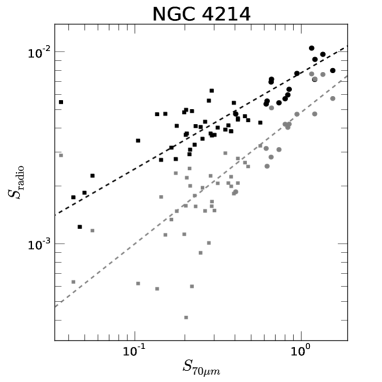
The well known radio-far infrared (FIR) correlation is known to hold good over five orders of magnitude in luminosity, with a dispersion less than a factor of 2. The radio emission is due to relativistic electrons being accelerated in ambient galactic magnetic field, while the FIR emission is radiation from dust heated by ultra-violet (UV) photons from massive () short lived ( yr) stars. The two regimes are thought to be connected by star formation activity (Harwit & Pacini 1975). Small-scale amplification of the magnetic field due to turbulent dynamo action couples the magnetic field () and gas density () as (see e.g., Cho & Vishniac 2000; Groves et al. 2003; Chandrasekhar & Fermi 1953) and is believed to produce the tightness seen in the correlation at local as well as on global scales (see e.g., Niklas & Beck 1997; Dumas et al. 2011; Basu et al. 2012). Here, is the coupling index predicted to lie in the range 0.40.6 by numerical simulations of different ISM turbulence (Fiedler & Mouschovias 1993; Groves et al. 2003; Kim et al. 2001; Thompson et al. 2006; Murgia et al. 2005). The slope of the radio–FIR correlation, , defined via where is the flux density at a radio frequency and is the flux density of the FIR emission, is related to the coupling index giving rise to the tight radio–FIR correlation (see e.g., Niklas & Beck 1997; Dumas et al. 2011; Basu et al. 2012). However, note that this prescription holds good if both the radio and FIR emission originate from the same emitting volume. Owing to different propagation lengths of the cosmic ray electrons (CREs) from the sites of generation, the slope of the correlation in spatially resolved galaxies is expected to change (Basu et al. 2012; Berkhuijsen et al. 2013). Here we study spatially resolved radio–FIR correlation at 16′′ angular resolution, corresponding to linear scale of and kpc for the two galaxies NGC 4214 and NGC 4449, respectively. The correlation is studied using the nonthermal radio emission at 325 and 610 MHz for NGC 4214 and at 150 MHz for NGC 4449, and the FIR emission at m observed using the Spitzer space telescope and downloaded from the NED.
Figure 9 shows the nonthermal radio flux density at 325 MHz (solid black symbols) determined within regions of 16′′ in size and 610 MHz (gray symbols) with the FIR flux density at m in units of Jy beam-1 for NGC 4214. The circular, square and triangular symbols represent bright Hii, diffuse Hii and bridge emission respectively. The different regions are shown in Figure 9. The data were fitted with using an ordinary least-square bisector method (Isobe et al. 1990) in the log-log plane at both radio frequencies. The fits to the data are shown by the dashed lines in Figure 9. The emission at the two wavebands are found to be strongly correlated with Pearson’s correlation coefficient, at 325 MHz and at 610 MHz. The slope at 325 MHz is found to be 0.470.04, flatter than that at 610 MHz where the slope is 0.680.08.
The magnetic field in NGC 4214 has been estimated to be G towards the bright Hii regions and G in the diffuse regions (Kepley et al. 2011). The magnetic field in such bright HII regions is expected to be tangled due to turbulence produced by star formation activity and by propagation of CREs due to streaming instability at Alfvén velocity (, ). CREs emitting synchrotron radiation at 325 and 610 MHz would propagate and 0.6 kpc within synchrotron cooling timescales. Thus, at 325 MHz, the newly generated CREs and the older population of CREs are well mixed, giving rise to comparatively higher radio emission away from the Hii regions. This makes the slope of the radio–FIR correlation flatter at 325 MHz than at 610 MHz for the galaxy NGC 4214.
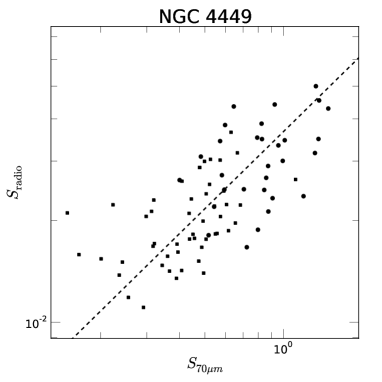
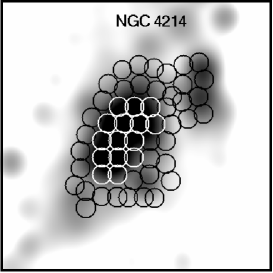
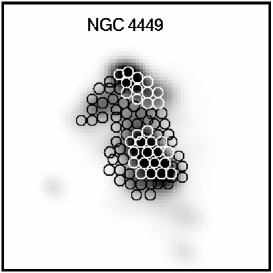
Figure 9 shows the plot of nonthermal intensity at 150 MHz with the m intensity for the galaxy NGC 4449. The circles represent bright Hii regions tracing high star formation activity and the squares represent regions of diffuse H emission. Figure 9 marks the region in the smoothed 16′′ H image of the galaxy. The white circles show the bright star forming regions and the black circles show the diffuse H regions. The slope of the radio–FIR correlation is found to be 0.750.07 and is significant, with .
NGC 4449 shows a steeper slope compared to NGC 4214 for the radio–FIR correlation when studied at 150 MHz indicating enhanced nonthermal emission in regions of star-forming sites. Such an effect was also seen for this galaxy at 8.46 GHz (Chyży et al. 2000). The nonthermal spectral index is seen to be flat in regions of dense star formation, with (estimated between the 150 and 610 MHz) and the overall nonthermal disc has . This likely indicates that the nonthermal emission in NGC 4449 predominantly originates from freshly generated CREs which are emitting close to their sites of generation, making the slope of the radio–FIR correlation steeper. Since the slope is similar to that seen in star forming regions in normal galaxies (; Basu et al. (2012); Basu & Roy (2014)) it implies that the CREs have propagation length scales lower than our linear resolution of kpc. This allows us to put upper limits on the age of the CREs assuming they are propagating with an Alfvén velocity of . It turns out that the bulk CREs were produced less than ago, due to ongoing star formation in NGC 4449. This is supported by the fact that the recent star formation, as traced by the H emission of NGC 4449 is about factor of 3–5 higher than that of NGC 4214 (Drozdovsky et al. 2002; Ott et al. 2005; Hunter et al. 1998).
5 Conclusions
| Galaxy | Sth | SFR | b | |||
|---|---|---|---|---|---|---|
| (610 MHz) | 150 MHz | 325 MHz | 610 MHz | |||
| NGC 4214 | 22 | – | 0.47(0.04) | 0.68(0.08) | ||
| NGC 4449 | 9 | 0.75(0.07) | — | — | ||
| NGC 4214-I | 40 | |||||
| NGC 4214-II | 49 | |||||
In this paper, we have presented the low radio frequency images of the WR galaxies NGC 4214 and NGC 4449 made using the GMRT. We detect a large radio halo in NGC 4214 at 325 MHz whose morphology resembles the ultraviolet emission seen by GALEX with an extent similar to the NIR emission from 2MASS. The synchrotron spectral index () is . The thermal fraction at 610 MHz is about 22%. The spectra of two compact star–forming complexes NGC 4214-I and NGC 4214-II are studied. We estimate that at 610 MHz of emission from NGC 4214-I and from NGC 4214-II are thermal in origin. The non-thermal spectral index of NGC 4214-I is estimated to be and of NGC 4214-II is . The combination of compact star-forming regions and presence of an extended halo make this dwarf galaxy similar to a normal star-forming galaxy. This galaxy follows the radio-FIR relation. We find a significant correlation between the local 325 MHz and 610 MHz emission and the 70 m emission for the entire galaxy, with slopes of 0.47 and 0.68 respectively, which is within the range expected from simulations of turbulence in the interstellar medium.
We detect a large radio halo around NGC 4449 at 150 MHz. NGC 4449 is estimated to be five time more luminous than NGC 4214, indicating vigorous star formation in the former. Both the galaxies are in a group environment and hence their star formation properties are likely to be tidally influenced by the other group members. Separating the non-thermal from the thermal emission which is obtained from the H map of NGC 4449 results in of . For NGC 4449 we estimate a thermal fraction at 610 MHz of and find that the 150 MHz emission is well correlated with the 70 m emission on small scales, with a slope of 0.75. The non-thermal spectral index of both galaxies is flatter than estimated for normal disk galaxies.
6 Acknowledgements
We thank the staff of GMRT who made these observations possible. GMRT is run by the National Centre for Radio Astrophysics (NCRA) of the Tata institute of Fundamental Physics. This research has made use of the NASA/IPAC Extragalactic Database (NED) which is operated by the Jet Propulsion Laboratory, California Institute of Technology, under contract with the National Aeronautics and Space Administration. This research has also made use of the GALEX and Spitzer Space Telescope which are NASA mission managed by the Jet Propulsion Laboratory. We also like to acknowledge the site http://skyview.gsfc.nasa.gov/. SA acknowledges an INSA Senior scientist fellowship. SS gratefully acknowledges the support of a research grant SR/S2/HEP-08/2008 by the Department of Science Technology (DST), Govt. of India and support from NCRA.
References
- Adelman-McCarthy et al. (2008) Adelman-McCarthy J. K., et al., 2008, ApJS, 175, 297
- Allen et al. (1976) Allen D. A., Wright A. E., Goss W. M., 1976, MNRAS, 177, 91
- Allsopp (1979) Allsopp N. J., 1979, MNRAS, 188, 765
- Ananthakrishnan (2005) Ananthakrishnan S., 2005, International Cosmic Ray Conference, 10, 125
- Annibali et al. (2008) Annibali F., et al., 2008, AJ, 135, 1900
- Basu & Roy (2014) Basu A., Roy S., 2014, ArXiv e-prints:1402.2229
- Basu et al. (2012) Basu A., Roy S., Mitra D., 2012, ApJ, 756, 141
- Beck et al. (2000) Beck S. C., Turner J. L., Kovo O., 2000, AJ, 120, 244
- Becker et al. (1991) Becker R. H., White R. L., Edwards A. L., 1991, ApJS, 75, 1
- Bell (1978) Bell A. R., 1978, MNRAS, 182, 443
- Berkhuijsen et al. (2013) Berkhuijsen E. M., Beck R., Tabatabaei F. S., 2013, MNRAS, 435, 1598
- Biermann & Strom (1993) Biermann P. L., Strom R. G., 1993, A&A, 275, 659
- Bogdan & Volk (1983) Bogdan T. J., Volk H. J., 1983, A&A, 122, 129
- Bottinelli et al. (1990) Bottinelli L., Gouguenheim L., Fouque P., Paturel G., 1990, A&AS, 82, 391
- Böttner et al. (2003) Böttner C., Klein U., Heithausen A., 2003, A&A, 408, 493
- Briggs (1995) Briggs D. S., 1995, BAAS, 27, 1444
- Chandrasekhar & Fermi (1953) Chandrasekhar S., Fermi E., 1953, ApJ, 118, 113
- Cho & Vishniac (2000) Cho J., Vishniac E. T., 2000, ApJ, 539, 273
- Chomiuk & Wilcots (2009) Chomiuk L., Wilcots E. M., 2009, ApJ, 703, 370
- Chyży et al. (2000) Chyży K. T., Beck R., Kohle S., Klein U., Urbanik M., 2000, A&A, 355, 128
- Condon et al. (2002) Condon J., Cotton W., Broderick J., 2002, AJ, 124, 675
- Conti (1991) Conti P. S., 1991, ApJ, 377, 115
- Crillon & Monnet (1969) Crillon R., Monnet G., 1969, A&A, 1, 449
- de Vaucouleurs et al. (1991) de Vaucouleurs G., de Vaucouleurs A., Corwin Jr. H. G., Buta R. J., Paturel G., Fouque P., 1991, S&T, 82, 621
- Deeg et al. (1993) Deeg H.-J., Brinks E., Duric N., Klein U., Skillman E., 1993, ApJ, 410, 626
- Draine & Lee (1984) Draine B. T., Lee H. M., 1984, ApJ, 285, 89
- Dressel & Condon (1978) Dressel L. L., Condon J. J., 1978, ApJS, 36, 53
- Drozdovsky et al. (2002) Drozdovsky I. O., Schulte-Ladbeck R. E., Hopp U., Greggio L., Crone M. M., 2002, AJ, 124, 811
- Dumas et al. (2011) Dumas G., Schinnerer E., Tabatabaei F. S., Beck R., Velusamy T., Murphy E., 2011, AJ, 141, 41
- Epstein (1964) Epstein E. E., 1964, AJ, 69, 490
- Fanelli et al. (1997) Fanelli M. N., et al., 1997, ApJ, 481, 735
- Fiedler & Mouschovias (1993) Fiedler R. A., Mouschovias T. C., 1993, ApJ, 415, 680
- Garcia (1993) Garcia A. M., 1993, VizieR Online Data Catalog, 410, 47
- Green (2009) Green D. A., 2009, BASI, 37, 45
- Gregory & Condon (1991) Gregory P. C., Condon J. J., 1991, ApJS, 75, 1011
- Groves et al. (2003) Groves B. A., Cho J., Dopita M., Lazarian A., 2003, PASA, 20, 252
- Harwit & Pacini (1975) Harwit M., Pacini F., 1975, ApJ, 200, L127
- Haynes & Sramek (1975) Haynes M., Sramek R., 1975, AJ, 80, 673
- Hummel (1980) Hummel E., 1980, A&AS, 41, 151
- Hunter (1991) Hunter D. A., 1991, in The Interpretation of Modern Synthesis Observations of Spiral Galaxies, ed. by N. Duric & P. C. Crane (San Francisco : ASP), 183
- Hunter et al. (1993) Hunter D. A., Hawley W. N., Gallagher III J. S., 1993, AJ, 106, 1797
- Hunter et al. (1999) Hunter D. A., van Woerden H., Gallagher J. S., 1999, AJ, 118, 2184
- Hunter et al. (1998) Hunter D. A., Wilcots E. M., van Woerden H., Gallagher J. S., Kohle S., 1998, ApJ, 495, L47
- Isobe et al. (1990) Isobe T., Feigelson E. D., Akritas M. G., Babu G. J., 1990, ApJ, 364, 104
- Israel & van der Hulst (1983) Israel F. P., van der Hulst J. M., 1983, AJ, 88, 1736
- Kepley et al. (2011) Kepley A. A., Zweibel E. G., Wilcots E. M., Johnson K. E., Robishaw T., 2011, ApJ, 736, 139
- Kewley et al. (2002) Kewley L. J., Geller M. J., Jansen R. A., Dopita M. A., 2002, AJ, 124, 3135
- Kim et al. (2001) Kim J., Balsara D., Mac Low M.-M., 2001, Journal of Korean Astronomical Society, 34, 333
- Klein & Gräve (1986) Klein U., Gräve R., 1986, A&A, 161, 155
- Klein et al. (1996) Klein U., Hummel E., Bomans D. J., Hopp U., 1996, A&A, 313, 396
- Klein et al. (1991) Klein U., Weiland H., Brinks E., 1991, A&A, 246, 323
- Kobulnicky & Skillman (1996) Kobulnicky H. A., Skillman E. D., 1996, ApJ, 471, 211
- Kodilkar et al. (2011) Kodilkar J., Kantharia N. G., Ananthakrishnan S., 2011, MNRAS, 416, 522
- Kothes et al. (2006) Kothes R., Fedotov K., Foster T. J., Uyanıker B., 2006, A&A, 457, 1081
- Krügel (2003) Krügel E., 2003, The physics of interstellar dust. IoP Series in Astronomy and Astrophysics. Bristol, Institute of Physics
- Lacey et al. (2007) Lacey C. K., Goss W. M., Mizouni L. K., 2007, AJ, 133, 2156
- Longair (2011) Longair M. S., 2011, High Energy Astrophysics. 3rd edn. Cambridge Univ. Press, Cambridge
- MacKenty et al. (2000) MacKenty J. W., Maíz-Apellániz J., Pickens C. E., Norman C. A., Walborn N. R., 2000, AJ, 120, 3007
- Maíz-Apellániz et al. (2002) Maíz-Apellániz J., Cieza L., MacKenty J. W., 2002, AJ, 123, 1307
- Maiz-Apellaniz et al. (1997) Maiz-Apellaniz J., Mas-Hesse M., Munoz-Tunon C., 1997, in Starburst Activity in Galaxies, Rev. Mex. Astrofís, Vol. 6, 23
- Martin (1997) Martin C. L., 1997, ApJ, 491, 561
- Martin (1998) Martin C. L., 1998, ApJ, 506, 222
- Mas-Hesse & Kunth (1999) Mas-Hesse J. M., Kunth D., 1999, A&A, 349, 765
- Murgia et al. (2005) Murgia M., Helfer T. T., Ekers R., Blitz L., Moscadelli L., Wong T., Paladino R., 2005, A&A, 437, 389
- Niklas & Beck (1997) Niklas S., Beck R., 1997, A&A, 320, 54
- Ott et al. (2005) Ott J., Walter F., Brinks E., 2005, MNRAS, 358, 1453
- Paturel & di Nella (1997) Paturel G., di Nella H., 1997, ApL&C, 36, 17
- Ramya et al. (2011) Ramya S., Kantharia N. G., Prabhu T. P., 2011, ApJ, 728, 124
- Reines et al. (2008) Reines A. E., Johnson K. E., Goss W. M., 2008, AJ, 135, 2222
- Rogstad et al. (1967) Rogstad D. H., Rougoor G. W., Whiteoak J. B., 1967, ApJ, 150, 9
- Sasaki et al. (1990) Sasaki M., Ohta K., Saito M., 1990, PASJ, 42, 361
- Schaerer et al. (1999) Schaerer D., Contini T., Pindao M., 1999, A&A, 136, 35
- Schmitt et al. (2006) Schmitt H. R., et al., 2006, ApJS, 164, 52
- Seaquist & Bignell (1978) Seaquist E. R., Bignell R. C., 1978, ApJ, 226, L5
- Sramek (1975) Sramek R., 1975, AJ, 80, 771
- Srivastava et al. (2011) Srivastava S., Kantharia N. G., Srivastava D. C., 2011, JAA, 32, 465
- Swarup et al. (1991) Swarup G., Ananthakrishnan S., Kapahi V. K., Rao A. P., Subrahmanya C. R., Kulkarni V. K., 1991, Current Science, Vol. 60, NO.2/JAN25, P. 95, 1991, 60, 95
- Tabatabaei et al. (2007) Tabatabaei F. S., Beck R., Krügel E., Krause M., Berkhuijsen E. M., Gordon K. D., Menten K. M., 2007, A&A, 475, 133
- Tacconi & Young (1985) Tacconi L. J., Young J. S., 1985, ApJ, 290, 602
- Taylor et al. (1995) Taylor C. L., Brinks E., Grashuis R. M., Skillman E. D., 1995, ApJS, 99, 427
- Theis & Kohle (2001) Theis C., Kohle S., 2001, A&A, 370, 36
- Thompson et al. (2006) Thompson T. A., Quataert E., Waxman E., Murray N., Martin C. L., 2006, ApJ, 645, 186
- Thronson et al. (1987) Thronson Jr. H. A., Hunter D. A., Telesco C. M., Decher R., Harper D. A., 1987, ApJ, 317, 180
- Thuan & Martin (1981) Thuan T. X., Martin G. E., 1981, ApJ, 247, 823
- Valls-Gabaud (1998) Valls-Gabaud D., 1998, PASA, 15, 111
- van Woerden et al. (1975) van Woerden H., Bosma A., Mebold U., 1975, in La Dynamique des Galaxies Spirales, ed. L. Weliachew (Paris: Editions du Centre National de la Recherche Scientifique), 483
- Walter et al. (2001) Walter F., Taylor C. L., Hüttemeister S., Scoville N., McIntyre V., 2001, AJ, 121, 727
- Yun et al. (1994) Yun M. S., Ho P. T. P., Lo K. Y., 1994, Nature, 372, 530