Vacuum-UV absorption spectroscopy of interstellar ice analogs. Isotopic effects.
Abstract
This paper reports the first measurements of solid-phase vacuum-ultraviolet (VUV) absorption cross sections of heavy isotopologues present in icy dust grain mantles of dense interstellar clouds and cold circumstellar environments. Pure ices composed of D2O, CD3OD, 13CO2, and 15N15N were deposited at 8 K, a value similar to the coldest dust temperatures in space. The column density of the ice samples was measured in situ by infrared spectroscopy in transmittance. VUV spectra of the ice samples were collected in the 120-160 nm (10.33-7.74 eV) range using a commercial microwave discharged hydrogen flow lamp as the VUV source. Prior to this work, we have recently submitted a similar study of the light isotopologues (Cruz-Diaz et al. 2013a; Cruz-Diaz et al. 2013b). The VUV spectra are compared to those of the light isotopologues in the solid phase, and to the gas phase spectra of the same molecules. Our study is expected to improve very significantly the models that estimate the VUV absorption of ice mantles in space, which have often used the available gas phase data as an approximation of the absorption cross sections of the molecular ice components. We will show that this work has also important implications for the estimation of the photodesorption rates per absorbed photon in the ice.
keywords:
interstellar ice analogs – VUV-absorption cross section.1 Introduction
After molecular hydrogen (H2), the molecules H2O, CO, CO2, and CH3OH, are among the most abundant in the interstellar medium, as it has been inferred from observations of the gas and solid phase (Mumma & Charnley 2011, and references therein). The main elements, and their corresponding isotopes, which compose most volatile molecules in the interstellar medium, are H:D, 12C:13C, 14N:15N, and 16O:17O:18O.
Deuterium enrichment can be the result of low temperature gas-grain reactions because of the differences in zero-point energies between deuterated and non-deuterated species (Wilson et al. 1973). Observation toward prestellar cores indicates, in gas phase, that abundances of singly deuterated molecules are typically higher than the cosmic atomic D/H ratio of 1.5 10-5(Linsky 2003), also, doubly and triply deuterated molecules have been observed with D/H ratios reaching 30 % for D2CO and 3 % for CD3OH (see, Ceccarelli et al. 1998; Loinard et al. 2002; Parise et al. 2004; Ratajczak et al. 2009). Deuterated methanol molecules were detected in the gas phase toward low-mass class 0 protostars with abundances up to about 60 % relative to CH3OH (Parise et al. 2006). D2O has been detected toward the solar-type protostar IRAS 16293-2422 (Butner et al. 2007; Vastel et al. 2010). Roberts (2003) showed that the multiply deuterated isotopologues of H3+ can efficiently transfer deuterons to other neutral molecules in very cold ( 20 K) gas depleted of its CO (because the CO molecules are frozen onto refractory dust grain mantles).
Isotopic substitution often alters the chemical and physical properties of atoms and molecules, resulting in differences in absorption spectra and reaction rates. Therefore, measurements of the isotopic compositions of various species can be used to interpret the physico-chemical histories and the chemical reaction pathways in these environments. In particular, isotope effects in the non-dissociative photoionization region of molecular nitrogen play an important role in isotopic fractionation in planetary atmospheres and other environments (e.g., interstellar molecular clouds, the solar nebula, and in the atmospheres of Earth, Mars, and Titan) in which N2 and VUV radiation are present (see, Croteau et al. 2011, and references therein).
Carbon dioxide is an important constituent of quiescent and star forming molecular clouds (Gerakines et al. 1999, and references therein). It is primarily present in the solid state (van Dishoeck et al. 1996). The 13CO2 isotope has been detected with a two orders of magnitude lower abundance with respect to CO2 (d’Hendecourt et al. 1996). The stretching band of 13CO2 is an independent and sensitive probe of the ice mantle composition (Boogert et al. 2000, and references therein). Studies in the gas phase have shown that the 12C/13C ratio increases with Galacto-centric radius (Wilson & Rood 1994; Keene et al. 1998). In the solid phase, the behavior of this ratio agrees with the gas phase studies (Boogert et al. 2000). Also, determination of this ratio is an important input for evolutionary models of the Galaxy, since 12C is produced by Helium burning by massive stars, which can be converted to 13C in the CNO cycle of low- and intermediate-mass stars at later times (Boogert et al. 2000).
The average cross section for a certain spectral range are useful when there is no information (flux, photodesorption rate) for each specific wavelength within that range. An example are the photodesorption rate values reported in the literature (e.g., Öberg et al. 2007, 2009; Muñoz Caro et al. 2010), which correspond to the full continuum emission spectrum of the hydrogen VUV lamps (an analog of the secondary UV emission in dense clouds). To estimate the photodesorption rate per absorbed photon in that case, what is used is the average photon energy and the average VUV absorption cross section in the same range. In addition, these average VUV absorption cross sections allow comparison with previous works that estimated those average values in similar spectral ranges in an indirect way (i.e., with no use of VUV spectroscopy), see e.g, Cottin et al. (2003).
Heavy isotopologues, in the context of laboratory astrophysics, are often used to study ice photoprocessing and, in particular ice photodesorption experimentally, to avoid problems with contamination (e.g., 13CO, 15N2; see Oberg et al. 2007, 2009; Fayolle et al. 2013). In addition, it is interesting to search for differences in the absorption of these ices compared to those made of light isotopologues.
The estimation of the VUV-absorption cross sections of molecular ice components allows to calculate the photon absorption of icy grains in that range. In addition, the VUV-absorption spectrum as a function of photon wavelength is required to study the photo-desorption processes over the full photon emission energy range.
It is therefore important to study the physical and chemical properties of molecules containing heavy isotopes. This study focusses on the isotopic effects observed in the vacuum-ultraviolet (VUV) absorption spectra of three of the most abundant inter- and circumstellar species in the solid phase: H2O, CH3OH, and CO2. Among the possible isotopologues, the fully deuterated ones were selected, D2O and CD3OD, in addition to 13CO2. Also 15N15N, henceforth abbreviated as 15N2, was included in our study to explore the isotopic effects in a homonuclear diatomic molecule that was also observed in space (Bergin et al. 2002; Belloche & André 2003). Two recent papers report the VUV absorption cross sections of the light isotopologues in the ice (Cruz-Diaz et al. 2013a, 2013b), henceforth referred to as Papers I and II, respectively). The data in Paper I and II were used for comparison to this work. In addition, the VUV absorption spectra of the same molecules in the gas phase were also adapted to illustrate the differences between the gas and the solid phase samples.
2 Experimental protocol
The measurements were conducted using the Interstellar Astrochemistry Chamber (ISAC). This set-up and the standard experimental protocol were described in detail in Muñoz Caro et al. (2010). ISAC mainly consists of an ultra-high-vacuum (UHV) chamber, with pressure typically in the range P = 3-4.0 10-11 mbar at room temperature, where an ice layer is made by deposition of a gas species onto a cold finger at 8 K. The low temperature is achieved by means of a closed-cycle helium cryostat. The ice sample can be either UV-irradiated or warmed up to room temperature. The evolution of the solid sample was monitored with in situ Fourier transform infrared (FTIR) spectroscopy in transmittance and VUV spectroscopy. The chemical compounds used for the experiments described in this paper were: D2O(liquid), Cambridge Isotope Laboratories, Inc (C.I.L.) 99.9%; CD3OD(liquid), C.I.L. 99.8%; 13CO2(gas), C.I.L. 99.0%; and 15N2(gas), C.I.L. 98.0%.
The deposited ice layer was VUV irradiated using a microwave discharged hydrogen flow lamp (MDHL), from Opthos Instruments. The source has a UV-flux of cm-2 s-1 at the sample position, measured by CO2 CO actinometry, see Muñoz Caro et al. (2010). The Evenson cavity of the MDHL is refrigerated with air. The VUV spectrum was measured routinely in situ during the experiments with the use of a McPherson 0.2 meter focal length VUV monochromator (Model 234/302) with a photomultiplier tube (PMT) detector equipped with a sodium salicylate window, optimized to operate from 100-500 nm (11.27-2.47 eV), with a spectral resolution of 0.4 nm. The characterization of the MDHL spectrum was previously reported (Chen et al. 2010; Paper I) and was discussed in more detail by Chen et al. (2013).
3 VUV spectroscopy
VUV absorption cross sections were obtained for pure ices composed of D2O, CD3OD, 13CO2, and 15N2. These measurements were performed following the procedure described in Paper I and summarized below. The column density of the deposited ice was calculated using FTIR spectroscopy in transmittance, according to the formula
| (1) |
where is the column density of the ice, the optical depth of the band, the wavenumber differential in cm-1, and is the band strength in cm molecule-1. The VUV absorption cross section was estimated according to the Beer-Lambert law
| (2) |
where is the transmitted intensity for a given wavelength , the incident intensity, is the column density in cm-2 obtained using eq. 1, and is the VUV absorption cross section in cm2.
For each ice spectrum a series of three measurements was performed: i) the emission spectrum of the VUV-lamp was measured, to monitor the intensity of the main emission bands, ii) the emission spectrum transmitted by the MgF2 substrate window was measured, to monitor its transmittance, and iii) the emission spectrum transmitted by the substrate window with the deposited ice on top was measured. The absorption spectrum of the ice corresponds to the spectrum of the substrate with the ice after subtraction of the bare MgF2 substrate spectrum.
A priori, the VUV absorption cross section of the ice was not known. Therefore, several measurements for different values of the initial ice column density were performed to improve the spectroscopy. Table 1 provides the infrared band positions and band strengths of D2O, CD3OD, and 13CO2 used to estimate the column density. Solid 15N2 does not display absorption features in the mid-infrared, therefore the column density of 15N2 was thus measured using the expression
| (3) |
where is the density of the ice, see Table 1, is the molar mass of the molecule, is the Avogadro constant (6.022 1023 mol-1), and is the ice thickness in cm. The latter was estimated following the classical interfringe relation
| (4) |
where is the refractive index of the ice at deposition temperature, and is the wavenumber difference between two adjacent maxima or minima of the fringes observed in the infrared spectrum of the ice.
No IR band strength values were found in the literature for the D2O and CD3OD species. These values were therefore calculated using eqs. 4, 3, and 1. Refractive indices of solid H2O, CH3OH, and N2 were used as an approximation (1.30, 1.39, and 1.21, respectively, see Mason et al. 2006, Hudgins et al. 1993, and Satorre et al. 2008). Error values for the column density in Table 1 have been estimated taking into account the error in the calculation of the column density and the column density decrease by UV irradiation during the VUV spectral acquisition.
The main emission peaks of the MDHL fall at 121.6 nm (Lyman-), 157.8 nm, and 160.8 nm (molecular H2 bands). These peaks are thus also present in the secondary VUV photon spectrum generated by cosmic rays in dense interstellar clouds and circumstellar regions where molecular hydrogen is abundant (Gredel et al. 1989). For this reason, the VUV absorption cross section values measured at these wavelengths are provided for each molecule in the following sections.
The VUV absorption cross section spectra of D2O, CD3OD, 13CO2, and 15N2 ices were fitted using the sum of two or more Gaussian profiles using an in-house IDL code. These fits correspond to the lowest values. Table 2 summarizes the Gaussian profile parameters used to fit the spectra of the different ice compositions deposited at 8 K.
| Molecule | Centre | FWHM | Area |
|---|---|---|---|
| [nm] | [nm] | [ 10-17 cm2 nm] | |
| D2O | 120.0 | 17.6 | 7.9 |
| 141.5 | 16.2 | 9.5 | |
| 151.2 | 9.9 | 1.2 | |
| CD3OD | 120.2 | 25.9 | 26.7 |
| 145.7 | 20.9 | 11.3 | |
| 160.5 | 11.5 | 1.4 | |
| 13CO2 | 115.3 | 4.2 | 1.8 |
| 126.4 | 9.9 | 2.1 | |
| 15N2 | 115.5 | 0.5 | 0.8 |
| 117.0 | 1.1 | 1.5 | |
| 119.2 | 1.1 | 1.7 | |
| 120.8 | 1.1 | 2.8 | |
| 123.0 | 1.1 | 3.4 | |
| 123.5 | 1.6 | 1.0 | |
| 125.0 | 0.7 | 3.2 | |
| 126.1 | 1.6 | 0.6 | |
| 127.4 | 0.7 | 3.4 | |
| 128.5 | 0.9 | 1.3 | |
| 129.9 | 0.8 | 1.9 | |
| 130.8 | 0.8 | 2.4 | |
| 132.1 | 0.7 | 0.7 | |
| 133.2 | 0.8 | 3.2 | |
| 134.8 | 1.1 | 0.3 | |
| 136.2 | 0.5 | 4.9 | |
| 138.0 | 2.1 | 0.1 | |
| 139.0 | 0.8 | 2.4 | |
| 142.2 | 0.6 | 4.6 | |
| 145.4 | 1.8 | 3.8 |
3.1 Solid deuterium oxide
The VUV absorption cross section spectrum of D2O ice (black trace) and H2O ice (blue trace) are displayed in Fig. 1. Cheng et al. (2004) and Chung et al. (2001) report the VUV absorption cross sections of D2O and H2O in the gas phase, depicted in Fig. 1 as red and violet traces, respectively. The transition 4a1:Ã1B 1b1:X̃1A1 accounts for the absorption in the 145-180 nm region, which reaches its maximum at 166.0 nm for D2O and at 167.0 nm for H2O in the gas phase, this accounting for a shift of 1 nm. The same transition was observed for both solid D2O and H2O, with bands centered at 141.4 nm and 142.6 nm, respectively. This corresponds to a shift of 24.6 0.4 nm for D2O and 24.4 0.4 nm for H2O ices compared to the gas phase. Solid D2O presents a maximum in the VUV absorption cross section with a value of 5.8 10-18 cm-2, a value close to the one estimated for solid H2O, 6.0 10-18 cm-2. The portion of the band in the 120-132 nm range (attributed to the transition B̃1A1 X̃1A1, according to Lu et al. (2008)) is present in the four spectra, but due to the MgF2 window cutoff in our set-up it was not possible to determine the position of the maximum for this band in the solid samples.
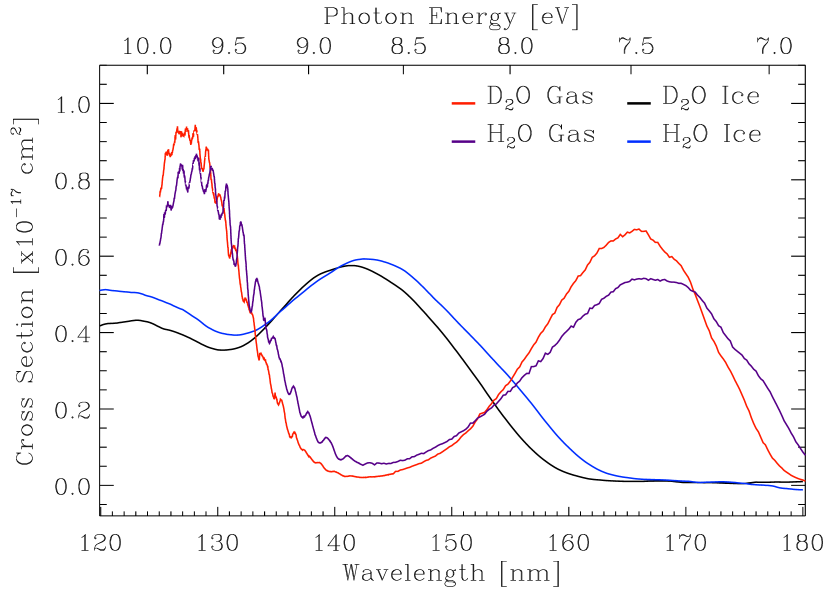
The average VUV absorption cross section of solid D2O has a value of 2.7 10-18 cm2 in the 120-165 nm (10.35-7.51 eV) spectral region, i.e. lower than the 3.4 10-18 cm2 value of solid H2O. The total integrated VUV absorption cross section of solid D2O is 1.2 10-16 cm2 nm (8.6 10-18 cm2 eV) in the same spectral region, which again is low compared to solid H2O, 1.8 10-16 cm2 nm. The VUV absorption cross sections of D2O ice at 121.6 nm, 157.8 nm, and 160.8 nm are, respectively, 4.4 10-18 cm2, 0.8 10-18 cm2, and 0.3 10-18 cm2, i.e. lower than the values for H2O, respectively, 5.2 10-18 cm2, 1.7 10-18 cm2, and 0.7 10-18 cm2. The VUV absorption cross section of D2O in the gas phase has an average value of 3.4 10-18 cm2. D2O gas data have been also integrated in the 120-180 nm range, giving a value of 1.9 10-16 cm2 nm (1.1 10-17 cm2 eV). Both of them, the average and the integrated values, are larger than the ones obtained for solid D2O. The VUV absorption cross sections of gas phase D2O at 157.8 nm and 160.8 nm are, respectively, 4.0 10-18 cm2 and 5.5 10-18 cm2, also larger than the solid phase measurements. No gas phase data was found for the Ly- wavelength (121.6 nm).
3.2 Solid deuterated methanol
Fig. 2 shows the VUV absorption cross section of solid CD3OD, black trace, and solid CH3OH, blue trace, as a function of wavelength and photon energy. Cheng et al. (2002) reported the VUV absorption cross section spectra of CD3OD (red trace) and CH3OH (violet trace) in the gas phase, see Fig. 2. The VUV spectra corresponding to the gas phase contain plenty of features, while solid VUV spectra are very smooth, with no distinct local maxima. Paper I reports a bump centered at 146.9 nm (associated to the 21A” X1A’ molecular transition) for solid CH3OH; this band is centered at 145.7 nm for solid CD3OD. These maxima were estimated using Gaussian fits of the bands. The peaks centered at 146.5 nm and 159.3 nm for gas phase CD3OD are shifted to shorter wavelengths with respect to gas phase CH3OH (peaks centered at 146.8 nm and 160.4 nm, respectively). The MgF2 window cutoff in our setup, near 114 nm, only allowed the detecting of a fraction of the broad band corresponding to the 31A” X1A’ molecular transition. This band is present in the four spectra of Fig. 2.
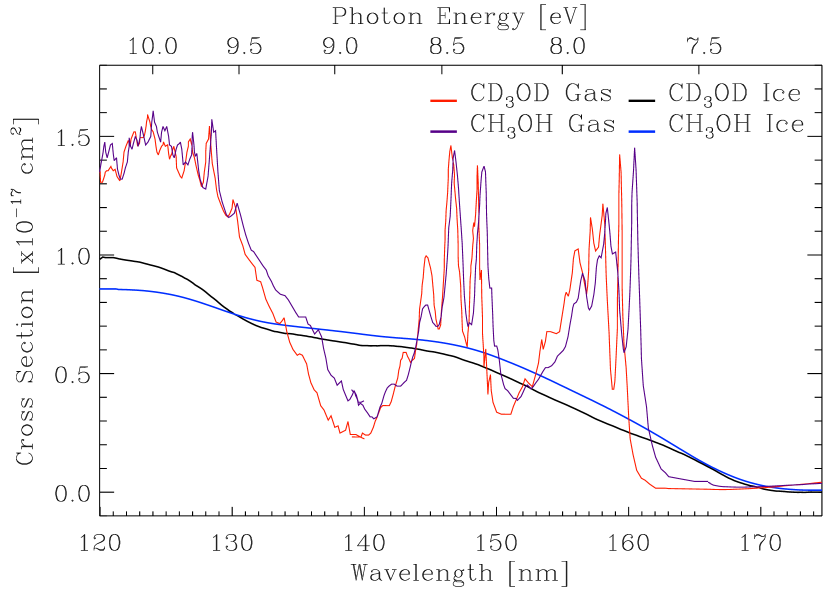
The average VUV absorption cross section of solid CD3OD has a value of 4.6 10-18 cm2 in the 120-175 nm (10.33-7.04 eV) spectral region, quite similar to the solid CH3OH value of 4.4 10-18 cm2. The total integrated VUV absorption cross section of solid CD3OD is 2.6 10-16 cm2 nm (1.7 10-17 cm2 eV) in the same spectral region, very close to the solid CH3OH value, 2.7 10-16 cm2 nm, reported in Paper I. At the Ly- wavelength, 121.6 nm, the VUV absorption cross section of CD3OD ice is higher than the value corresponding to CH3OH ice (9.7 10-18 cm2 and 8.6 10-18 cm2, respectively). For the H2 molecular transitions at 157.8 nm and 160.8 nm, the VUV absorption cross sections of CD3OD ice (2.9 10-18 cm2 and 2.2 10-18 cm2) are lower than the values corresponding to CH3OH ice (3.8 10-18 cm2 and 2.9 10-18 cm2). The VUV absorption cross section of CD3OD in the gas phase has an average value of 8.6 10-18 cm2, almost twice larger than the value measured for the solid phase. CD3OD gas data were integrated in the 120-175 nm range giving a value of 3.4 10-16 cm2 nm (2.2 10-17 cm2 eV), i.e, larger than the VUV absorption cross section (2.6 10-16 cm2 nm) of solid CD3OD. The VUV absorption cross sections of CD3OD gas at 121.6 nm, 157.8, and 160.8 nm are, respectively, 13.4 10-18 cm2, 10.8 10-18 cm2, and 0.6 10-18 cm2, which are also larger than the ice phase measurements provided above, except for the 160.8 nm value.
3.3 Solid carbon-13C dioxide
The VUV absorption cross section of 13CO2 ice as a function of the wavelength and photon energy is shown in Fig. 3, black trace. It is similar to the one reported for CO2 ice in Paper II, depicted as a blue trace in Fig. 3. A broad band centered at 9.8 eV, assigned to the transition, is observed in these spectra. Paper II reports a vibrational structure in the 120.0-133.0 nm range for CO2; these weak features were poorly resolved in our spectrometer. Fig. 3 inlet shows the same bands for 13CO2 ice. For comparison, the dotted lines in the inlet represent the five band positions reported in Paper II for solid CO2.
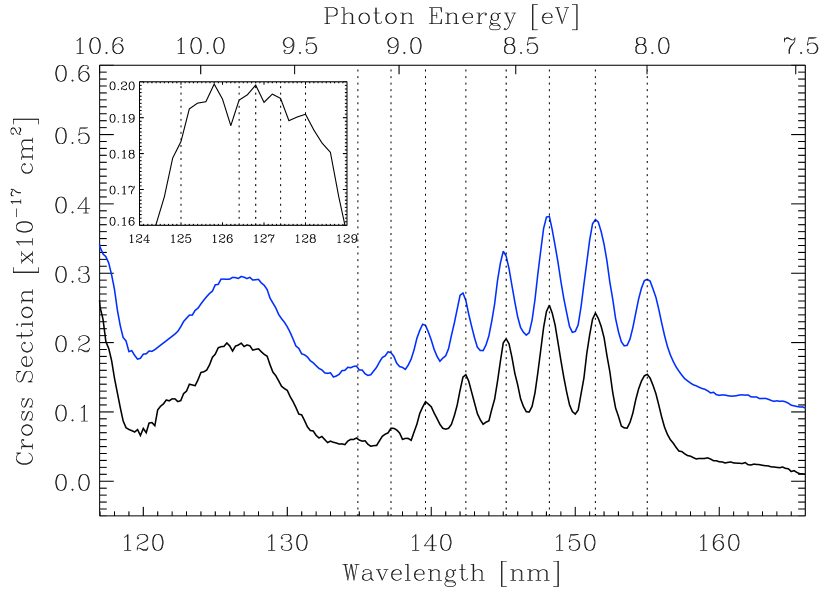
All the discrete bands observed beyond 130 nm correspond to the absorption of photo-produced CO in the CO2 ice matrix. It was therefore not possible to measure the spectrum of pure CO2 ice with our experimental configuration. For this, a synchrotron radiation source is required, see Paper II and ref. therein. Similarly, the bands of photo-produced 13CO are present in the spectrum of 13CO2 ice, see Fig. 3. The proportion of 13CO relative to the deposited 13CO2 is around 14% in this experiment, as it was inferred from integration of the infrared absorption features of 13CO2 at 2283 cm-1 and 13CO at 2092 cm-1. Features centered at 155.0 nm, 151.4 nm, 148.2 nm, 145.2 nm, 142.4 nm, 139.6 nm, 137.2 nm, and 135.0 nm correspond to the photoproduced 13CO. The measured VUV spectrum corresponds therefore to a mixture of 13CO2 and 13CO. An important effect is the shift of the 13CO features in this experiment with respect to those of pure CO ice, but the spectrum of 13CO was not available for comparison to our results. This issue was discussed in Paper II for CO in the CO2 ice matrix, which was compared to pure CO ice. Such ice mixture effects have important implications for the VUV absorption of ice in space, where the molecular components are either mixed or layered in the ice mantles.
Upper limits for the average and the total integrated VUV absorption cross sections were calculated after subtraction of the 13CO spectrum; they are, respectively, 6.9 10-19 cm2 and 3.1 10-17 cm2 nm (2.3 10-18 cm2 eV). These values are comparable with the CO2 values reported in Paper II, 6.7 10-19 cm2 and 2.6 10-17 cm2 nm for the average and the total integrated VUV absorption cross sections, respectively. The VUV absorption cross section of 13CO2 ice at 121.6 nm is 1.1 10-18 cm2, very close to the 1.0 10-18 cm2 value for CO2. No previous gas or solid phase VUV spectra of 13CO2 were found in the literature.
3.4 Solid nitrogen-15N2
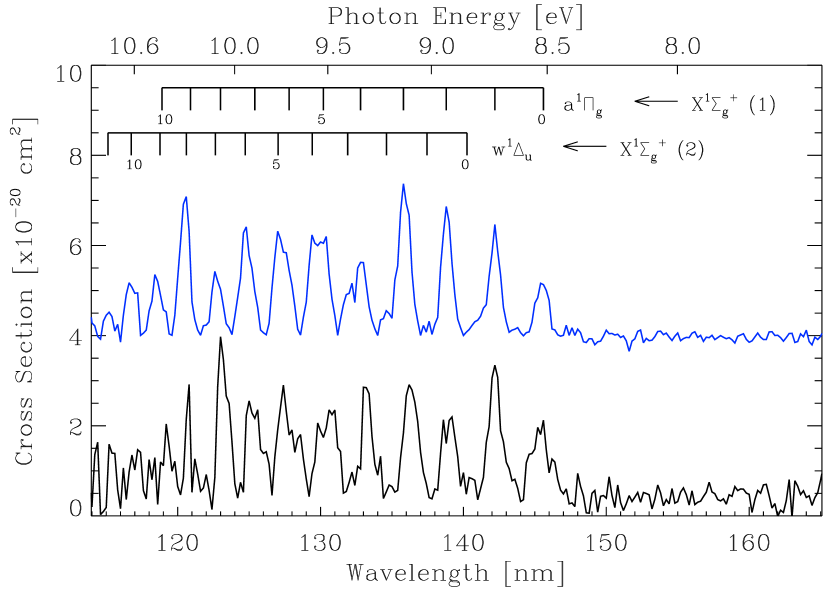
The VUV absorption cross section of 15N2 ice, black trace in Fig. 4, analogous to that of N2, blue trace, is very low. For this reason, a deposition of about = 4009 410 1015 molecules cm-2 was required to detect the absorption features. Paper II summarizes the complete study of solid and gas phase N2. Solid 15N2 should present the same vibrational structure as solid N2 in the 114-147 nm (10.87-8.43 eV) region. The two systems (attributed to a X and w X transitions) can be appreciated in Fig. 4. The noise level in these measurements was high compared to the other ices studied, due to the low intensity of the bands and the detection limit of the VUV spectrometer. Some features are shifted to a shorter wavelengths above the 0.4 nm resolution of our measurements, but these shifts did not exceed 0.8 nm.
The average VUV absorption cross section of 15N2 ice has a value of 8.7 10-21 cm2, i.e. higher than 7.0 10-21 cm2 calculated for N2 in Paper II. The total integrated VUV absorption cross section of 15N2 ice has a value of 3.0 10-19 cm2 nm (2.2 10-20 cm2 eV) in the 114.6-146.8 nm (10.82-8.44 eV) spectral region, which can be compared to 2.3 10-19 cm2 nm for N2 ice. The VUV-absorption cross section spectrum of 15N2 is not as well resolved as in other works but this should not affect the VUV-absorption cross section scale that we provide, because no integration of the band area is involved, see Paper II. The VUV absorption cross section at Ly- (121.6 nm) is very low, we estimated an upper limit value of 1.5 10-21 cm2. There are no observable VUV absorption features at the molecular hydrogen band wavelengths (157.8 and 160.8 nm). No gas or solid phase VUV spectra of 15N2 were found in the literature.
4 Astrophysical implications and final conclusions
The absorption of energetic photons by gas phase molecules and dust grains in various space environments is a key issue in astrophysics. If the absorption cross sections are known for the photon wavelength range of interest, a quantitative estimation of the photon absorption and the photon penetration depth in the absorbing material can be attained.
The absorbing ice column density of a species in the solid phase, can be calculated from the VUV absorption cross section following
| (5) |
where is the transmitted intensity for a given wavelength , the incident intensity, is the absorbing column density in cm-2, and is the cross section in cm2. Table 3 summarizes the absorbing column densities of the ice species for an absorbed photon flux of 95% and 99% using the cross section value at Ly-, the average cross section in the 120-160 nm range, and the maximum cross section in the same range. The values corresponding to the lighter isotopologues are reported in Papers I and II.
| 95% photon absorption | 99% photon absorption | |||||
| species | Ly- | Avg. | Max. | Ly- | Avg. | Max. |
| (1017 molecule cm-2) | (1017 molecule cm-2) | |||||
| D2O | 6.8 | 11.1 | 5.3 | 10.5 | 17.1 | 8.1 |
| CD3OD | 3.1 | 6.5 | 3.1 | 4.7 | 10.0 | 4.7 |
| 13CO2 | 27.2 | 43.7 | 12.0 | 41.8 | 67.1 | 18.4 |
| 15N2 | 19971 | 3443 | 749 | 30701 | 5293 | 1151 |
| H2O | 5.8 | 8.3 | 4.9 | 8.9 | 13.0 | 7.7 |
| CH3OH | 3.5 | 5.7 | 3.4 | 5.4 | 8.7 | 5.3 |
| CO2 | 29.3 | 44.5 | 15.1 | 45.1 | 68.4 | 23.3 |
| N2 | 29957 | 4280 | 881 | 46052 | 6579 | 1354 |
A larger column density of solid D2O ice is needed to reach 95 and 99% of the total photon absorption with respect to the solid H2O values, due to its lower VUV absorption cross section. The same holds for solid CD3OD and CH3OH, with the exception of the Avg. value, which is higher in the solid CD3OD sample. For solid 13CO2 a larger column density is needed to reach 95 and 99% of the total photon absorption with respect to solid CO2. In the other hand, within the significant errors associated to their VUV absorption cross section measurements, 15N2 ice seems to be similar or slightly more absorbing than N2. For the first time, we report the VUV absorption cross section as a function of photon energy for D2O, CD3OD, 13CO2, and 15N2 in the solid phase at 8 K.
All four molecules present a shift to shorter wavelengths in their VUV spectrum with respect to their corresponding light isotopologues. Deuterated species experience the largest blue-shift among the molecules studied. This could be expected from previous works on deuterated species in the gas phase, but the shifts measured in the solid phase were larger in comparison. The average and the integrated VUV absorption cross section values are close for the different isotopologues. The relatively small variations between isotopologues may only play a minor role in the absorption of VUV radiation in space.
Large differences were found between the VUV absorption cross section spectra of solid and gas phase species (Papers I, II, and ref. therein; this work). This has important implications for the absorption of VUV photons in dense clouds and circumstellar regions.
There is a clear correspondence between the photodesorption rates measured at different photon energies and the VUV absorption spectrum for the same photon energies. This indicates that photodesorption of some ice species like N2 and CO is mainly driven by a desorption induced by electronic transition (DIET) process (Fayolle et al. 2011, 2013). Unfortunately, the N2 and 15N2 ice absorption spectra at photon energies higher than 12.4 eV, where photodesorption is efficient, have not been measured. But the low photodesorption rates measured at energies below 12 eV by Fayolle et al. (2013) (no more than 4 10-3 molecules per incident photon for 15N2 ice) is compatible with its low ice absorption cross section, reported here for the same spectral range. In addition, the observed photodesorption occurs in the same spectral range where the absorption bands of Fig. 4 are present. The lower photodesorption reported by Fayolle et al. 2013 for the Ly- wavelength at 121.6 nm, 1.5 10-3 molecules per incident photon, coincides with a low absorption in Fig. 4, and the maximum in the photodesorption occurs approximately at 135 nm, where the most intense absorption band is present, see Fig. 4. The photodesorption rate per absorbed photon in that range, , can be estimated as follows
| (6) |
where
and is the total photon flux emitted (Fayolle et al. 2013 reports 3-11.5 1012 photons cm-2 s-1, in our experiments this flux is about 2.0 1014 photons cm-2 s-1), is the total photon flux absorbed by the ice, is the photon flux emitted at wavelength , is the VUV absorption cross section at the same wavelength, and is the column density of the ice sample. corresponds to a photodesorption rate of 4 10-3 molecules per incident photon in the spectral range below 12.4 eV for = 60 1015 cm-2 (60 monolayers) from Fayolle et al. (2013), while the average absorption cross section for 15N2 ice that we measured in that range is = 8.7 1.9 10-21 cm2. The resulting photodesorption rate is thus quite high, 7.7 molecules per absorbed photon, meaning that a very small fraction of the incident photons are absorbed in the ice but each absorbed photon led to the photodesorption of about 7.7 molecules on average (this in fact is the maximum value because Fayolle et al. (2013) measured photodesorption rates, , that do not exceed 4 10-3 molecules per incident photon).
In the case of CO ice deposited also at 15 K, it was found that only the photons absorbed in the top 5 monolayers led to photodesorption with a rate of 2.5 CO molecules per absorbed photon in those 5 monolayers (based on Muñoz Caro et al. 2010, but using an average cross section of CO ice of 4.7 0.4 10-18 cm2 adapted from Paper I). This value for CO ice is about 3.1 times lower than the maximum estimated above for the 60 ML of the 15N2 ice experiment of Fayolle et al. (2013). A more direct comparison between N2 and CO ice photodesorption could be made if the number of N2 monolayers closer to the ice surface that truly contribute to the photodesorption was known (in the case of CO ice these are 5 monolayers, this value has not been estimated for N2 ice and therefore the values of and correspond to the total ice column density of 60 monolayers in the experiment of Fayolle et al. 2013). With this uncertainty still remaining, we can conclude that if the VUV absorption cross section of each specific ice composition is taken into account, it is possible to know what is the efficiency of the photodesorption per absorbed photon; in the case of N2 and CO, for VUV photon energies that do not lead to direct dissociation of the molecules in the ice, these values are higher than unity. The values of >1 and the fact that the photons absorbed in ice monolayers deeper than the top monolayers (up to 5 for CO) can lead to a photodesorption event, indicate that the excess photon energy is transmitted to neighboring molecules in the ice within a certain range (this range may correspond to about 5 monolayers in the case of CO ice, e.g., Rakhovskaia et al. 1995; Öberg et al. 2007, 2009; Muñoz Caro et al. 2010); if a molecule on the ice surface receives sufficient energy, it may photodesorbs (Muñoz Caro et al. 2010).
It should also be noted that ice photodesorption experiments performed with a continuum emission source (like the MDHL), mimicking the secondary VUV field in dense cloud interiors, can lead to photodesorption rates that are intrinsically different from those obtained in experiments using a monochromatic source (generally provided by a synchrotron beam), we refer to Chen et al. (2013) for the case of CO ice photodesorption.
This work, along with Papers I and II, provides essential data to attempt a more quantitative study of VUV absorption of molecules forming ice mantles, and the photon processes involved: photo-processing leading to destruction of molecules and formation of new species, and photo-desorption of molecules in the ice that are ejected to the gas phase.
Acknowledgments
This research was financed by the Spanish MICINN under projects AYA2011-29375 and CONSOLIDER grant CSD2009-00038. This work was partially supported by NSC grants NSC99-2112-M-008-011-MY3 and NSC99-2923-M-008-011-MY3, and the NSF Planetary Astronomy Program under Grant AST-1108898.
References
- Belloche & André (2003) Belloche A., André P., 2003, ApJ, 593, 906.
- Bergin et al. (2002) Bergin E.A., Langer W.D., Goldsmith, P.F., 2002, ApJ, 570, L101.
- Boogert et al. (2000) Boogert A.C.A., Ehrenfreund P., Gerakines P.A., Tielens A.G.G.M., Whittet D.C.B. et al., 2000, A&A, 353, 349.
- Butner et al. (2007) Butner H.M., Charnley S.B., Ceccarelli C., Rodgers S.D., Pardo J.R. et al., 2007, ApJ, 659, L137.
- Ceccarelli et al. (1998) Ceccarelli, C., Castets, A., Loinard, L., Caux, E., & Tielens, A. G. M.. A&A, 1998, 338, L43.
- Chen et al. (2010) Chen Y.-J., Chu C.C., Lin Y.C., Yih T.S., Wu C.Y.R. et al., Adv. Geosci., 2010, 25, 259.
- Chen et al. (2013) Chen Y.-J., Chuang K.Y., & Muñoz Caro G.M., et al., ApJ, 2013, 781, 15
- Cheng et al. (2004) Cheng B.-M., Chung C.-Y., Bahou M., Lee Y.-P., Lee L.C. et al., 2004, Journal of Chemical Physics, 120, 224.
- Cheng et al. (2002) Cheng B.-M., Bahou M., Chen W.C., Yui C.H., Lee Y.-P., Lee, L.C., 2002, Journal of Chemical Physics, 117, 1633.
- Chung et al. (2001) Chung C.-Y., Chew E.P., Cheng B.-M., Bahoub M., Lee Y.-P., 2001, Nuclear Instruments and Methods in Physics Research A, 467-468, 1572.
- Cottin et al. (2003) Cottin, H., Moore, M.H., & Bénilan, Y., 2003, ApJ, 590, 874.
- Cruz-Diaz et al. (2013a) Cruz-Diaz G.A., Muñoz Caro G.M., Chen Y. J., 2013a, A&A, in press.
- Cruz-Diaz et al. (2013b) Cruz-Diaz G.A., Muñoz Caro G.M., Chen Y. J., 2013b, A&A, in press.
- Ehrenfreund & van Dishoeck (1998) Ehrenfreund, P. & van Dishoeck, E. F., 1998, Adv. Space Res., 21, 15
- Fayolle et al. (2013) Fayolle E.C., Bertin M., Romanzin C., Poderoso H.A.M., Philippe L. et al., 2013, A&A, 556, A122.
- Fayolle et al. (2011) Fayolle E.C., Bertin M., Romanzin C., Michaut X., Öberg K.I. et al., 2011, ApJ Letters, 739, L36.
- Fuchs et al. (2006) Fuchs, G. W., Acharyya, K., Bisschop, S. E., et al., 2006, Faraday Discussions, 133, 331.
- Gerakines et al. (1995) Gerakines P., Schutte W.A., Greenberg J.M., van Dishoeck E.F., 1995, A&A, 296, 810.
- Goldsmith et al. (2011) Goldsmith, P. F., Liseau, R., Bell, T. A., et al., 2011, ApJ, 737, 96.
- Gredel et al. (1989) Gredel R., Lepp S., Dalgarno A., 1989, ApJ, 347, 289.
- Hudgins et al. (1993) Hudgins, D. M., Sandford, S. A., Allamandola, L. J., & Tielens, A. G. G. M., 1993, ApJSS, 86, 713.
- Hudson & Carter (1968) Hudson, R. D., & Carter, V. L. 1968, J. Opt. Soc. Am., 58, 227.
- Linsky (2003) Linsky, J. L., Space. Sci. Rev., 2003, 106, 49.
- Liseau et al. (2012) Liseau, R., Goldsmith, P. F., Larsson, B., Pagani, L., & Bergman, P., 2012., A&A, 541, A73.
- Loinard et al. (2002) Loinard, L., Castets, A., Ceccarelli, C., et al., Planet. Space Sci., 2002, 50, 1205.
- Lu et al. (2008) Lu H.C., Chen H.K., Cheng B.-M., Ogilvie J.F., 2008, Spectrochimica Acta Part A: Molecular and Biomolecular Spectroscopy, 71, 1485.
- Mason (2006) Mason, N. J., Dawes, A., Holton, P. D., et al. 2006, Faraday Discussions, 133, 311.
- Mumma & Charnley (2011) Mumma M.J., Charnley S.B., 2011, Annu. Rev. Astro. Astrophys, 49, 471.
- Meyer et al. (1998) Meyer, D. M., Jura, M., & Cardelli, J. A. 1998, ApJ, 493, 222-.
- Muñoz Caro et al. (2010) Muñoz Caro G.M., Jiménez-Escobar A., Martin-Gago J.A., Rogero C., Atienza C. et al., 2010, A&A, 522, A108.
- Öberg et al. (2007) Öberg K.I., Fuchs G.W., Awad Z. et al., 2007, ApJ, 662, L23.
- Öberg et al. (2009) Öberg K.I., van Dishoeck E.F., Linnartz H., 2009, A&A, 496, 281.
- Okabe (1978) Okabe, H. 1978, Photochemistry of small molecules, ed. John Wiley & Sons, New York.
- Parise et al. (2004) Parise B., Castets, A., Herbst, E., et al. A&A, 2004, 416, 159.
- Parise et al. (2006) Parise B., Ceccarelli C., Tielens A.G.G.M., Castets A., Caux E. et al., 2006, A&A, 453, 949.
- Pontoppidan et al. (2004) Pontoppidan, K. M., van Dishoeck, E. F., & Dartois, E. 2004, A&A, 426, 925
- Rakhovskaia et al. (1995) Rakhovskaia O., Wiethoff P., Feulner P., 1995, NIM B, 101, 169
- Ratajczak et al. (2009) Ratajczak, A., Quirico, E., Faure, A., Schmitt, B., & Ceccarelli, C., 2009, A&A, 496, L21.
- Roberts (2003) Roberts F., 2003, Space Science Reviews, 106, 87.
- Samson & Ederer (2000) Samson, J. A. R., & Ederer, D. L. 2000, Vacuum Ultaviolet Spectroscopy, ed. Elsevier Inc.
- Satorre et al. (2008) Satorre, M. Á., Domingo, M., Millán, C., et al., 2008, Planetary and Space Science, 56, 1748.
- Vastel et al. (2010) Vastel C., Ceccarelli C., Caux E., Coutens A., Cernicharo J. et al., 2010, A&A, 521, L31.
- Wilson et al. (1973) Wilson R.W., Penzias A.A., Jefferts K.B., Solomon P.M., 1973, ApJ, 179, L107.