Screening of Obstructive Sleep Apnea with
Empirical Mode Decomposition of Pulse Oximetry
Abstract
Detection of desaturations on the pulse oximetry signal is of great importance for the diagnosis of sleep apneas. Using the counting of desaturations, an index can be built to help in the diagnosis of severe cases of obstructive sleep apnea-hypopnea syndrome. It is important to have automatic detection methods that allows the screening for this syndrome, reducing the need of the expensive polysomnography based studies. In this paper a novel recognition method based on the empirical mode decomposition of the pulse oximetry signal is proposed. The desaturations produce a very specific wave pattern that is extracted in the modes of the decomposition. Using this information, a detector based on properly selected thresholds and a set of simple rules is built. The oxygen desaturation index constructed from these detections produces a detector for obstructive sleep apnea-hypopnea syndrome with high sensitivity () and specificity () and yields better results than standard desaturation detection approaches.
keywords:
empirical mode decomposition , pulse oximetry , sleep apnea.1 Introduction
Sleep disorders include more than frequent pathologies in adults and children [1]. Such disorders cause daytime sleepiness, affecting between and of the adult population of USA, and are an important cause of morbidity and mortality. As a result of this high prevalence, severe complications, and concomitant diseases in the non treated cases, there are very important associated costs [2]. The more common and important sleep pathology is the obstructive sleep apnea-hypopnea syndrome (OSAHS). This disorder is characterized by repetitive airflow reduction caused by an intermittent partial or complete upper airway obstruction during sleep. The main consequences of this disorder are sleep fragmentation, reduced blood oxygen saturation, and excessive daytime somnolence [3, 4, 5, 6]. According to recent studies [7, 8], the prevalence of OSAHS in a general population, without taking into account symptoms of sleepiness, has been estimated to be in a males and, when associated with these symptoms, it decreases to approximately in men and in women. It is worth to be mentioned that it is much higher, e.g. , in patients with cardiac or metabolic disorders than in the general population.
The current gold standard for the diagnosis of OSAHS is polysomnography (PSG). PSG is an overnight study made at a sleep center, in a quiet and dark room, that consists of simultaneous recording of electroencephalography (EEG), electrooculography (EOG), electromyography (EMG), electrocardiography (ECG), oxygen saturation (SpO2), oronasal airflow, thoracic and abdominal movement, body position, and other signals. PSG allows to estimate the apnea/hypopnea index (AHI) that is used as the primary index of OSAHS severity. PSG is supervised by a technician, and its analysis requires a tedious scoring, often by hand [9]. This study is cost intensive, its availability is limited, and only one study can be made per night.
As alternatives to PSG, several approaches have been proposed using cardiac, respiratory, and snore sounds [10, 11], pulse oximetry [3], ECG [12], nasal airway pressure [4, 13] and combinations of several signals [14]. These signals were studied by time-frequency analysis techniques [15], statistical approaches based on several ad hoc indexes [14], empirical mode decomposition [4, 13], information theory [3], linear and quadratic discriminants [10], and other methods. Unlike other signals for which the recording instrumentation is more complex, nocturnal pulse oximetry is a low-cost technique and it can be easily applied in outpatient studies with the purpose of screening of OSAHS. However, pulse oximetry requires more sophisticated processing tools to extract relevant information.
Empirical Mode Decomposition (EMD) is a complete data-driven signal analysis technique, that can be applied to nonstationary and nonlinear signals, proposed by Huang et al. [22] 111Details about EMD can be found in the Supplementary Material accompanying this paper.. EMD decomposes a signal into a usually small number of components known as Intrinsic Mode Functions (IMF) or modes. EMD was successfully used for the extraction of the respiratory signal from ECG [23], and for detecting apneas processing the nasal airflow signal [4] and even the ECG [24]. As an undesired effect, we can mention the problem known as “mode mixing”, where very similar oscillations are present in different modes. This is partially alleviated with noise-assisted EMD versions, as the Ensemble EMD [25] with very good results in voice processing [26], but with high computational cost and a residual noise in the reconstructed signal. More recent noise assisted versions overcome some of these problems [27, 28].
In this work, we present an algorithm based on EMD for detecting desaturations associated with sleep apnea/hypopnea in pulse oximetry signals. The purpose of this procedure is to estimate an index that behaves in a similar way than the classical apnea/hypopnea index derived from PSG, but using only information from oxygen desaturations measured by pulse oximetry. This will be done by decomposing the oximetry signal using EMD, identifying the particular modes where the information associated to desaturations appears more clearly, and using a set of properly chosen thresholds and simple rules to count each desaturation.
2 Materials
2.1 Oximetry Signal
2.1.1 SpO2 Signal Basis
Oximetry is the measurement of the percent saturation of oxygen in hemoglobin. The arterial oxygen saturation is commonly referred as SaO2. Pulse oximetry is a noninvasive estimation of the peripheral oxygen saturation (SpO2) based on the transmission, absorption, and dispersion of light as it passes through hemoglobin. The reading is obtained using a light sensor containing two sources of light (red and infrared) that are absorbed by hemoglobin and transmitted through tissues to a photodetector. Measurement of SpO2 is less accurate at low values, and saturation is generally taken as the lowest accurate reading. Typical technical specifications of pulse oximeters include a sampling rate of Hz, a resolution of , and an accuracy of in the range of to .
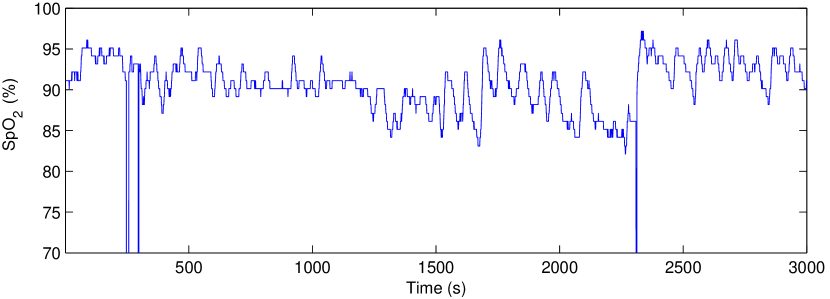
In Fig. 1 a SpO2 signal corresponding to a patient suffering OSAHS is shown. The range was limited to . Several characteristics of this signal are illustrated in this example. Typical disconnection errors are at , , and s (the value provided by the oximeter in these events is ). Examples of desaturation events can be observed at s and between and s, where sawtooth-like waveforms are present. Additionally, a low frequency tendency can be noticed in the segment shown.
2.1.2 SpO2 and OSAHS
A full PSG is required for the diagnosis of OSAHS. With these records, a specialized physician can accurately diagnose this syndrome, taking into account the number of complete and partial obstructions (apnea and hypopnea respectively) of breathing per hour of sleep. This quantity is known as the Apnea-Hypopnea Index (AHI) [29]. It is a very expensive study and the sleep laboratories are scarce, specially in developing countries.
The nocturnal transcutaneous pulse oximetry is used with increasing frequency for early screenings of OSAHS due to its low cost and simplicity. During obstructive apneas, oxygen desaturations are common, but they can be absent with hypopneas or in events with increased upper airway resistance [29]. In the first case, the desaturations show a typical sawtooth waveform with a rapid increase in SpO2 during or after the arousal. However, this increase is not as abrupt in hypopneas and the sawtooth pattern can be completely missing in central apneas.
An obstructive apnea/hypopnea event is characterized by a transient reduction or complete cessation of breathing. In the clinical practice apneas are not considered differently from obstructive hypopneas because these events have similar pathophysiology. To be considered as an apnea/hypopnea event, criterion 1 or 2, plus criterion 3 of the following must be fulfilled [30]:
-
1.
The amplitude of a valid signal related to the breathing must present a clear decrease () from its baseline. This baseline is defined as the mean amplitude of the signal in stable breathing and oxygenation in the 2 minutes preceding the onset of the event.
-
2.
A clear reduction in the amplitude of a validated measure of breathing during sleep that does not reach the previous criterion, but occurs with an oxygen desaturation greater or equal to or an arousal.
-
3.
The duration of the event is s or longer.
In this work, we are focused in detecting the blood oxygen desaturations, with the intention of identify events associated with criteria 2 and 3. Our interest lies in estimating an index with high sensitivity for OSAHS detection. However, as could be seen in Fig. 1, this is not an easy task for real SpO2 signals. There are many problems to be solved, as artifacts, quantization noise, baseline, etc.
2.2 The Sleep Heart Health Study Polysomnography Database
The Sleep Heart Health Study (SHHS) was designed to investigate the relationship between sleep disordered breathing and cardiovascular disease 222The findings in this report were based on publicly available data made available through the Sleep Heart Health Study (SHHS). However, the analyses and interpretation were not reviewed by members of the SHHS and does not reflect their approval for the accuracy of its contents or appropriateness of analyses or interpretation.. Polysomnograms were obtained in an unattended setting, usually in the homes of the participants, by trained and certified technicians [31]. The recording montage consisted of:
-
1.
C3/A2 and C4/A1 EEGs, sampled at 125 Hz.
-
2.
Right and left EOGs, sampled at 50 Hz.
-
3.
Bipolar submental EMGs, sampled at 125 Hz.
-
4.
Thoracic and abdominal excursions sampled at 10 Hz.
-
5.
Airflow (nasal-oral thermocouple), sampled at 10 Hz.
-
6.
Pulse oximetry, sampled at 1 Hz.
-
7.
ECG sampled at 125 Hz or 250 Hz.
-
8.
Heart rate sampled at 1 Hz.
-
9.
Body position.
-
10.
Ambient light.
3 Methods
3.1 Preprocessing
The fingertip pulse oximetry signal available in the SHHS database is complemented with information regarding the state of the oximeter. When the patient changes its position or simply moves its limbs, this movement can produce artifacts and render an invalid measurement, as can be seen in Fig. 1. This causes a discontinuity in the signal, with an abrupt jump toward a saturation value of . Thus, the obtained signal can have one or more invalid portions during a study. These non-informative components badly affect the EMD algorithm [34], and they should be avoided.
For this purpose we use the data regarding the sensor status, and we simply eliminate the time span during which the sensor signal is invalid, with a concatenation of the previous and posterior data. Although this may sound unnatural, we have tried other alternatives, like interpolation using different methods, and in all cases the interpolation also produces a perturbation in the EMD algorithm that renders unusable the results. For this reason, we applied this simple method.
An additional problem is related with the quantization: each quantization level corresponds to of the saturation value. This quantization noise produces artifacts in the resulting EMD decomposition. To reduce its influence and taking into account that the desaturations produced by the apneas would have periods larger than s, corresponding to oscillations of Hz, we apply a lowpass FIR filter with a cutoff frequency of Hz to preprocess the signal.
3.2 EMD of SpO2
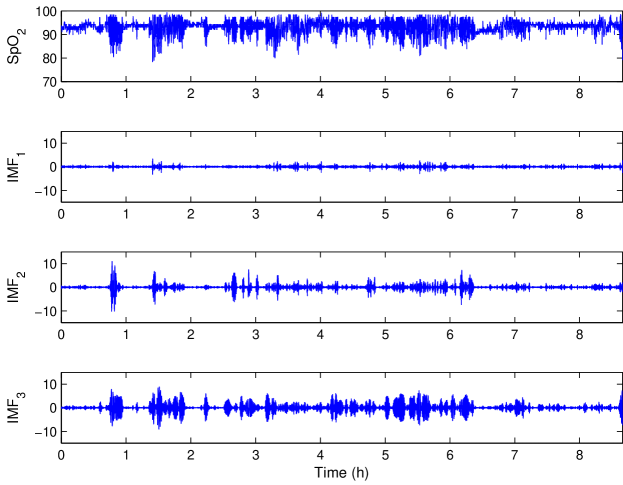
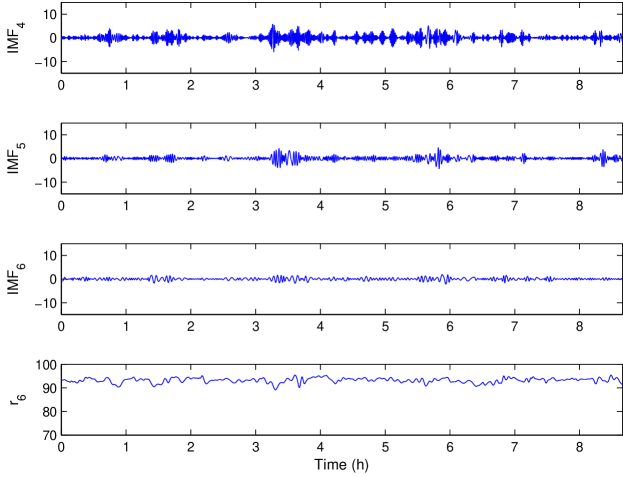
In Fig. 2 the decomposition in six modes via EMD of an oximetry signal is shown. The signal has been preprocessed as described above. The oximetry signal is in the upper panel in Fig. 2a. It can be noticed the distinctive sawtooth-like behavior of the SpO2 in presence of desaturations. The first mode of this decomposition contains the residual quantization noise with useless information. Modes 2 to 5 seem to provide more useful data showing oscillations where the desaturation events occur. Mode 6 and the final residue contain irrelevant information, including low-energy and low-frequency oscillations, and the signal trend. The oscillations associated to desaturations are distributed in different modes, making impossible to select a single mode to detect these events. As a solution, combinations of two or more modes are here proposed.
3.3 Detection
We propose a method based in the EMD of the oximetry signal with the goal of estimating an index that can be used in the screening of OSAHS.
The standard algorithms for automatic detection of desaturations are based on the clinical criteria 2 and 3. The SpO2 must decrease at least , and last s or longer, to be considered as an apnea/hypopnea event. This reduction is measured from a baseline corresponding to the normal oxygenation. Unfortunately, there is not a consensus about the methodology for estimating this baseline [35]. One approach is based on using the mean value of SpO2 over all the study. A different method only considers the first 3 minutes [36]. Nevertheless, in some cases, SpO2 can drop to a stable value under the baseline during the sleep.
To avoid these problems, dynamic estimations of the baseline are employed. Chiner et al. [21] use the mean value of SpO2 during the previous minutes as baseline estimator. The same strategy is used by de Chazal et al. [37]. Another method is applied by Vázquez et al. [19, 38]. In these cases, the baseline is estimated using the top fifth percentile of SpO2 values over the five minutes preceding the event. This method do not take into account the SpO2 values during desaturations, and for this reason the baseline estimation is much more similar to the basal value during the normal breathing. An equivalent procedure is employed in a recent study [39], where they adopt as baseline the mean of the top of the SpO2 data within min. The main failures of the algorithms for desaturation detection are related with incorrect baseline estimations.
The new algorithm here proposed do not need these estimations. We applied EMD to the preprocessed SpO2 signal, with a maximum number of modes set to six and a maximum number of sifting iterations set to 50. The stopping criterion was the one proposed by Rilling [40]. Auxiliary signals were obtained by adding two, three, or four consecutive modes, considering only modes from to . Each auxiliary signal was processed searching for extrema. Next, the difference in amplitude between each local maximum and the following local minimum (), and the corresponding time interval () were measured. If both and are higher than certain previously set thresholds ( and ), a desaturation event is detected. Finally, an oxygen desaturation index (ODI) defined as the ratio between the number of desaturation events and the duration of the valid signal (in hours) is calculated.
4 Results
In the previously described algorithm, three aspects need to be experimentally determined: the combination of EMD modes, and the parameters and . To determine these values a partition of 40 training signals was generated. These signals were randomly selected, making a balanced training set with 10 signals with AHI , 10 with , 10 with and 10 with AHI higher than . This was necessary due to the unbalance in favor of high AHI signals in the database. The remaining signals were kept as a test database. As an objective measure to evaluate the algorithms, we use the area under the ROC curve (AUC) [41]. This measure allows for a comparison of different classifiers for the whole range of threshold. A bootstrap estimator [42] of the AUC using 100 replicates was applied and the confidence intervals were estimated [43].
4.1 Parameter selection
To find the best combination of modes and thresholds and , a series of experiments was performed over a training dataset with the set of 40 randomly selected signals. The values of were varied from to in steps of , was varied from to in steps of , and the ODI was estimated for each signal. The signals were separated into two classes using as thresholds the polisomnography based AHIs , and .
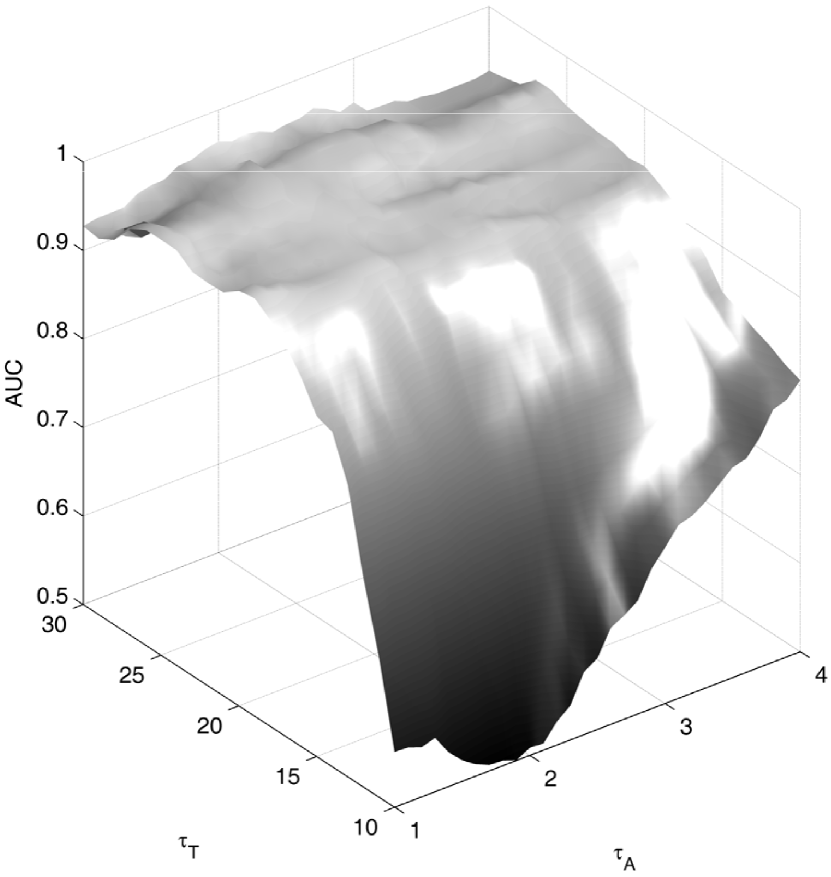
All mode combinations were explored. The behaviors were qualitatively similar. The combination of modes that yielded the best results was the sum of modes 3, 4, and 5. In Fig. 3 we show the AUC for a threshold AHI as a function of and . The main reason for this combination of modes been more effective that using a single mode is that the oscillations more related with the desaturations events are present in one of these three modes. These events can not be captured in a single mode because its amplitude and duration are changing in time and among patients.
In Fig. 3 it can be noticed that the best AUC values are in two well-localized “ridges”: one corresponding to around – and the other in with values rounding –. The maximum is AUC for and .
4.2 Evaluation on the test database
The proposed algorithm was applied to the of the remaining signals in the database (669 cases) using the best combination of modes and the optimal values of the parameters. The method was compared with the two mentioned baselines [21, 19]. Three values for the reference diagnostic AHI threshold were used. Table 1 displays the results for a threshold of AHI, , and . The estimated value of AUC and the confidence intervals are shown.
| Method | AHIthr | AUC | AUCmin | AUCmax |
|---|---|---|---|---|
| 5 | 0.687 | 0.526 | 0.872 | |
| Chiner et al. [21] | 10 | 0.754 | 0.694 | 0.798 |
| 15 | 0.749 | 0.701 | 0.795 | |
| 5 | 0.856 | 0.723 | 0.941 | |
| Vázquez et al. [19] | 10 | 0.894 | 0.854 | 0.922 |
| 15 | 0.905 | 0.880 | 0.920 | |
| 5 | 0.888 | 0.837 | 0.962 | |
| EMD | 10 | 0.912 | 0.879 | 0.941 |
| 15 | 0.923 | 0.898 | 0.942 |
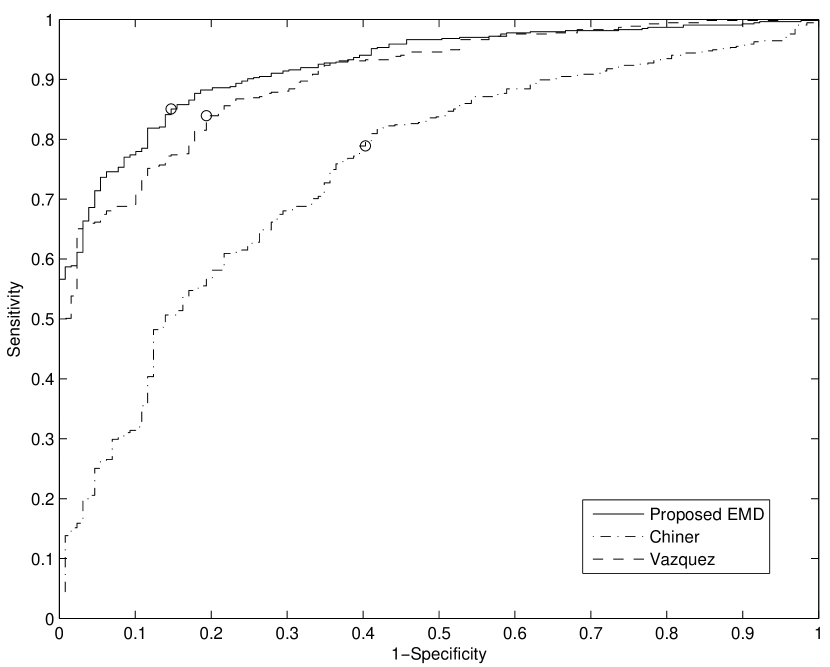
It can be seen that the AUC for the proposed method is the best among the tested alternatives. In case of the reference AHI threshold of 15, the resulting ROC curve can be seen in Fig. 4. The circle shows the optimal operating point which maximizes both the sensitivity () and the specificity (). This point corresponds to a diagnostic threshold of ODI , and produces and . The figure also shows the ROC curve and optimal operating point for the algorithm by Chiner [21] with and for , and the method by Vázquez [19] with and using a .
The final test was done using the remaining of the database (287 signals never used in previous stages) estimating and at the optimal operating points of the three analyzed methods. The sensitivity and specificity corresponding to the here proposed method were and respectively. In the case of the algorithm by Chiner et al., and were and respectively, and the corresponding ones for the method by Vazquez were and .
5 Discussion
The utilization of pulse oximetry as a sole signal to assist OSAHS diagnosis is still a controversial issue. Collop et al. [16] stated that 1 or 2 channels (including oximetry) home-unattended studies had wide variance of false positives, and that the evidence to support these studies to make a diagnosis of OSAHS is insufficient. Analysis of nocturnal oximetry has been applied as a potential diagnostic screening tool over the two past decades, but the signal interpretation were highly dependent on the physician, and on the technical performance. Recently it was demonstrated that, when treated with appropriated and sophisticated algorithms, overnight oximetry recording appears to be a very sensitive and specific screening method of OSAHS [17]. Pulse oximetry is accepted as the sole diagnostic evaluation criterion in United States, Australia and Sweden [18]. The Apnea Task Group of the German Society for Sleep Research and Sleep Medicine (DGSM) has stated that pulse oximetry can be employed to attain a tentative diagnosis that requires further evaluation at a sleep laboratory.
The results of pulse oximetry can be limited by artifacts due to inaccurate readings (especially in obese patients), hypotension, and abnormalities in the hemoglobin, among several factors. These drawbacks make evident the need of signal processing and pattern recognition techniques in order to detect and reduce the effects of noise and artifacts. In previous methods based on oxygen saturation obtained by pulse oximetry, sensitivity and specificity ranged from to , and from to respectively, according to [3, 14, 19]. This high variability is caused by the differences among the devices, populations, and the applied signal processing methods [20]. The results of the here presented method overcome the ones of [19, 21], as shown in the previous section. Additionally, the database here used (996 patients) is larger than those utilized in [19] (241 patients) and [21] (275 patients), which may explain the discrepancies among the results of the original references and the obtained in our work. Given that our results were obtained using all the methods over the same larger database, the proposal of this work clearly outperforms the analyzed alternatives. Additionally, the bootstrapping approach allowed us to estimate the confidence intervals of the AUC, which was not done in the other cases. This is a rigorous methodology which, to our knowledge, was not used in this area in previous works.
As the ROC curves for the proposed approach are above the ones corresponding to the standard methods in the whole range, this new technique produces a better compromise between sensitivity and specificity.
One limitation of our method, as in all methods based only on desaturation, is that there is no information regarding the sleep stage of the patient. The number of desaturations associated to apnea by hour of sleep is impossible to estimate without knowing if the patient is asleep or not. Another limitation may be related to the signal quality. As above-mentioned, if the signal has artifacts related to movements or disconnections, that segments are eliminated prior to the EMD. Thus, for this method to be valuable, the signal quality must be assessed and low quality studies should be discarded.
6 Conclusion
A new algorithm for SpO2 signal analysis using EMD was proposed. It was shown that the information from desaturations was mainly concentrated in EMD modes 2-5. Based on this information, a detection algorithm using a combination of these modes was proposed. The optimal parameters were determined using a balanced training database. This desaturation detector was used to produce an ODI that is here used to detect OSAHS. It was found that the best alternative was to combine modes 3, 4 and 5. When compared AUC over the test database with the two standard algorithms, it was seen that the here proposed method outperforms the standard ones, with narrower confidence intervals. As future work, we are interested in testing more advanced methods for EMD that avoid the problem of mode mixing, to improve even more these results. Furthermore, a more balanced database would enable a better parameter selection.
Acknowledgments
Competing interest: None declared.
Funding: This work was supported by the National Agency for Scientific and Technological Promotion (ANPCyT) under Grants PAE–PID–2007–00113, PICT-2012-2954, Universidad Nacional del Litoral under projects UNL-CAI+D R4-N14 and UNL CAI+D 2011 58-519, Universidad Nacional de Entre Ríos, and the National Council on Scientific and Technical Research (CONICET).
Ethical approval: Not required.
The authors thank Carlos Pais from CardioCom S.R.L. for his support during the realization of this work.
References
- [1] American Academy of Sleep Medicine, The international classification of sleep disorders, revised. Diagnostic and Coding Manual, 2nd Edition (2001).
- [2] Hossain J, Shapiro C, The prevalence, cost implications, and management of sleep disorders: An overview, Sleep and Breathing 6 (2) (2002) 85–102.
- [3] Hornero R, Álvarez D, Abásolo D, del Campo F, Zamarrón C, Utility of Approximate Entropy From Overnight Pulse Oximetry Data in the Diagnosis of the Obstructive Sleep Apnea Syndrome, IEEE Transactions on Biomedical Engineering 54 (1) (2007) 107–113.
- [4] Salisbury JI, Sun Y, Rapid screening test for sleep apnea using a nonlinear and nonstationary signal processing technique, Medical Engineering and Physics 29 (2007) 336–343.
- [5] Ünal M, Öztürk L, Kanik A, The role of oxygen saturation measurement and body mass index in distinguishing between non–apneic snorers and patients with obstructive sleep apnoea syndrome, Clinical Otolaryngology 27 (2002) 344–346.
- [6] Strollo PJ, Rogers RM, Obstructive sleep apnea, The New England Journal of Medicine 334 (2) (1996) 99–104.
- [7] De Backer W, Obstructive sleep apnea/hypopnea syndrome, Panminerva medica 55 (2) (2013) 191–195.
- [8] Lurie A, Obstructive sleep apnea in adults: epidemiology, clinical presentation, and treatment options, Advances in cardiology 46 (2011) 1–41.
- [9] Thurnheer R, Bloch KE, Laube I, Gugger M, Heitz M, Respiratory polygraphy in sleep apnoea diagnosis, Swiss Medical Weekly 137 (2007) 91–102.
- [10] Yadollahi A, Moussavi Z, Apnea detection by acoustical means, in: Proceedings of the 28th IEEE EMBS Annual International Conference, New York City, USA, Aug 30 – Sep 3, 2006, pp. 4623–4626.
- [11] Solá-Soler J, Fiz JA, Morera J, Jané R, Multiclass classification of subjects with sleep apnoea-hypopnoea syndrome through snoring analysis, Medical Engineering & Physics 34 (9) (2012) 1213–1220.
- [12] Roche F, Sforza E, Duverney D, Borderies JR, Pichot V, Bigaignon O, Ascher G, Barthélémy J, Heart rate increment: an electrocardiological approach for the early detection of obstructive sleep apnoea/hypopnoea syndrome, Clinical Science 107 (2004) 105–110.
- [13] Caseiro P, Fonseca-Pinto R, Andrade A, Screening of obstructive sleep apnea using hilbert-huang decomposition of oronasal airway pressure recordings, Medical Engineering & Physics 32 (6) (2010) 561–568.
- [14] Raymond B, Cayton RM, Chappell MJ, Combined index of heart rate variability and oximetry in screening for the sleep apnoea/hypopnoea syndrome, Journal of Sleep Research 12 (2003) 53–61.
- [15] Kaniusas E, Pfützner H, Saletu B, Acoustical signal properties for cardiac/respiratory activity and apneas, IEEE Transactions on Biomedical Engineering 52 (2005) 1812–1822.
- [16] Collop N, Anderson WM, Boehlecke B, Claman D, Goldberg R, Gottlieb D, Hudgel D, Sateia M, Schwab R, Clinical guidelines for the use of unattended portable monitors in the diagnosis of obstructive sleep apnea in adult patients, J Clin Sleep Med 3 (7) (2007) 737–747.
- [17] Poupard L, Philippe C, Goldman MD, Sartène R, Mathieu M, Novel mathematical processing method of nocturnal oximetry for screening patients with suspected sleep apnoea syndrome, Sleep and Breathing 16 (2) (2012) 419–425.
- [18] Böhning N, Schultheiß B, Eilers S, Penzel T, Böhning W, Schmittendorf E, Comparability of pulse oximeters used in sleep medicine for the screening of OSA, Physiological Measurement 31 (7) (2010) 875–888.
- [19] Vázquez JC, Tsai WH, Flemons WW, Masuda A, Brant R, Hajduk E, Whitelaw WA, Remmers JE, Automated analysis of digital oximetry in the diagnosis of obstructive sleep apnoea, Thorax 55 (4) (2000) 302–307.
- [20] Netzer N, Eliasson AH, Netzer C, Kristo DA, Overnight pulse oximetry for sleep–disordered breathing in adults: a review, Chest 120 (2001) 625–633.
- [21] Chiner E, Signes-Costa J, Arriero JM, Marco J, Fuentes I, Sergado A, Nocturnal oximetry for the diagnosis of the sleep apnoea hypopnoea syndrome: a method to reduce the number of polysomnographies?, Thorax 54 (1999) 968–971.
- [22] Huang NE, Shen Z, Long SR, Wu MC, Shih HH, Zheng Q, Yen NC, Tung CC, Liu HH, The empirical mode decomposition and the Hilbert spectrum for nonlinear and non-stationary time series analysis, Proc. R. Soc. Lond. A 454 (1998) 903–995.
- [23] Balocchi R, Menicucci D, Santarcangelo E, Sebastiani L, Gemignani A, Ghelarducci B, Varanini M, Deriving the respiratory sinus arrhythmia from the heartbeat time series using empirical mode decomposition, Chaos, Solitons and Fractals 20 (2004) 171–177.
- [24] Mendez M, Corthout J, Van Huffel S, Matteucci M, Penzel T, Cerutti S, Bianchi A, Automatic screening of obstructive sleep apnea from the ecg based on empirical mode decomposition and wavelet analysis, Physiological measurement 31 (3) (2010) 273.
- [25] Wu Z, Huang NE, Ensemble empirical mode decomposition: a noise-assisted data analysis method, Advances in Adaptive Data Analysis. Theory and Applications 1 (2009) 1–41.
- [26] Schlotthauer G, Torres ME, Rufiner HL, A new algorithm for instantaneous speech extraction based on ensemble empirical mode decomposition, in: Proc 17th European Sig Proc Conf EUSIPCO 09, Glasgow, Scotland, 2009, pp. 2347–2351.
- [27] Torres ME, Colominas MA, Schlotthauer G, Flandrin P, A complete ensemble empirical mode decomposition with adaptive noise, in: Acoustics, Speech and Signal Processing (ICASSP), 2011 IEEE International Conference on, IEEE, 2011, pp. 4144–4147.
- [28] Colominas MA, Schlotthauer G, Torres ME, Flandrin P, Noise-assisted EMD methods in action, Advances in Adaptive Data Analysis 04 (04) (2012) 1250025.
- [29] Schlosshan D, Elliott MW, Sleep 3: Clinical presentation and diagnosis of the obstructive sleep apnoea hypopnoea syndrome, Thorax 59 (4) (2004) 347 –352.
- [30] McNicholas WT, Diagnosis of obstructive sleep apnea in adults, Proc Am Thorac Soc 5 (2) (2008) 154–160.
- [31] Redline S, Sanders MH, Lind BK, Quan SF, Iber C, Gottlieb DJ, Bonekat WH, Rapoport D, Smith PL, Kiley JP, et al., Methods for obtaining and analyzing unattended polysomnography data for a multicenter study. Sleep Heart Health Research Group., Sleep 21 (7) (1998) 759–767.
- [32] Quan S, Howard B, Iber C, Kiley J, Nieto F, O’Connor G, Rapoport D, Redline S, Robbins J, Samet J, PW PW, The Sleep Heart Health Study: design, rationale, and methods, Sleep 20 (12) (1997) 1077–1085.
- [33] Lind B, Goodwin J, Hill J, Ali T, Redline S, Quan S, Recruitment of healthy adults into a study of overnight sleep monitoring in the home: experience of the sleep heart health study, Sleep Breath. 7 (1) (2003) 13–24.
- [34] Kim D, Kim K, Oh H.-S, Extending the scope of empirical mode decomposition by smoothing, EURASIP Journal on Advances in Signal Processing 2012 (1) (2012) 168.
- [35] Berry R, Budhiraja R, Gottlieb D, Gozal D, Iber C, Kapur V, Marcus C, Mehra R, Parthasarathy S, Quan S, et al., Rules for scoring respiratory events in sleep: update of the 2007 AASM manual for the scoring of sleep and associated events. deliberations of the sleep apnea definitions task force of the american academy of sleep medicine., Journal of clinical sleep medicine: JCSM: official publication of the American Academy of Sleep Medicine 8 (5) (2012) 597–619.
- [36] Zamarrón C, Romero PV, Rodriguez JR, Guda F, Oximetry spectral analysis in the diagnosis of obstructive sleep apnoea, Clinical Science 97 (4) (1999) 467–473.
- [37] de Chazal P, Heneghan C, McNicholas WT, Multimodal detection of sleep apnoea using electrocardiogram and oximetry signals, Philosophical Transactions of the Royal Society A: Mathematical, Physical and Engineering Sciences 367 (1887) (2009) 369–389, PMID: 18974035.
- [38] Burgos A, Goñi A, Illarramendi A, Bermudez J, Real-time detection of apneas on a PDA, IEEE Transactions on Information Technology in Biomedicine 14 (4) (2010) 995–1002.
- [39] Xie B, Minn H, Real-time sleep apnea detection by classifier combination, IEEE Transactions on Information Technology in Biomedicine 16 (3) (2012) 469–477.
- [40] Rilling G, Flandrin P, Gonçalvès P, On Empirical Mode Decomposition and its algorithms, in: IEEE-EURASIP Workshop on Nonlinear Signal and Image Processing 3 NSIP-03, Grado, Italy, 2003.
- [41] Fawcett T, An introduction to ROC analysis, Pattern Recognition Letters 27 (2006) 861–874.
- [42] Efron B, Tibshirani R, Bootstrap methods for standard errors, confidence intervals, and other measures of statistical accuracy, Statistical Science 1 (1986) 54–75.
- [43] Macskassy SA, Provost F, Confidence bands for roc curves: Methods and an empirical study, in: First Workshop on ROC Analysis in AI, ECAI-2004, 2004.