Interactions of aqueous amino acids and proteins with the (110) surface of ZnS in molecular dynamics simulations
Abstract
The growing usage of nanoparticles of zinc sulfide as quantum dots and biosensors calls for a theoretical assessment of interactions of ZnS with biomolecules. We employ the molecular-dynamics-based umbrella sampling method to determine potentials of mean force for 20 single amino acids near the ZnS (110) surface in aqueous solutions. We find that five amino acids do not bind at all and the binding energy of the remaining amino acids does not exceed 4.3 kJ/mol. Such energies are comparable to those found for ZnO (and to hydrogen bonds in proteins) but the nature of the specificity is different. Cysteine can bind with ZnS in a covalent way, by forming the disulfide bond with S in the solid. If this effect is included within a model incorporating the Morse potential, then the potential well becomes much deeper – the binding energy is close to 98 kJ/mol. We then consider tryptophan cage, a protein of 20 residues, and characterize its events of adsorption to ZnS. We demonstrate the relevance of interactions between the amino acids in the selection of optimal adsorbed conformations and recognize the key role of cysteine in generation of lasting adsorption. We show that ZnS is more hydrophobic than ZnO and that the density profile of water is quite different than that forming near ZnO – it has only a minor articulation into layers. Furthermore, the first layer of water is disordered and mobile.
I Introduction
Quantum dots (QD) ekimov_1981 ; reed_1988 are semiconducting nanocrystals in which the exciton-based light emission is tuned by their size liang_1970 which allows for simultaneous imaging of many targets wang_2011 . They exhibit photonic absorption rates and brightness of the emission that exceed the corresponding characteristics of organic dyes by an order of magnitude. These features, together with their extraordinary photostability, suggests using the QDs for biosensing walling_2009 ; frasco_2010 . However, in order to accomplish sensing of a highly specific nature, the QDs need to be conjugated with biological molecules such as antibodies, which reduces the fluorescence reiss_2009 ; wang_2008 because of a buildup of surface trap states that lead to non-radiative de-excitation. The novel way out involves coating the QDs by a shell of an another semiconductor that is characterized by a larger bandgap. One example of such a core/shell (CS) system is CdSe/ZnS dabbousi_1997 in which the core is made of CdSe and the shell – of ZnS. ZnS is a semiconductor of a particularly large gap – larger than 3.5 eV in the bulk. The precise value depend on the crystalline form, temperature and doping. Coating by ZnS not only improves the fluorescence of the core and greatly reduce its toxicity elbaum_2013 but it also makes the system stabler in water. Preliminary studies korczyc_2012 clearly show solubility of fibers made of ZnO and insolubility of the same fibers coated by ZnS shell. Furthermore, the CS geometry allows for a wider range of tuning of the emission wavelength soni_2010 ; cao_2005 . Other cores used in the CS systems with ZnS include CdS, ZnO, and InP zhu_2006 ; zhang_2011 ; brunetti_2013 . Since ZnS forms the outermost inorganic part of the CS particles it is of great interest to understand the nature of interactions between ZnS and various biomolecules. Here, we present results of all-atom molecular dynamics (MD) simulations that focus on the strength of interactions between the solid ZnS and single amino acids (AA) in water solvents. We then discuss adsorption of small proteins to ZnS. For simplicity, the ZnS surface is considered to be flat. This is a necessary first theoretical step to make before the effects of curvature can be considered.
Our model is described in terms of classical, instead of quantum, atoms so that diffusion, conformational transformations and the dynamical effects of water molecules can be addressed at meaningful time and length scales. This approach is an accepted standard in simulations of proteins. Similar models have also been employed in studies of biomolecules in the vicinity of various solids such as Au hoefling_2010_a ; verde_2009 , SiO2 cruz-chu_2006 ; forte_2007 , TiO2 monti_2010 , and ZnO gao_2009 ; nawrocki_2013 , but ZnS appears not yet to be considered. ZnS is, however, different than ZnO that has been previously studied by us because it may form covalent bonds with the sulfur atom of cysteine sperling_2010 ; kumar_2013 . This makes the peptides with multiple cysteines being used as good anchors in the process of QDs bioconjugation bae_1998 ; pinaud_2004 ; li_2004 . One possibility is that the S atoms of ZnS form disulfide bonds with the S on cysteine. Another is that there is a coordinated binding by the Zn atoms at the surface imperfections. Formation and breakage of such covalent bonds is beyond the classical physics and is not accounted for by just binding the two sulfurs through the harmonic potential since the resulting forces acts at infinite distances. Here, we propose a phenomenological way to incorporate the transient features of the disulfide bond by using the Morse potential.
There are several experimental reports on peptides characterized by a high affinity also to other solids such as GaAs, InP and Si whaley_2000 ; bachmann_2010 ; yokoo_2010 ; grzyb_2012 . There are also observations of conformational changes in the peptides induced by adsorption oren_2005 . However, the analysis of the interactions with the solid should start at a more basic level – that of single amino acids. This step should help in the interpretation of the adsorption behavior of proteins and in the design of peptide sequences with a substantial attraction to ZnS. Here, we follow the approach adopted in the context of ZnO nawrocki_2013 and use the umbrella sampling technique kumar_1992 ; lemkul_2010 to derive the potential of mean force (PMF), , for single AAs in water solutions as a function of the distance, , from the surface of ZnS. If the resulting has a minimum then we determine the corresponding binding energy, , and the bond length, .
We find that five AAs do not bind to ZnS. When they do, the values of are small if one excludes cysteine. Only four of them exceed 2.1 kJ/mol and are smaller than 4.3 kJ/mol. These values are comparable to those obtained for the four surfaces of ZnO nawrocki_2013 and are comparable in strength to the weaker hydrogen bonds in proteins. Yet, as we shall see here, they are capable of causing brief adsorption of a small protein without any cysteines. The values of obtained for ZnS are comparable but smaller than those calculated for the AA analogues on SiO2, (up to 12 kJ/mol wright_2012 ) and on TiO2 (up to 20 kJ/mol monti_2010 ). The experimental work of AAs on Si yields values up to 3.64 kJ/mol basiuk_1996 . Stronger binding energies, between 17.5 and 44.2 kJ/mol, have been calculated hoefling_2010_a for surfaces of Au. Unlike the previous examples, all AAs do bind to gold.
Long lasting adsorption of a protein to ZnO can be achieved when the protein carries a cysteine. We find that the PMF for the cysteine-ZnS couplings has a well depth of about 100 kJ/mol which is significantly larger than the values of for all other AAs but also substantially smaller than the dissociation energy of the disulfide bond – about 264 kJ/mol. The latter effect reflects the importance of interactions with the molecules of water.
The PMF derived for AAs through all-atom simulations may be incorporated into implicit-solvent Cα-based coarse grained models of larger proteins (see, for instance, pandey_2013a ; pandey_2013b ). Such simplified models could be used to determine preferred orientations of adsorption which in turn should enable deduction of whether the biological functionality of the protein is maintained or not. They could also be used to estimate surface coverage area.
II Methods
Our all-atom MD simulations employ the GROMACS 4.0.7 package spoel_2005 with the AMBER-99 force field duan_2003 . Water molecules are described by the TIP3P model jorgensen_1983 . The interactions between atoms can be subdivided into bonded and non-bonded. The latter account for Coulombic interactions between charged particles, Lennard-Jones-like van der Waals forces and similarly described repulsion due to overlapping electron orbitals. The bonded interactions account for stretching of covalent bonds, twisting of bond angle, and bending of the dihedral angle. We model the dihedral terms by the four-body Ryckaert-Bellemans potential
| (1) |
where is the angle between the and planes.
The covalent bonds are commonly described by the harmonic potential. So are the bending terms. However, in order to render the transient nature of the S-S covalent bond between the sulfur atom on cysteine and the nearest sulfur atom of ZnS, we describe such bond by the Morse potential
| (2) |
and neglect dissociation of H from the thiol group into the solvent. Here denotes the depth of the potential well, defines its steepness, and is the location of the minimum. For small deviations from the minimum, the Morse potential acts like the harmonic potential . The corresponding stiffness coefficient, is listed in the AMBER-99 force field. Parameter is equal to the dissociation energy lide_2009 which is added to the list of the force field parameters. For instance, for the C-N bond is equal to 305 kJ/mol. Parameter is equal to . For reasons of computational convenience, we use the Morse potential also to describe the remaining covalent bonds – the peptide bonds, albeit with a higher . Furthermore, we use the normalized and sign-inverted Morse potential as an envelope that multiplies the bond and dihedral potentials involving the two atoms linked covalently (such as in the S-S-Cβ triplet in the bond-angle term in the disulfide bond and in the quadruplet S-S-Cβ-Cα in the dihedral term).
The stablest crystal form of ZnS – the zinc blende – is cubic and the lattice constant is equal to 0.541 nm swanson_1953 . The commonest cleavage face is found to be along the (110) plane tasker_1979 and this is the face we consider here. We model the ZnS surface by a slab of 5 7 2 unit cells. The solid is considered to be rigid and its geometry is taken to be bulk-like. The slab is located just under the bottom of the simulation box where water molecules and amino acids (or a protein) are placed. Here and are about 3.8 nm and are fited to the size of the slab. In proper runs, is equal to 4.0 nm were the reflecting wall is placed. Above this wall, there is an empty space extending to = 3 . Another reflecting wall, affecting only the amino acids, is placed at = 3.5 nm – otherwise an AA or a protein might get trapped at the water-vacuum interface. The purpose of this construction with the vacuum is to allow for the usage of the periodic boundary conditions (in the periodic image, above the empty space there are atoms of the solid) with the pseudo-2 particle mesh Ewald summation essman_1995 .
The partial charges on the Zn and S atoms in the solid are set to 0.48 and -0.48 , respectively, in agreement with the Mulliken analysis xie_2010 . Lennard-Jones parameters for both atoms are adopted from AMBER-99 force field. The standard procedure of making the simulations feasible in an acceptable time is to apply cutoff radii for all relevant interactions. We use the cutoff of 1.0 nm combined with the gradual switching off of the interactions between 1.0 and 1.2 nm.
The MD simulations were performed using the leap-frog algorithm with a time step of 1 fs. Temperature coupling with a Berendsen thermostat at the temperature of 300 K was implemented with the time constant of 0.1 ps. At the beginning of each run, the energy of the system was minimized through the steepest descent algorithm and the initial velocities were Maxwellian. The first runs pertained to the situation without any biomolecules – the system was equilibrated for 4 ns with set at 5 nm. At that stage was reduced to 4 nm. The reason for the reduction in is the depletion of water at the top due to the attraction by the solid. Further equilibration continued for 1 ns and only then the biomolecules and Na+ and Cl- ions were inserted adiabatically. The concentration of the ions corresponded to the physiological 150 mM: 4 ions of Na+ and 4 ions of Cl-. If a biomolecule had a net charge due to the side groups, extra ions were inserted to neutralize it.
The AAs considered in the simulations are endowed with the acetyl group at the N-terminus and N-methylamide group at the C-terminus. These caps eliminate the terminal charges and mimic the presence of a peptide chain in which the AA exists in the unionized form (see, hoefling_2010_a ; dragneva_2013 ). Histidine is considered in its three possible protonation states: HIE (H on the N atom), HID (H on the N atom) and positively charged HIP (H on both and N atoms). At the assumed value of pH of 7, all three forms are present with the same probability. The VMD software was used for viewing and analyzing the MD results.
The main objective of the simulations is to determine the PMF for twenty capped AAs and for the tryptophane cage. The PMF is defined as an effective potential that corresponds to the average force kirkwood_1935 and it is associated with the center of mass (CM) of the molecule (of the amino acid without the caps). We determine it by implementing the umbrella sampling method kumar_1992 ; lemkul_2010 . It involves two stages. In the first stage, one generates a set of initial conformations for representative values of by pulling the CM of the object along the -axis – perpendicular to the surface of the solid. Pulling is implemented through a ”dummy particle” which moves towards the surface with a constant speed of 1 nm/ns from =2 nm to =0 and drags the CM by the harmonic force corresponding to the the spring constant of 5000 kJ/(mol nm2). The lateral motion is not constrained so the PMF is averaged laterally. The conformations are scanned every 0.1 ps in order to save them with the CM within each of the interval of width 0.05 nm. In this way, between 36 and 38 conformations are collected in the case of the AAs and between 30 and 31 in the case of the protein. These conformations are used in the second stage of further runs lasting for 40 ns each (1 ns corresponds to equilibration). In the second-stage runs, the -location of the pulling particle is fixed and the CM moves within a sampling window of width . The distribution of the resulting vertical locations of CM in the window has a maximum where the harmonic pulling force is balancing all forces acting on the AA (we exclude the forces acting on the caps) or the protein along the direction. This force is averaged over time and locations within each window and is then integrated over to get the PMF. The errors of the average forces are determined by a block averaging method hess_2002 and are propagated during integration. The standard deviations of average values within the umbrella sampling intervals are found to be negligible.
III Results and Discussion
III.1 Properties of water near the solid
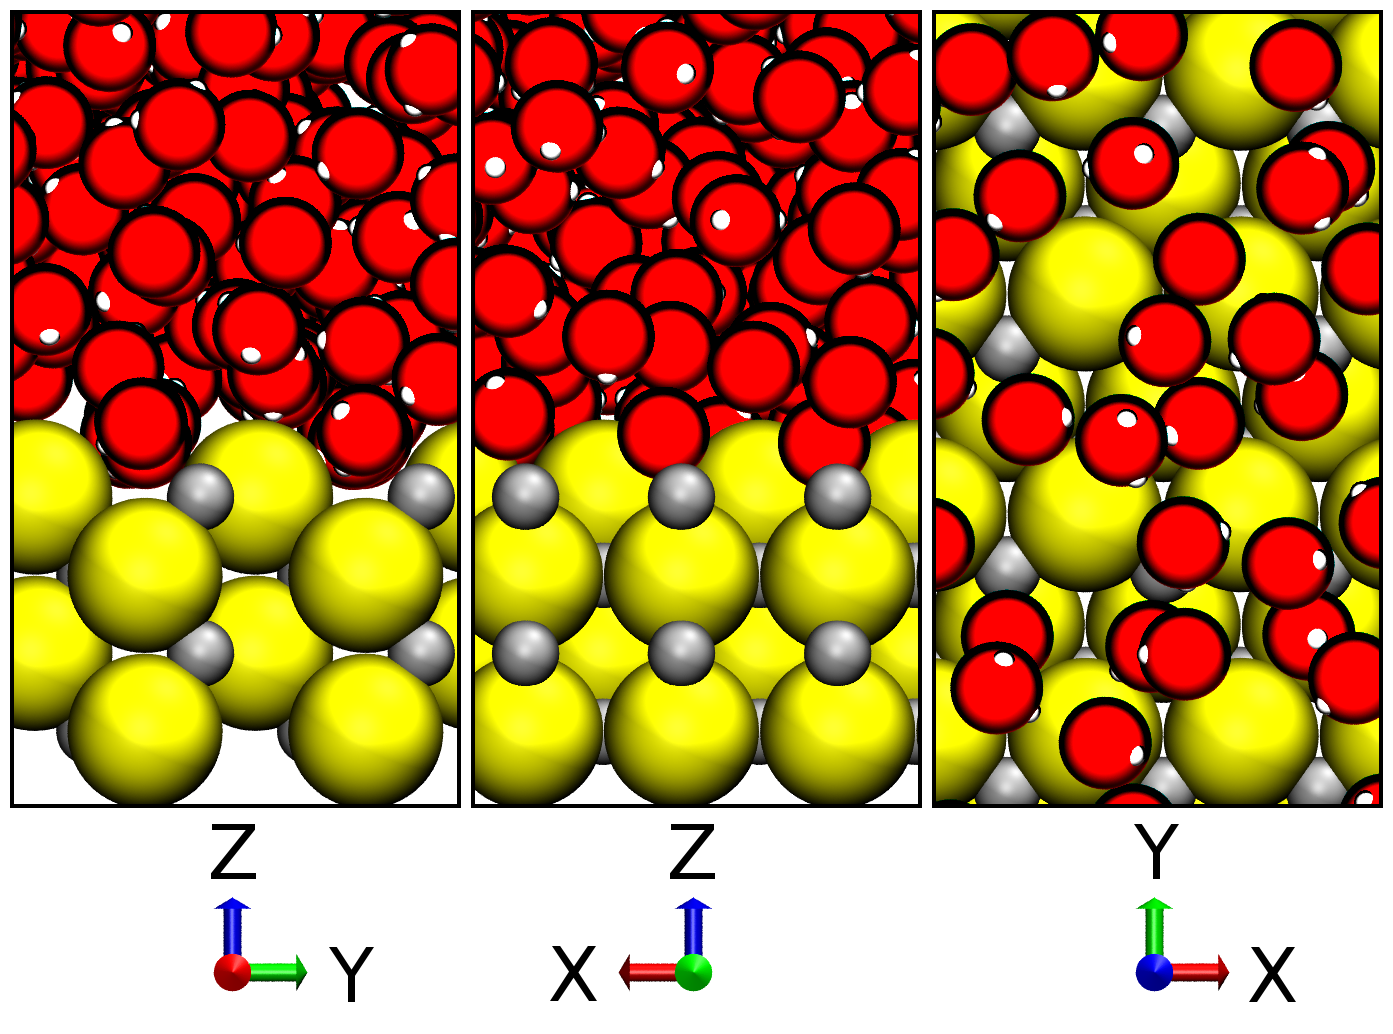
The properties of water, such as the profiles of density and polarization are derived from a 1 ns simulation performed just after equilibration. Fig. 1 shows a snapshot of the solid-water interface. It indicates that the atomic-level roughness of ZnS allows for a partial penetration by water. The layer of water mediately next to the solid is disordered which is in contrast to the nearly frozen character of such a layer near ZnO nawrocki_2013 ; zhang_2007 . This observation suggests that ZnS should be more hydrophobic than ZnO and thus also less soluble in water which is consistent with the experimental findings elbaum_2013 .
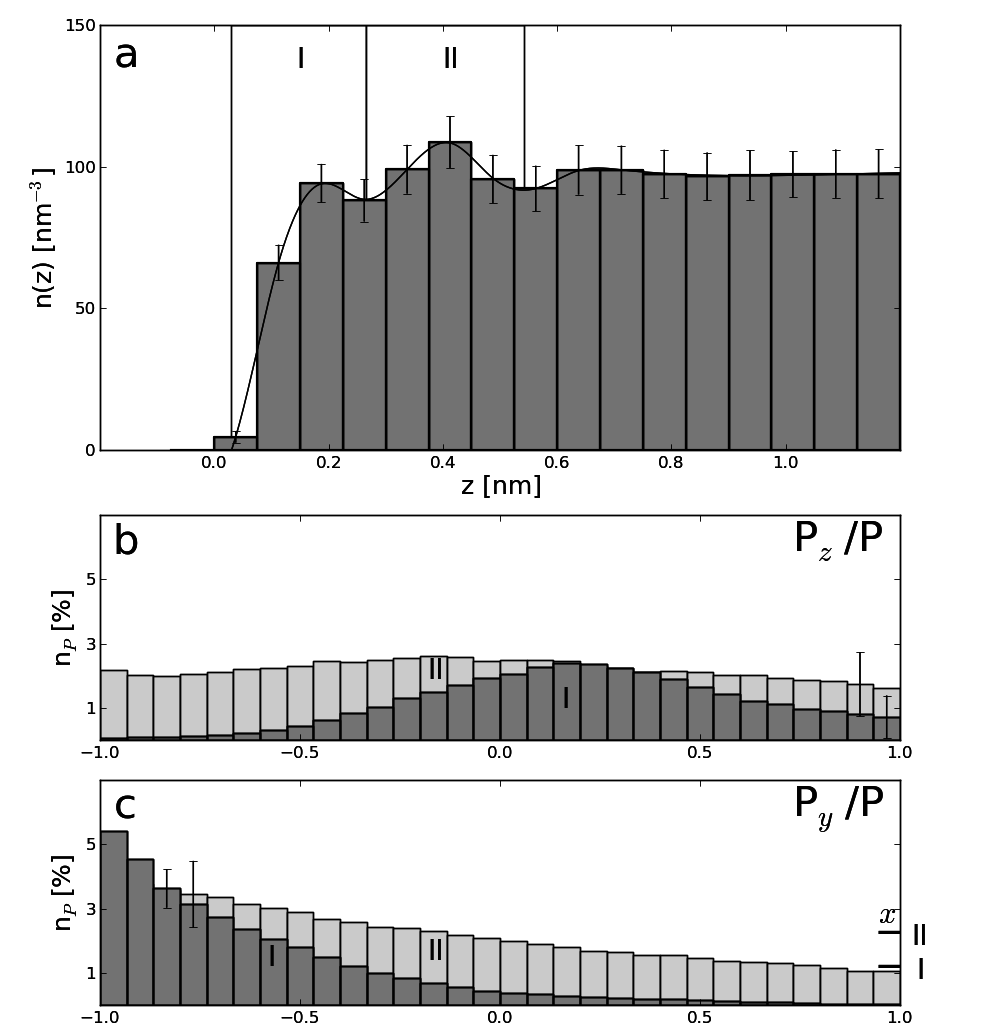
The number density profile is shown in panel a of Fig. 2. It is seen to be very poorly articulated which is quite distinct from what has been derived for other solid surfaces such as ZnO nawrocki_2013 , Au hoefling_2010_a ; verde_2009 ; chang_2008 , SiO2 castrillon_2009 and TiO2 monti_2010 where patterns of maxima and minima are observed. The lack of pronounced articulation is a result of rather weak attraction of water molecules to ZnS. Furthermore, there are more molecules in the second layer compared to the first one which is also different from the density profiling found in model noble gases near repulsive walls cieplak_1999 ; koplik_2000 . We attribute this difference to the atomic roughness, to the size differences between the atoms of Zn, S, and O. The two bottom panels of Fig. 2 show the profiles of the normalized and -components of the water polarization vector. The distribution for the component is nearly uniform indicating lack of polarization in this direction. In both of these panels, the distribution for the first water layer is less uniform than for the second pointing to an ordering influence of the solid in its closest proximity. The profile of the -component shows that maxima for both layers are fairly symmetrical with respect to the zero value suggesting that the polarization of the first layer causes the polarization of the second. The profile of the -component shows consistent maxima for both layers indicating both of them are polarized by the surface in this direction. The polarization in the -direction is more disordered and more uniform than in the direction.
III.2 PMF for amino acids
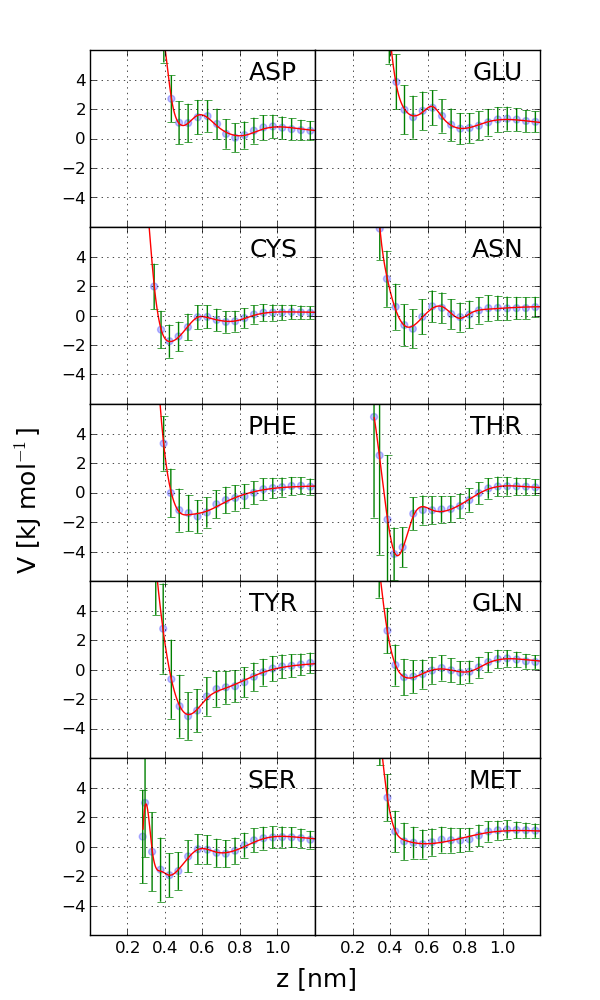
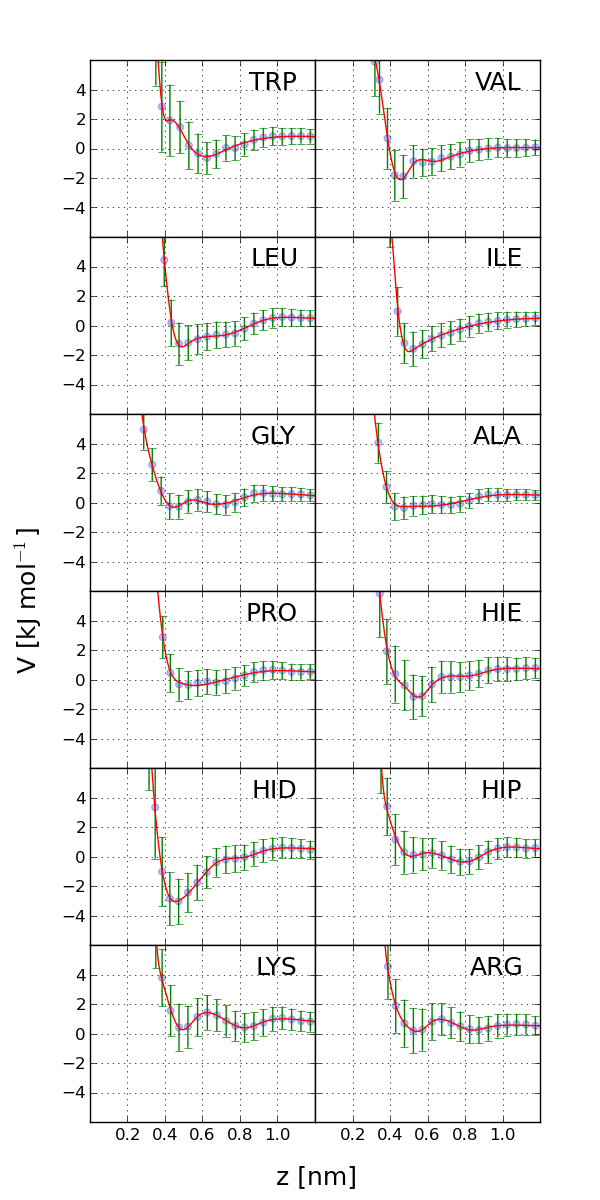
Fig. 3 shows the PMFs for the twenty capped AAs. Histidine is considered in its three states of protonation. The potentials are repulsive within the first 0.4 nm away from the surface. The potentials for ASP, GLU, MET, LYS, and ARG continue to be repulsive at larger distances. The remaining amino acids are weakly attracted within up to 1.2 nm. Some of the plots of PMFs show undulations. This happens in the case of the charged amino acids – ASP, GLU, ARG, and LYS, but not HIS – and in the case of AAs with a small polar groups – ASP and THR. Generally, undulations are due to layering in the density profiles of water nawrocki_2013 but the lack of strong features in the profile makes the undulations weak for ZnS. The values of and for the binding situations are listed in Table 1. Some of these values are small and comparable to the error bars – the case of GLY, ALA, PRO, and HIP. These AAs are essentially neutral to the surface. The strongest binding is observed for THR, TYR, and HID. The corresponding values of are between 3.06 and 4.28 kJ/mol.
Our results can be compared to those obtained by Wright wright_2012 for AA analogues at hydroxylated SiO2 surface and to those obtained by Monti monti_2010 for such analogues at the surface of TiO2. The binding energies for these two other systems are in the same range of what we obtain for ZnS and much smaller than what has been reported for gold (17.5-44.2 kJ/mol as found by Hoefling hoefling_2010_a and 3-22 kcal/mol as found by Feng feng_2010 ). In the case of SiO2, the behavior is similar because the polar and hydrophobic analogues adsorb at the surface whereas positively charged ones do not. It is also different because the negatively charged analogues bind to SiO2 but not to ZnS. In the case of TiO2, the hydrophobic analogues show poor binding and all charged moieties bind well.
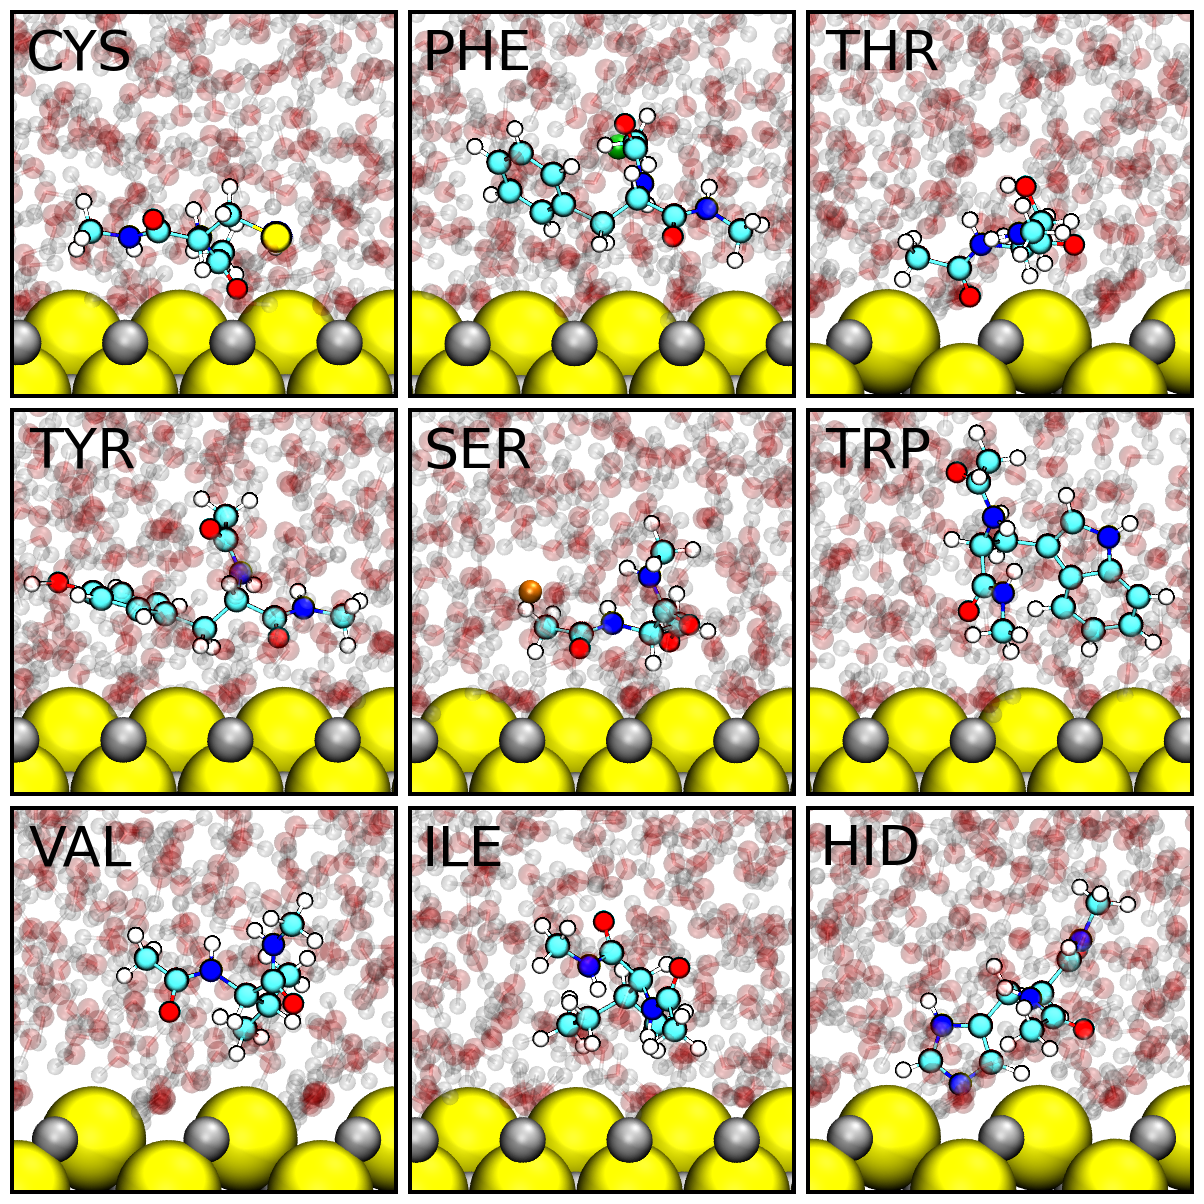
Fig. 4 shows examples of conformations for nine AAs as obtained at the minimum of the PMF. The AAs are seen to interact directly with the surface which is distinct from interactions through the first (and well articulated) layer of water that characterized interactions with ZnO nawrocki_2013 . The screening by water weakens the binding and yet the absence of this effect in the case of ZnS yields comparable values of . There are two reasons for this behavior. The first is that the partial charges of atoms in ZnS are smaller than those in ZnO by about a factor of 2. The second is that even though the water molecules do not form a frozen layer (as the ZnS surface is less hydrophilic than ZnO), they do compete with most of the AAs for the access to the surface of ZnS and weaken the attachment.
The conformations shown in Fig. 4 indicate that the binding takes place when the O and H atoms either on the side chain or on the peptide bonds substitute the O and H atoms of the water molecules in their direct interaction with ZnS. The substitution of O is seen in the case of CYS and THR, whereas the substitution of H – in the case of TRP and ILE. The adsorption of HID is caused by the substitution of O by the N in the position of the ring which is not the protonated N in the position. The binding energy of HIE is about three times smaller than that of HID. The reason for the weaker coupling is that in HIE the protonated N is in the position and the unprotonated N in the position and the position is less exposed to the surface of ZnS. We conclude that the nature of conformation at the minimum of PMF affects the binding energy in a substantial way.
We should point out that the conformations shown in Fig. 4 do not include the conformations of the hydrophobic methyl groups (CH3) on the caps. The methyl groups are known to be vital in adsorption to Au as they appears to initiate the event hoefling_2010_a . In the case of ZnS, however, these groups appear to play only a minor role.
III.3 Interactions with cysteine
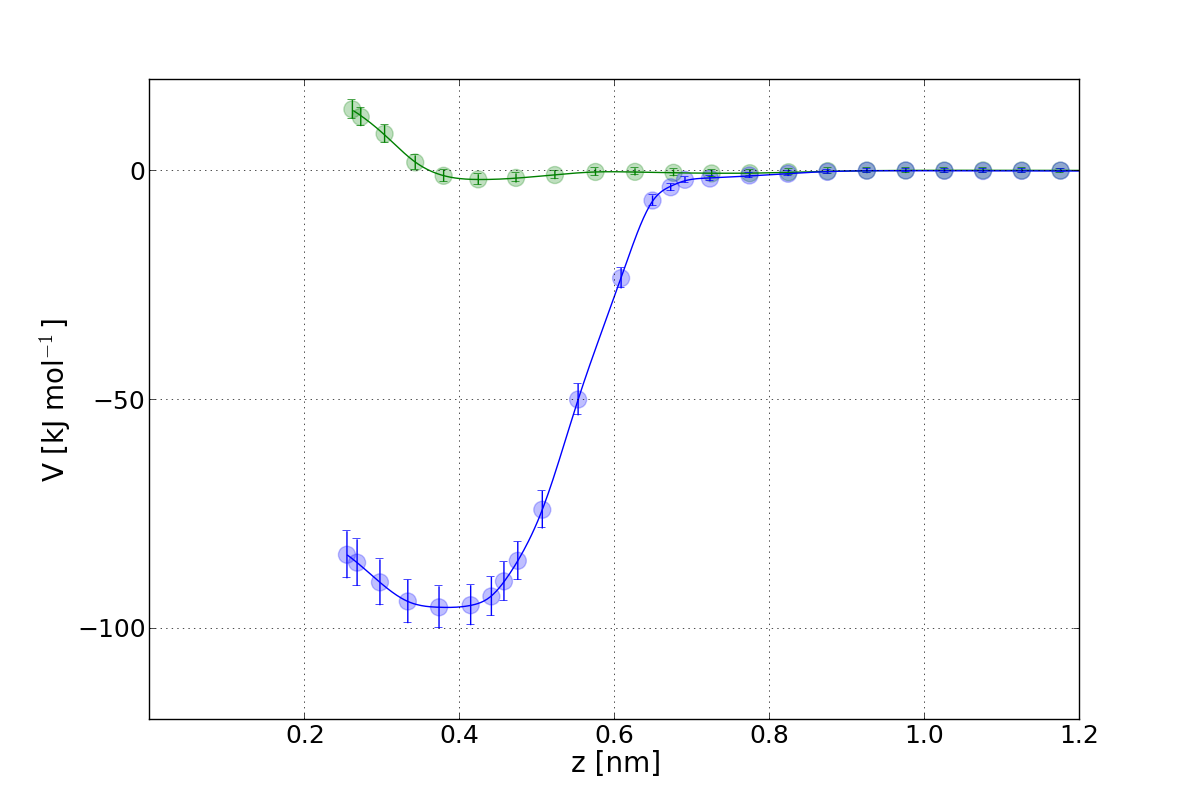
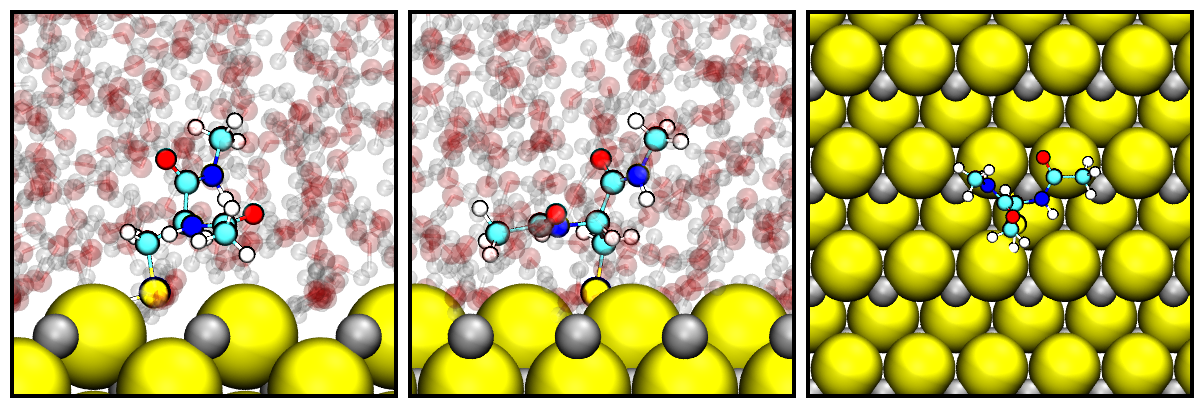
In our analysis so far, CYS has had no capability of forming a covalent bond. We now consider a situation in which CYS forms both non-covalent and disulfide bonds. This will be denoted as mCYS – for modified CYS. Fig. 5 compares obtained for CYS and mCYS. It is seen that the replacement of CYS by mCYS increases nearly 50 times while it decreases only slightly. The widths of the potential wells stay about the same. shows undulations for CYS but no undulations for mCYS which suggests a smaller sensitivity to the density profiling of water. Fig. 6 shows the optimal conformation of mCYS bonded covalently with an S atom of ZnS – it is quite distinct to the non-covalent binding shown in panel a of Fig. 4.
The PMF has been obtained within the scheme of the umbrella sampling. We now consider MD without any steering elements in which either CYS or mCYS diffuse around. Over 13 % of the entire time of our simulation, is recognized as corresponding to adsorption of CYS which means that at least one of the CYS atoms is within 0.5 nm of the surface. Replacing CYS by mCYS increases the fraction of adsorption time to 82 %. In practice, once mCYS touches the surface it remains adsorbed for the rest of the simulations, however, spontaneous desorption may still occur. Thus our modeling of the covalent binding is fairly adequate.
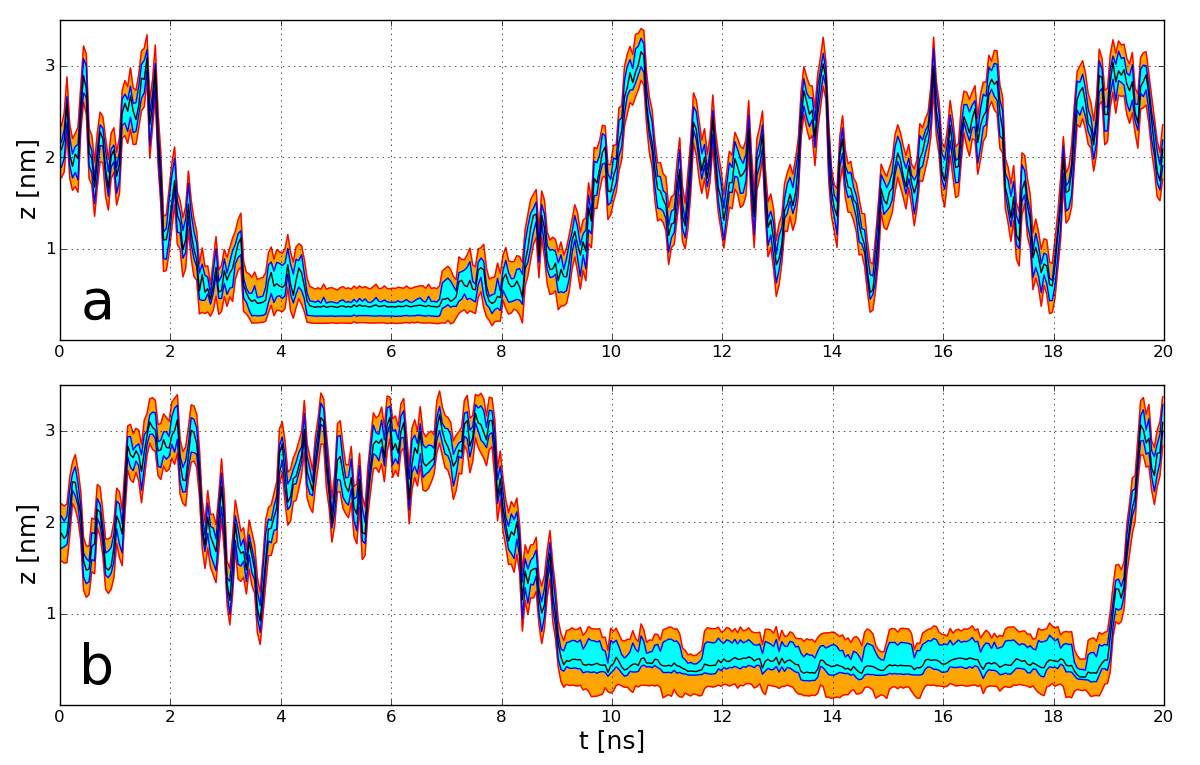
It is interesting to note that, in the absence of the disulfide bond, the conformation of adsorbed cysteine is stable and its orientation with respect to the surface is persistent (see Fig. 7). This is because CYS adheres to the surface with many atoms simultaneously, as shown in Fig. 4. With the covalent bond, however, the distances of the atoms from the surface are found to fluctuate more vigorously (the bottom panel of Fig. 7) and the conformations are more dynamic in nature. The reason for the different behavior is that the formation of the covalent bond induces a conformation, shown in Fig. 6, in which other parts of the molecule are further away from the solid. Thus the covalently bound molecule is more prone to the influence of water. This influence affects the optimal bonding length and angles and encourages desorption. More stabilization is expected to take place when CYS is a part of a protein.
III.4 Tryptophane cage near ZnS
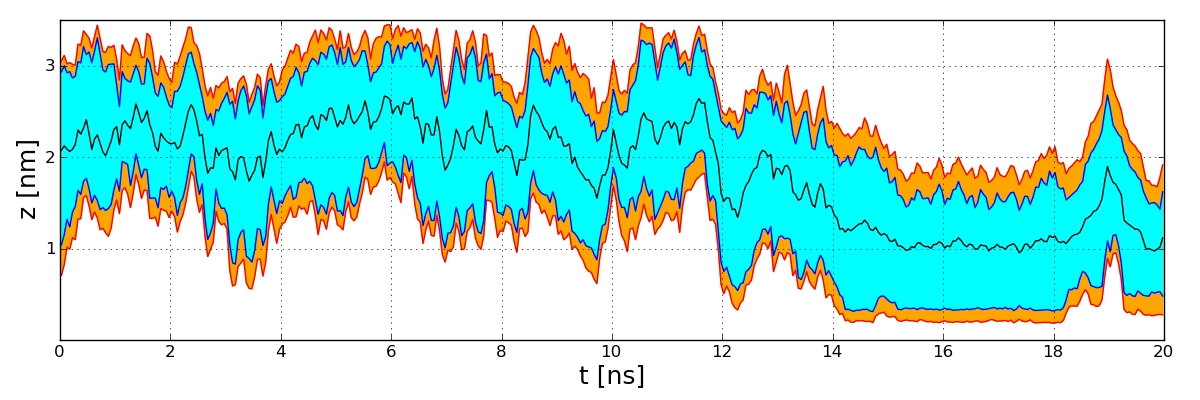
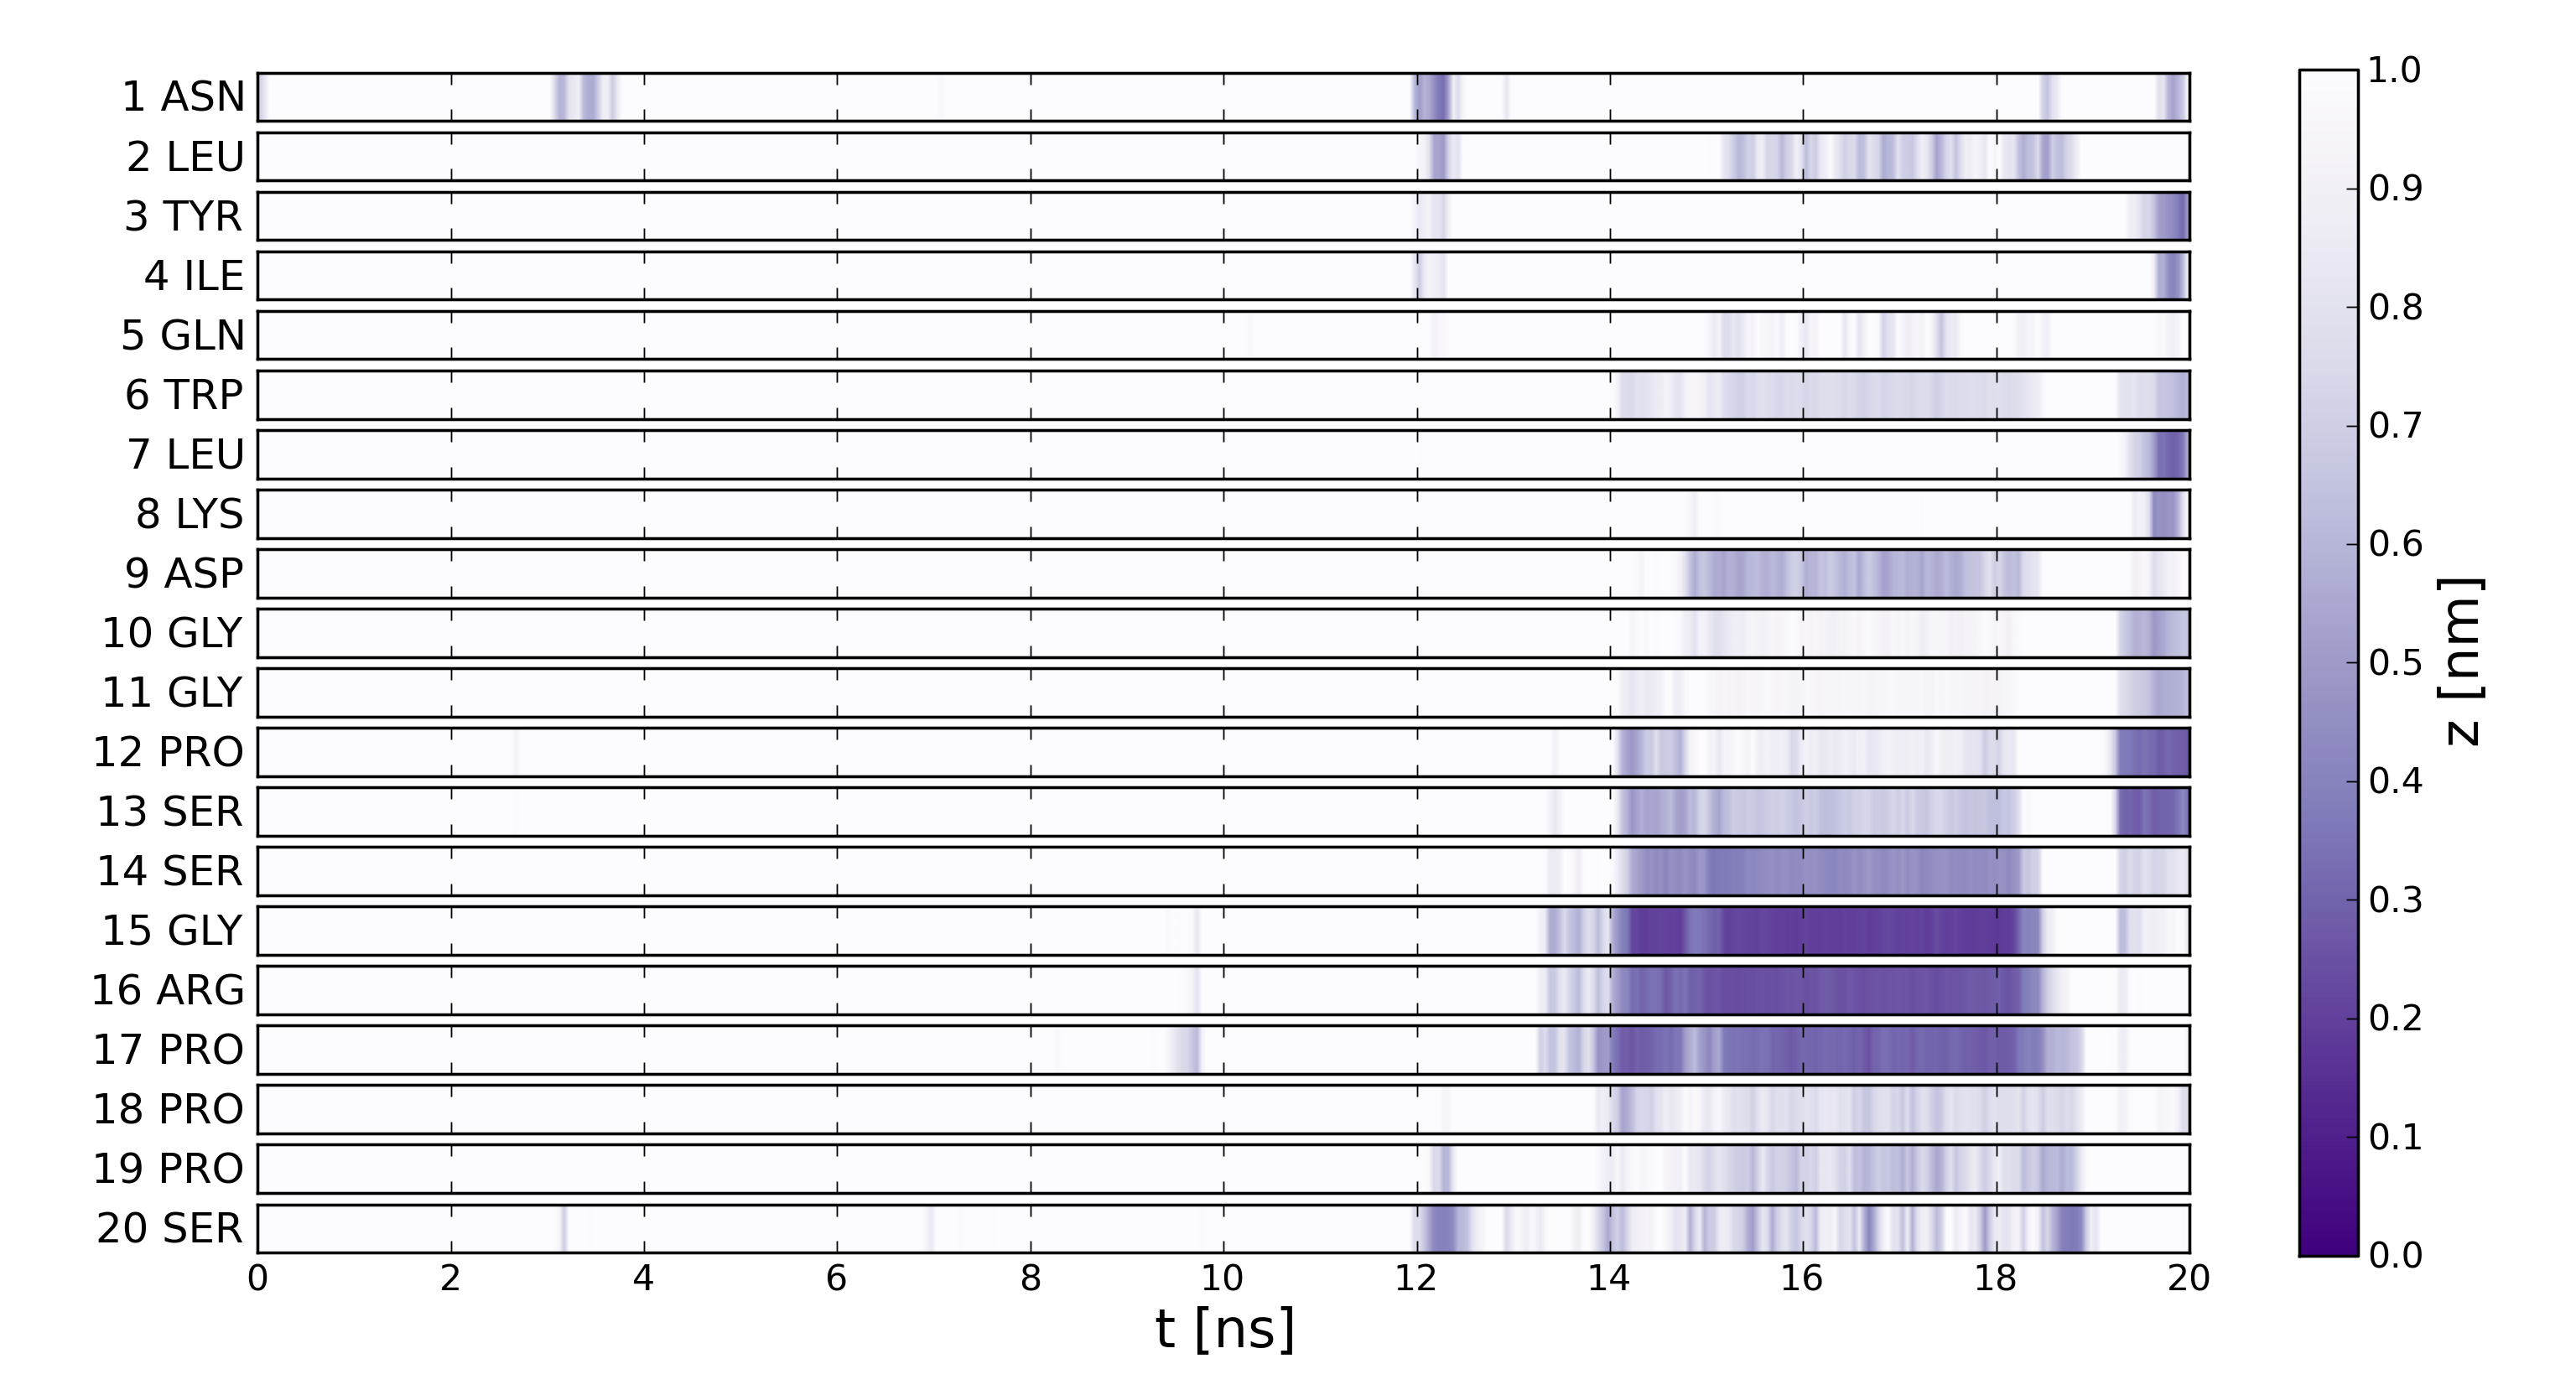
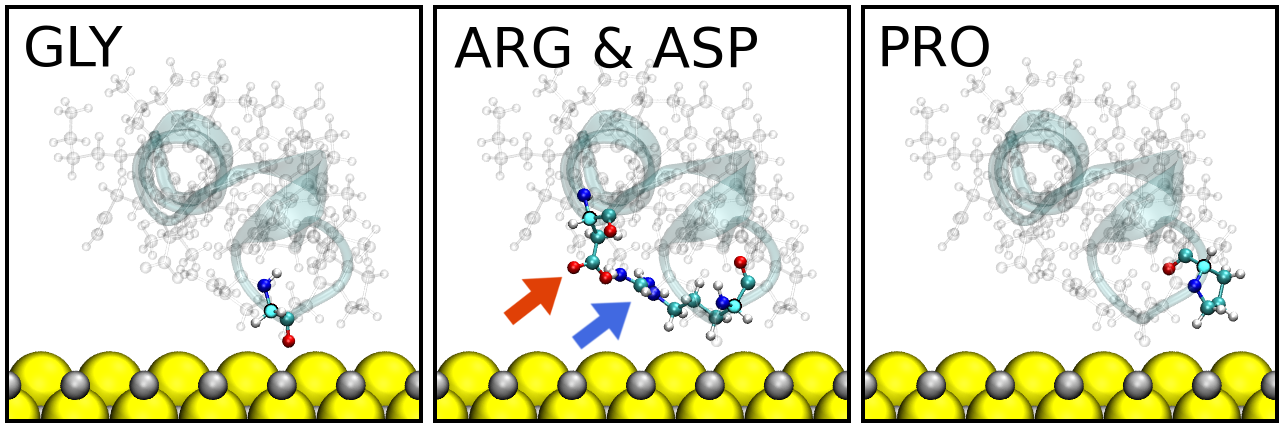
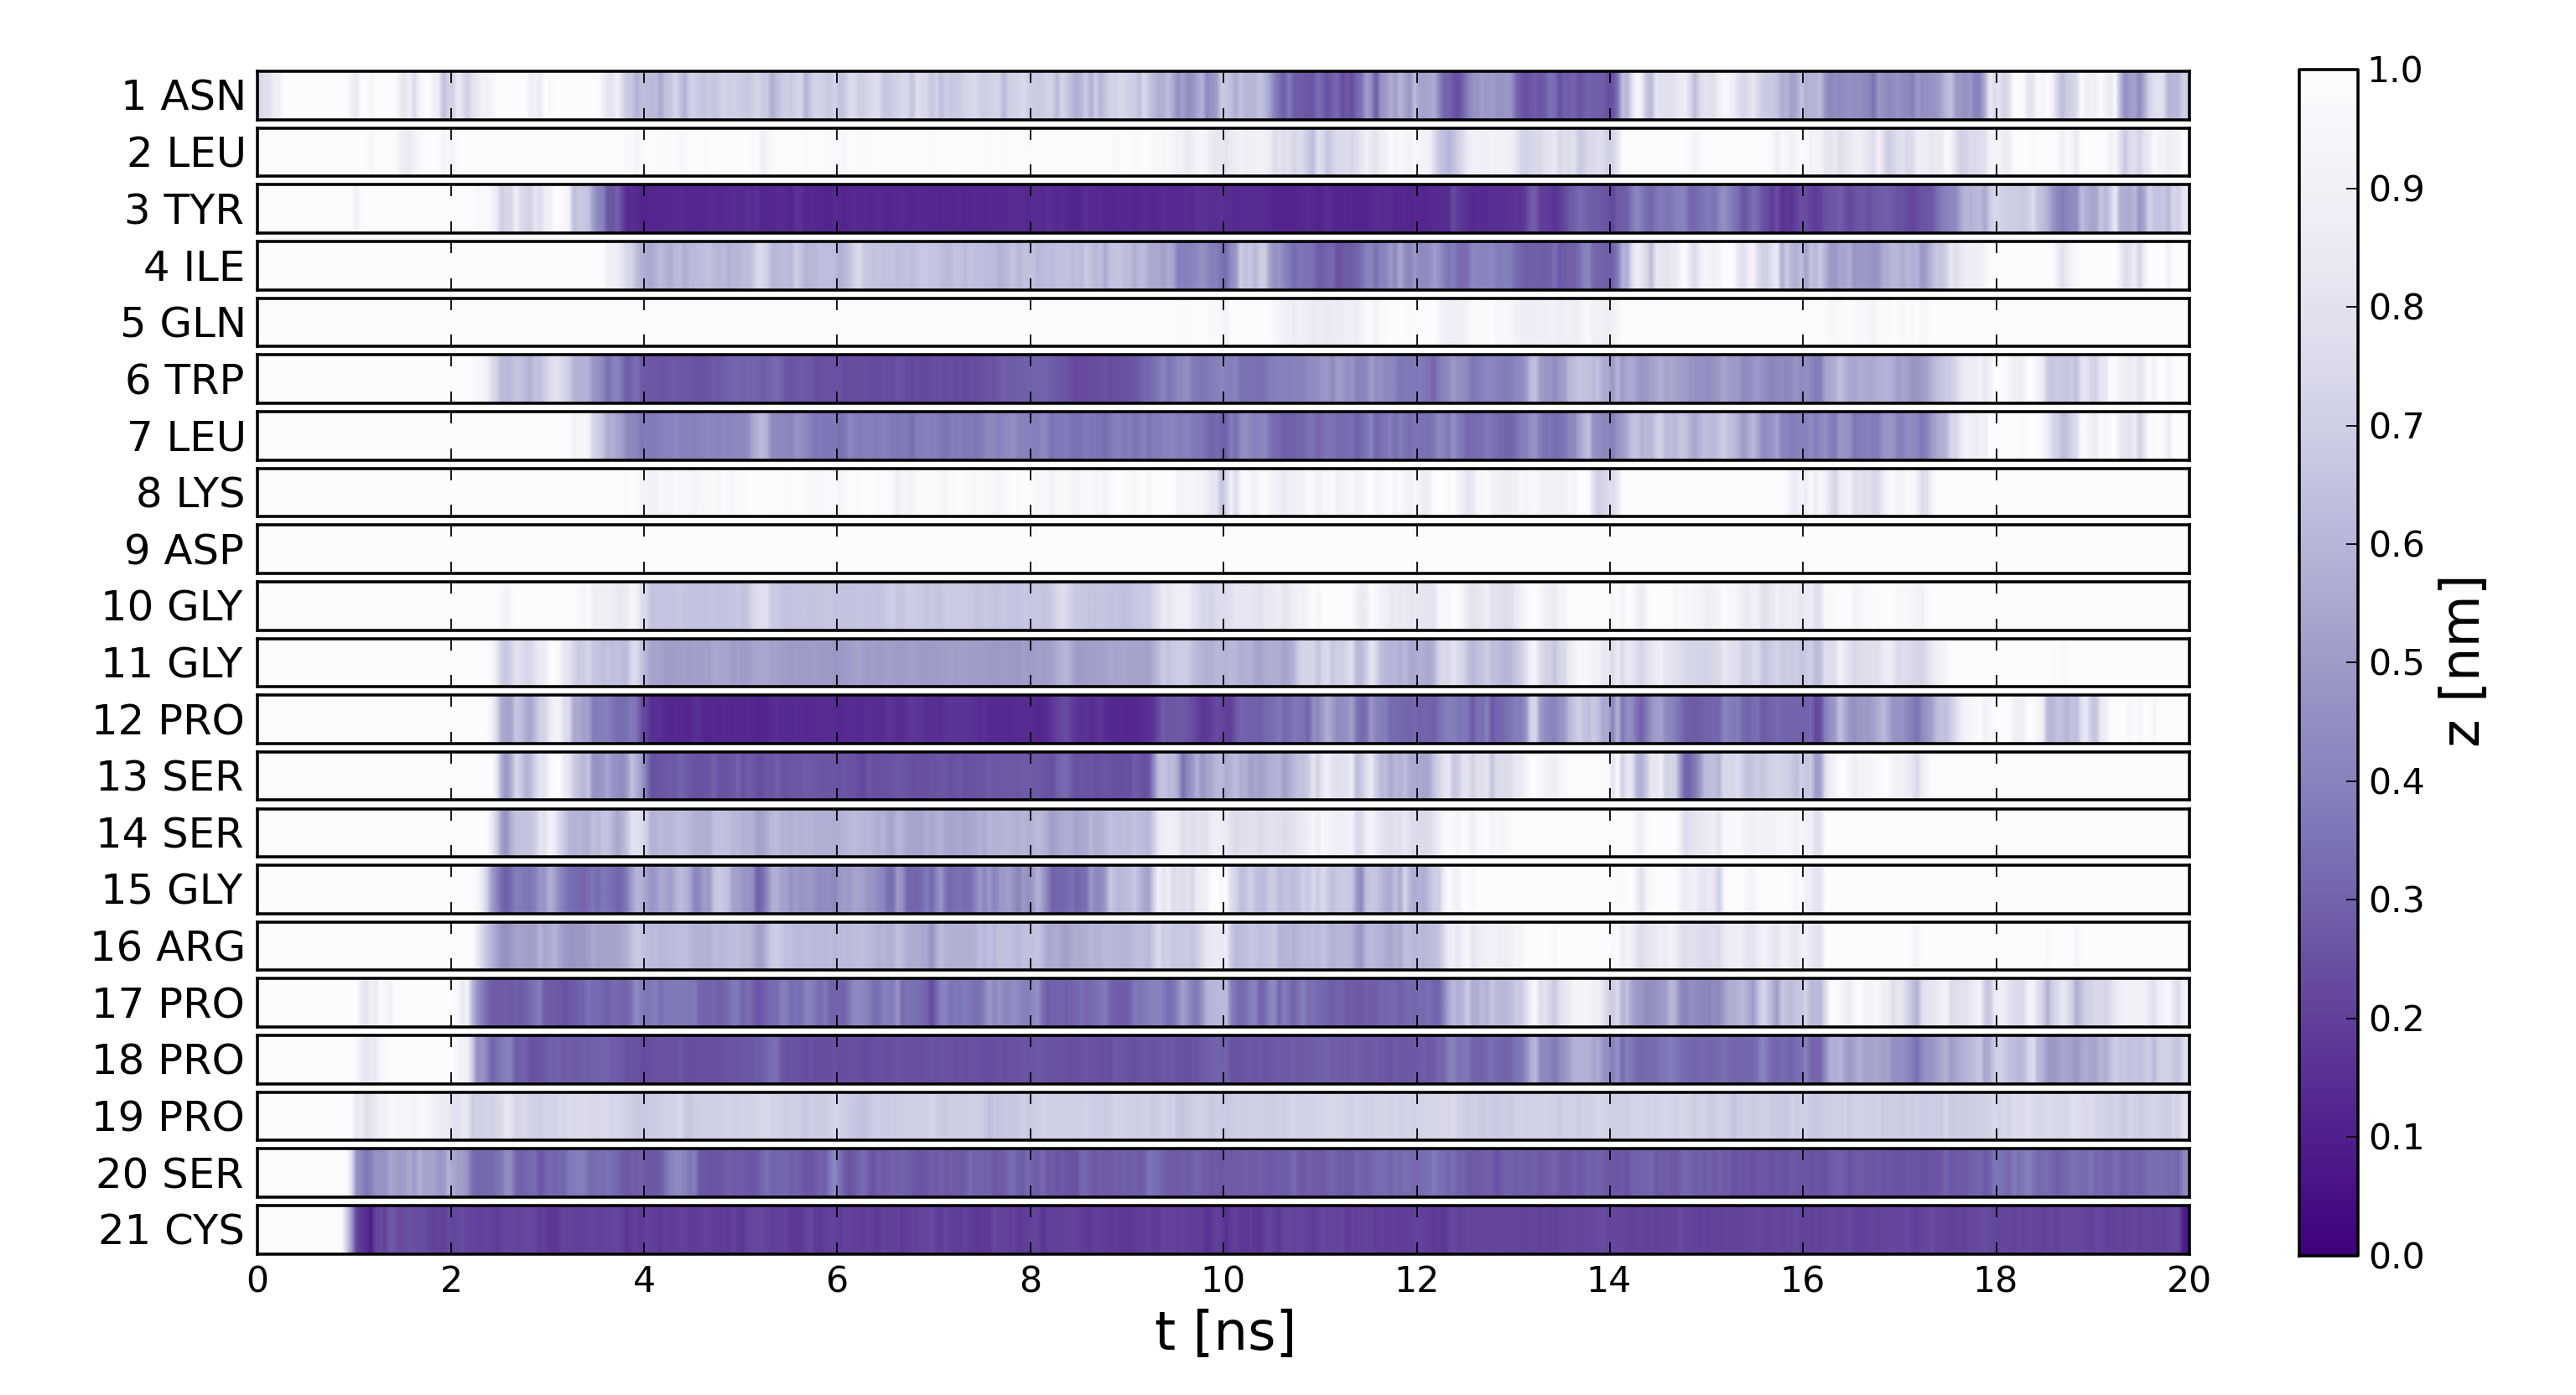
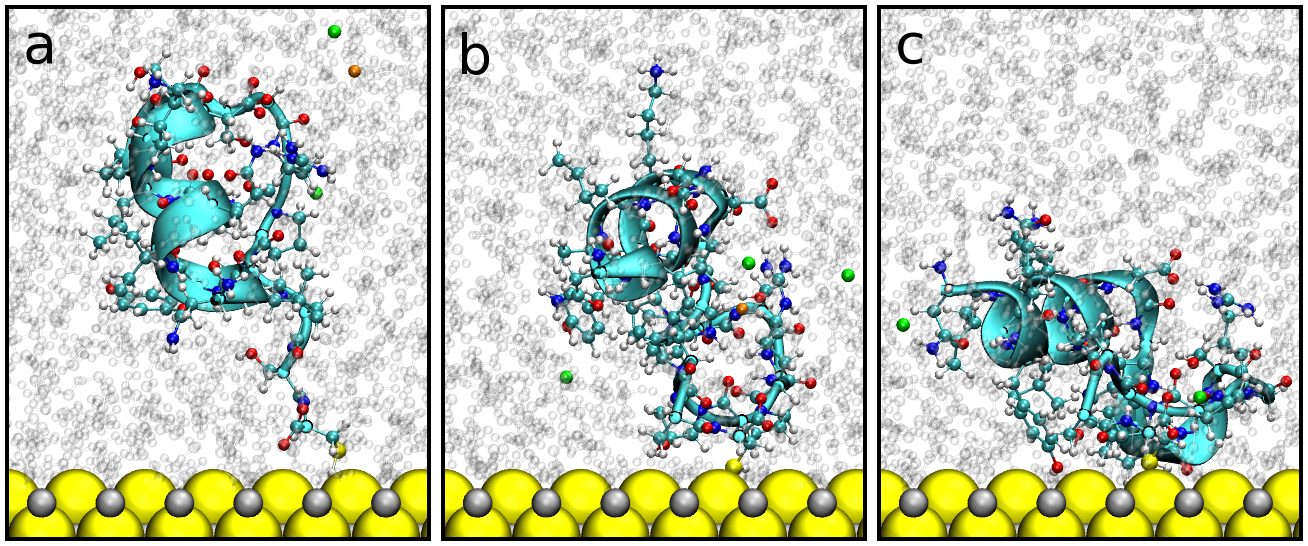
In view of the generally weak values of shown in Table 1, it is relevant to ask whether ZnS may lead to adsorption of a protein. We first consider tryptophane cage (the structure code is 1L2Y) without any CYS. This is a small protein as it comprises merely 20 AAs. Our unrestrained simulation of 1L2Y in water solution shows that adsorption does take place but it is intermittent and the events of adsorption are brief. One example of an adsorption event is shown in Fig. 8. Adsorption takes place between 14 and 18 ns and is driven mainly by three AAs: GLY, ARG and PRO (Fig. 9). None of them has been classified by us as being attracted to ZnS: ARG is repeled and GLY and PRO are neutral. However, the structure of the adsorbed protein suggests that the main driving force of adsorption comes from GLY, since the oxygen of its peptide bond substitutes one of water molecules in the direct interaction with Zn on the ZnS surface (Fig. 10). Nevertheless, also the hydrogen atoms of PRO cyclic stucture and of the ARG aliphatic chain interact with the sulfur atoms of the surface strengthening adsorption.
This observation suggests that interactions between AAs within a protein may affect conformations of the side groups and generate higher affinity to the surface compared to single AAs. In the example of Figs. 8 and 9, the positively charged guanidinium group of ARG gets burried within the surface of protein due to interactions with the negatively charged ASP placed further away from the surface (Fig. 10). Thus, ARG hides the group that would otherwise cause repulsion, and simultaneously exposes the aliphatic chain of high affinity. This means that the binding energy for single AAs should be treated rather as a suggestion about the orders of magnitudes – when designing proteins – than an exact guideline, especially when its value is low. Further analysis of the adsorbed protein shows that the interaction with the surface does not affect its structure and dynamics significantly.
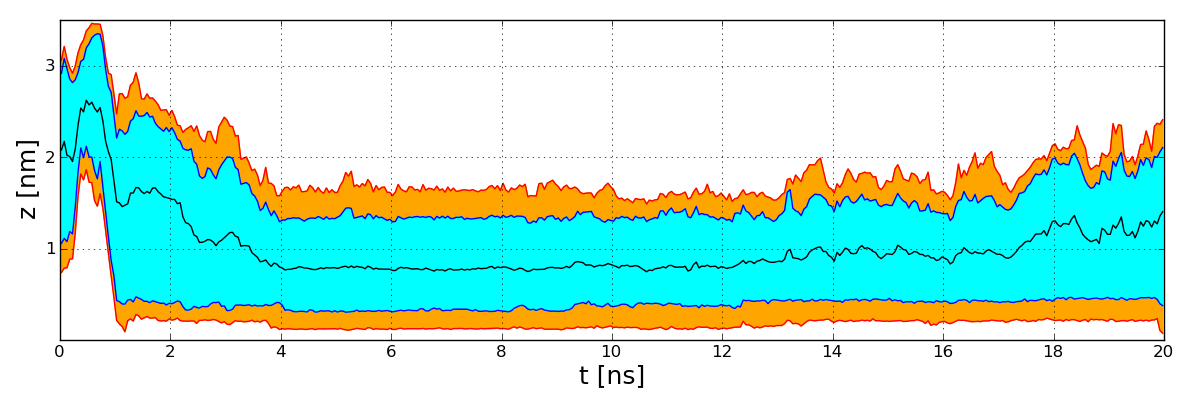
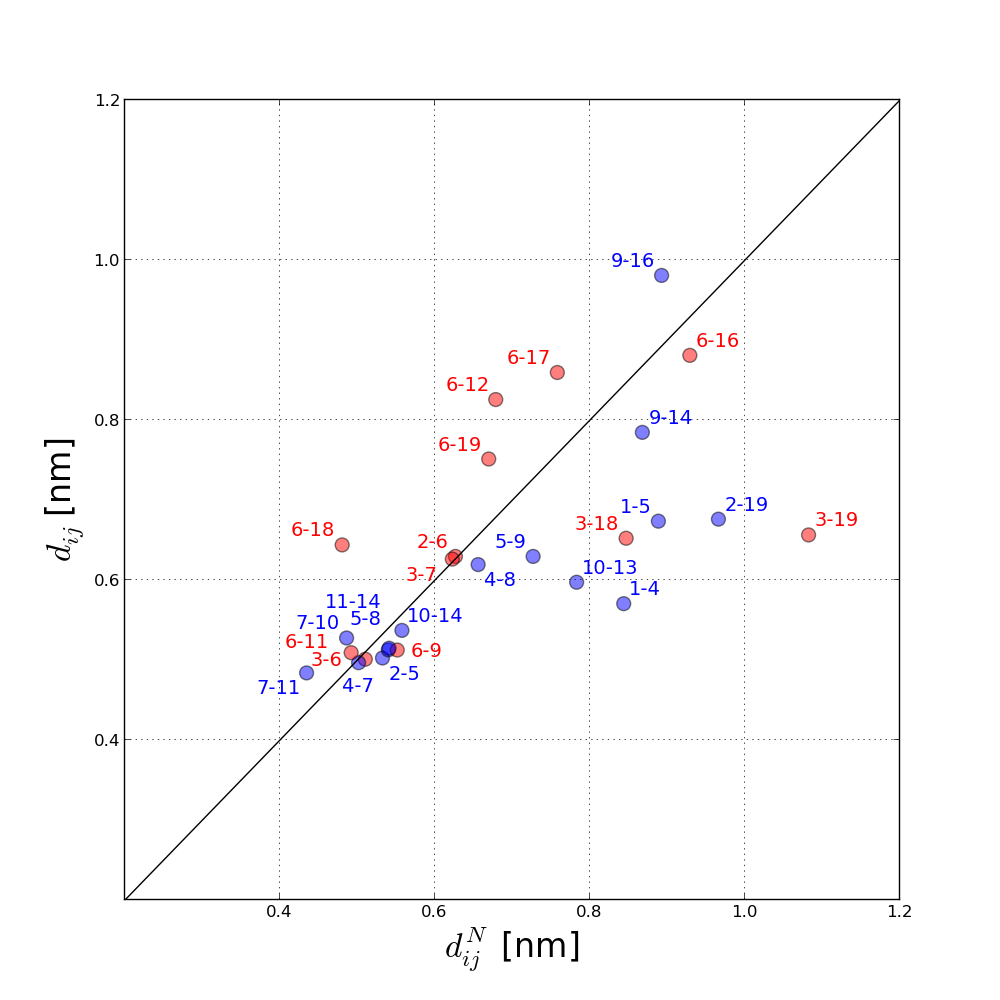
In order to investigate the role of mCYS in a protein adsorption we modify 1L2Y by attaching cysteine to its C-terminus. This modified 1L2Y is denoted here as m1L2Y. We have generated eight trajectories of m1L2Y evolving near the surface of ZnS in water solution. We observe occurrence of adsorption for about 54% of entire time (an example is shown in Fig. 11) and not merely 13% obtained for 1L2Y. A big portion of it (44 %) is due to the interactions with mCYS. Once m1L2Y makes a contact with the surface it generally stays adsorbed for the rest of the simulation. It detaches only occasionally. Furthermore, our analysis of the covalent bond dynamics reveals that its breakage is about 10 times rarer when the mCYS is a part of the protein rather than in isolation. This means that the presence of mCYS not only extends the adsorption time of the protein but it also extends the duration of the bond with mCYS. The latter can be a result of both the additional interactions with other AAs with the surface (see Fig. 12 and 13) and the stabilization of covalent bond by the protein. The enhanced stabilization comes from the larger moment of inertia of the protein and thus smaller influence of of water. Adsorption of m1L2Y to the surface of ZnS does not lead any significant deformation of the protein (see Fig. 13). This is similar to the case of the ZnO surface nawrocki_2013 but opposite to the case of the polar mica starzyk_2011 ; starzyk_2013 . The adsorption changes average distances in the native contacts by no more than 0.4 nm. This feature is illustrated in Fig. 14 where average contact distances are plotted against the native distances in the contacts – the outlying contact 3-19 is close to the surface. The native contacts are defined through the overlap of enlarged van der Waals spheres associated with the heavy atoms, as used in the dynamics of the Go-like models tsai_1999 ; sikora_2009 .
An alternative way to characterize the propensity for adsorption of a protein is through the PMF for the protein. We determine it by using the umbrella sampling, through the same procedure that we have applied for the capped AAs. We make independent runs that start by pulling 1L2Y towards the surface from various initial orientations. We note that the orientations can switch freely because the the protein is constrained only at its center of mass. Thus, the simulations lasting for a sufficiently long time should yield exactly the same PMF. However, achieving such a time scale and generating appropriate statistics is difficult even for the protein of merely 20 AAs. Here, we focus instead on a certain cutoff time range in which the the results are biased by the nature of the initial orientation.
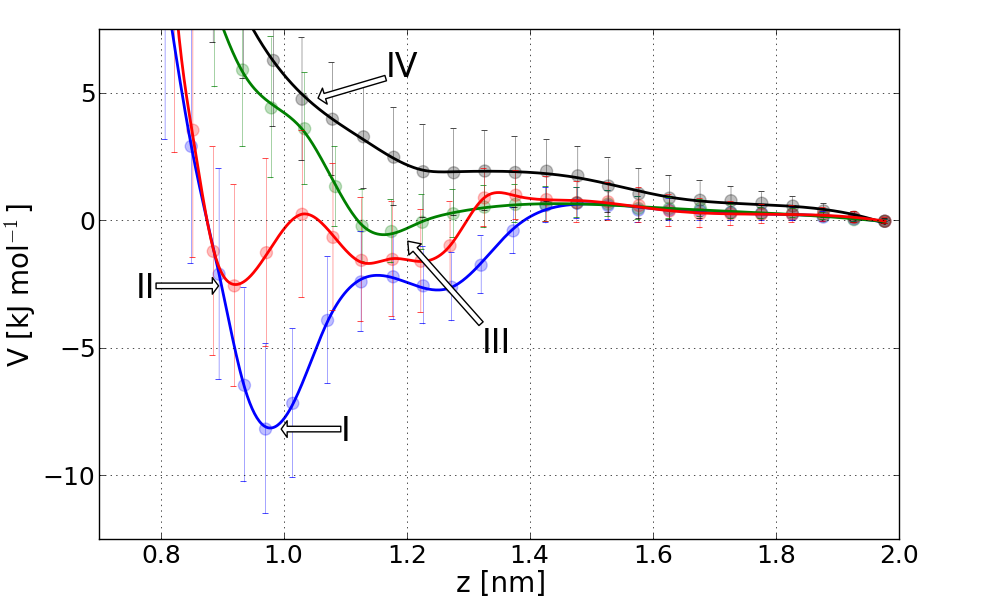
Fig. 15 shows four resulting plots of . The PMF denoted as I has a minimum at 8.1 kJ/mol. This energy is almost twice the corresponding to the strongest binding single AA (THR – 4.28 kJ/mol) if one excludes CYS. This suggests that various AAs combine to build strength of binding. On the other hand, the PMF denoted as IV corresponds to repulsion at all distances. The remaining PMFs, denoted as II and III, correspond to weak and very weak binding respectively.
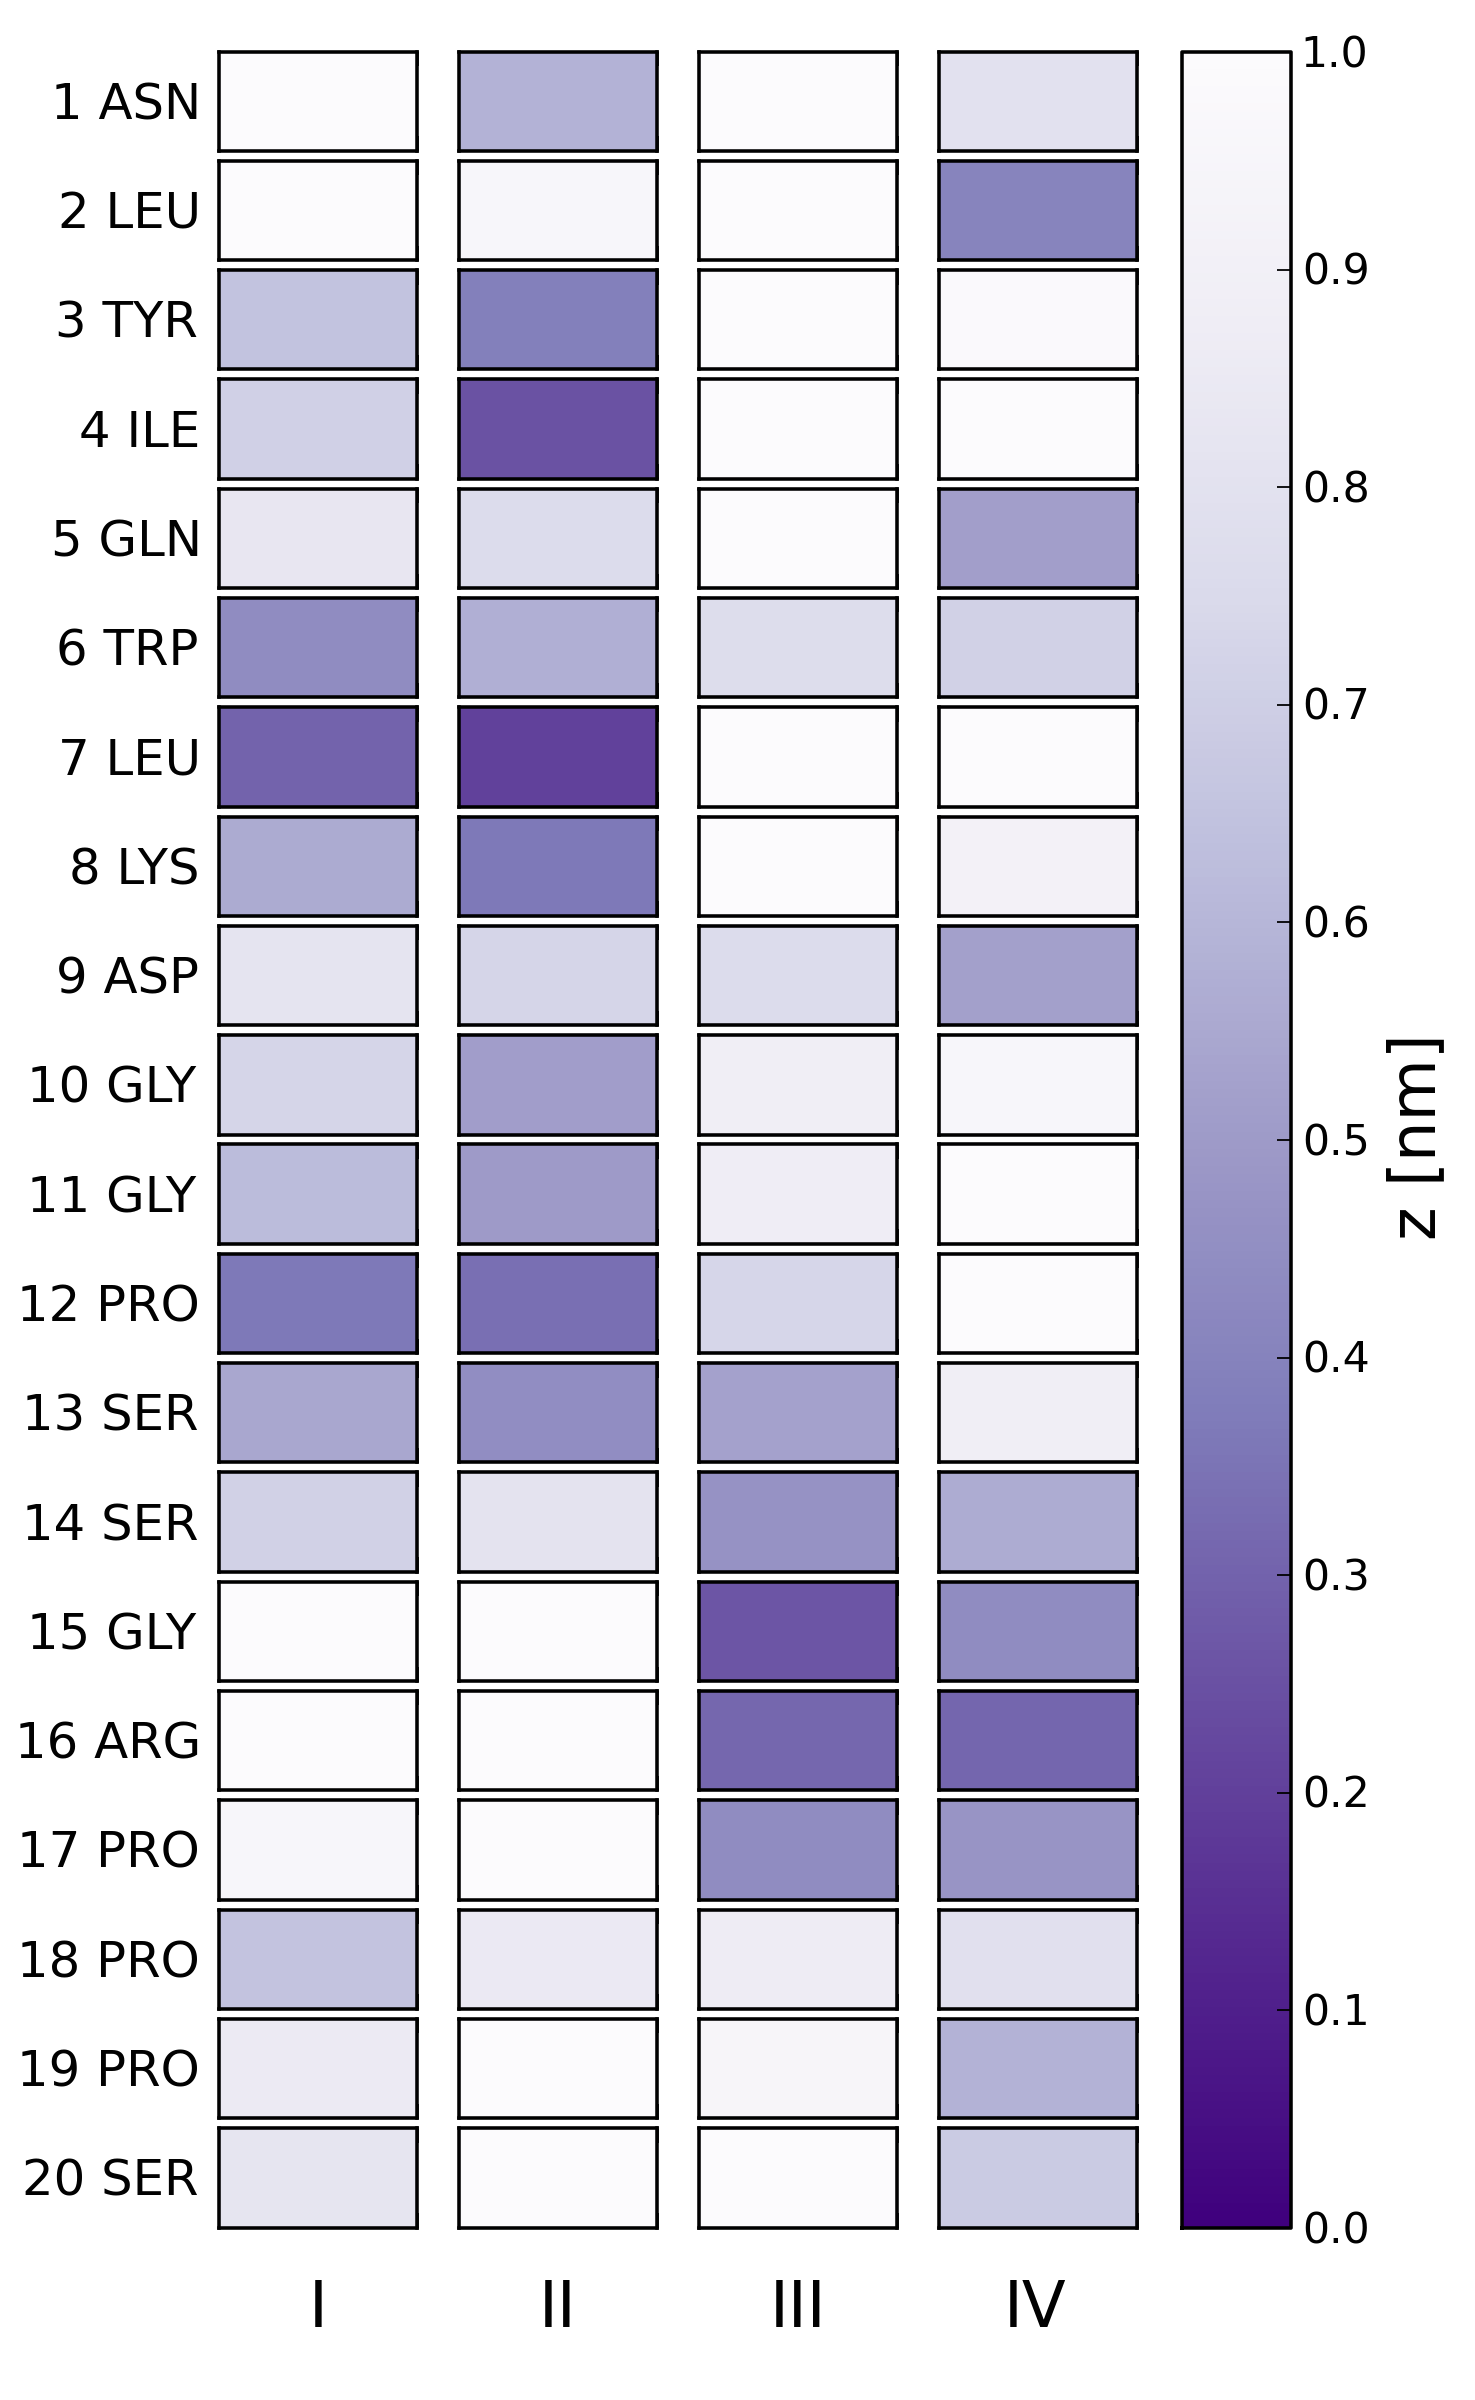
Fig. 16 shows examples of 1L2Y conformations near the minimal points in the of Fig. 15 (or at 1 nm for PMF IV). They are all quite distinct. In order to determine which AAs interact with the surface in each of the cases we calculate the average vertical positions of the lowest atoms of all AAs in the adsorbed protein. The results for the four potentials are displayed in Fig. 17. For I and II, the relevant AAs that are coupled to the solid are around LEU7 and PRO12. The latter has been already recognized as important in the free-evolution runs (Fig. 10). The main difference between I and II is that II also involves binding of ILE4 – and yet the resulting is observed to be higher. In case III, binding moves up the sequence to the vicinity of GLY15. There is no effective binding in case IV but the AA which is closest to the solid is ARG16.
IV Summary
The main result of our studies is that the energies of binding of AAs to ZnS (110) surface are similar in magnitude to those to the four faces of ZnO. However the aspects of specificity are different. For instance, THR which binds to ZnS the strongest does not bind to three faces of ZnO and binds only very weakly to the fourth one (to (000)-Zn). This is because the crystal structures are distinct and the water density profiles are quite different. The binding strength is comparable to that provided by hydrogen bonds in proteins. The exception is cysteine for which formation of the disulfide bond with an atom of S in the solid increases the binding strength by an order of magnitude. The covalent binding also increases the duration of the adsorption events in the model. This is in a qualitative agreement with experimental studies of peptides that bind to the ZnS particles. For instance, Pinaud pinaud_2004 have shown that the replacement CYS by ALA results in formation of particles that are insoluble in water because the coverage by the peptides is reduced significantly. Gondikas et gondikas_2010 have observed that SER does not adsorb in appreciable amounts to the particle surfaces but CYS does. Thus SER, unlike CYS, does not appear to alter effective surface properties of ZnS. A further exploration of the protein-solid interactions appears to be important for making progress in bio-nanotechnology.
Acknowledgments Discussions with D. Elbaum, J. Grzyb and B. Różycki are warmly appreciated. This work has been supported by the Polish National Science Centre Grants No. 2011/01/B/ST3/02190 (MC and GN) and N N202 130039 (GN) as well as by the European Union within European Regional Development Fund, through Innovative Economy grant (POIG.01.01.02-00-008/08). The local computer resources were financed by the European Regional Development Fund under the Operational Programme Innovative Economy NanoFun POIG.02.02.00-00-025/09. We appreciate help of A. Koliński and A. Liwo in providing additional computer resources such as at the Academic Computer Center in Gdańsk.
References
- (1) A. I. Ekimov and A. A. Onushchenko, JETP Lett. 34, 345 (1981).
- (2) M. A. Reed, J. N. Randall, R. J. Aggarwal, R. J. Matyi, T. M. Moore, and A. E. Wetsel, Phys. Rev. Lett. 60, 535 (1988).
- (3) W. Y. Liang, Phys. Educ. 5, 226 (1970).
- (4) Y. Wang and L. Chen, Nanomedicine, 7, 385 (2011).
- (5) M. A. Walling, J. A. Novak and J. R. E. Shepard, Int. J. Mol. Sci. 10, 441 (2009).
- (6) M. F. Frasco and N. Chaniotakis, Sensors 9, 7266 (2009).
- (7) P. Reiss, M. Protiere and L. Li, Small 5, 154 (2009).
- (8) J. Wang, S. Han, D. Ke and R. Wang, Nanomedicine 3, 83 (2008).
- (9) B. O. Dabbousi, J. Rodriguez-Viejo, F. V. Mikulec, J. R. Heine, H. Mattoussi, R. Ober, K. F. Jensen and M. G. Bawendi, J. Phys. Chem. B 101, 9463 (1997).
- (10) U. Soni and S. Sapra, J. Phys. Chem. C 114, 22514 (2010).
- (11) L. Cao, S. Huang, S. Lu, J. Lin, J Colloid Interface Sci. 284, 516 (2005).
- (12) M. Q. Zhu, E. Chang, J. Sun and R. A. Drezek, J. Mater. Chem. 17, 800 (2007).
- (13) X. Zhang, S. Mohandessi, L. W. Millera and P. T. Snee, Chem. Commun. 47, 3532 (2011).
- (14) V. Brunetti, H. Chibli, R. Fiammengo, A. Galeone, M. A. Malvindi, G. Vecchio, R. Cingolani, J. L. Nadeaub and P. P. Pompa, Nanoscale 5, 307 (2013).
- (15) M. Hoefling, F. Iori, S. Corni and K. E. Gottschalk, Langmuir 26, 8347 (2010).
- (16) A. V. Verde, J. M. Acres and J. K. Maranas, Biomacromolecules 10, 2118 (2009).
- (17) E. R. Cruz-Chu, A. Aksimentiev and K. Schulten J. Phys. Chem. B 110, 21497 (2006).
- (18) G. Forte, A. Grassi and G. Marletta J. Phys. Chem. B 111, 11237 (2007).
- (19) S. Monti and T. R. Walsh, J. Phys. Chem. C 114, 22197 (2010).
- (20) Y. K. Gao, F. Traeger, O. Shekhah, H. Idriss and C. Woll, J. Coll. Interf. Sci. 338, 16 (2009).
- (21) G. Nawrocki and M. Cieplak, Phys. Chem. Chem. Phys. 15, 13628 (2013).
- (22) R. A. Sperling and W. J. Parak, Phil. Trans. R. Soc. A 368, 1333 (2010).
- (23) S. Kumar, M. Singhal and J. K. Sharma, J. Mater. Sci 24, 3875 (2013).
- (24) W. Baea and R. K. Mehra, J. Inorg. Biochem. 70, 125 (1998).
- (25) F. Pinaud, D. King, H. P. Moore and S. Weiss, J. Am. Chem. Soc. 126, 6115 (2004).
- (26) Y. Li, J. Chen, C. Zhu, L. Wang, D. Zhao, S. Zhuo and Y. Wu, Spectrochim Acta A Mol Biomol Spectrosc. 60, 1719 (2004).
- (27) S. R. Whaley, D. S. English, E. L. Hu, P. F. Barbara and A. M. Belcher, Nature 405, 665 (2000).
- (28) M. Bachmann, K. Goede, A. G. Beck-Sickinger, M. Grundmann, A. Irback and W. Janke, Angew. Chem. Int. Ed. 49, 9530 (2010).
- (29) N. Yokoo, T. Togashi, M. Umetsu, K. Tsumoto, T. Hattori, T. Nakanishi, S. Ohara, S. Takami, T. Naka, H. Abe, I. Kumagai and T. Adschiri, J. Phys. Chem. B 114, 480 (2010).
- (30) J. Grzyb Acta Physica Polonica A 122, 279 (2012).
- (31) E. E. Oren, C. Tamerler and M. Sarikaya, Nano Lett. 5, 415 (2005).
- (32) S. Kumar, D. Bouzida, R. H. Swendsen, P. A. Kollman and J. M. Rosenberg, J. Comp. Chem. 13, 1011 (1992).
- (33) J. A. Lemkul and D. R. Bevan, J. Phys. Chem. B 114, 1652 (2010).
- (34) L. B. Wright and T. R. Walsh, J. Phys. Chem. C 116, 2933 (2012).
- (35) V. A. Basiuk and T. Y. Gromovoy, Adsorption 2, 145 (1996).
- (36) R. B. Pandey, Z. Kuang and B. L. Farmer, PLOS ONE 8, e70847 (2013).
- (37) R. B. Pandey and B. L. Farmer, J. Chem. Phys. 139, 164901 (2013).
- (38) D. Van der Spoel, E. Lindahl, B. Hess, G. Groenhof, A. E. Mark and H. J. C. Berendsen, J. Comp. Chem. 26, 1701 (2005).
- (39) Y. Duan, C. Wu, S. Chowdhury, M.C. Lee, G. Xiong, W. Zhang, R. Yang, P. Cieplak, R. Luo, T. Lee, J. Caldwell, J. Wang, and P. Kollman, J. Comp. Chem. 24, 1999 (2003).
- (40) W. L. Jorgensen, J. Chandrasekhar, J. D. Madura, R. W. Impey and M. L. Klein, J. Chem. Phys. 79, 926 (1983).
- (41) D. R. Lide, CRC Handbook of Chemistry and Physics 90th edition (CRC Press: Cleveland, Ohio, 2009).
- (42) H. E. Swanson and R. K. Fuyat, Natl. Bur. Stand. Circ. (U. S.) 2, 25 (1953).
- (43) P. W. Tasker, J. Phys. C: Solid State Phys. 12, 4977 (1979).
- (44) U. Essmann, L. Perera, M. L. Berkowitz, T. Darden, H. Lee and L. G. Pedersen, J. Chem. Phys. 103, 8577 (1995).
- (45) H.Q. Xie, Y. Zeng, W.Q. Huang, L. Peng, P. Peng and T.H. Wang, Int. J. Phys. Sci. 5, 2672 (2010).
- (46) N. Dragneva, W. B. Floriano, D. Stauffer, R. C. Mawhinney, G. Fanchini, and O. Rubel, J. Chem. Phys. 139, 174711 (2013).
- (47) J. G. Kirkwood, J. Chem. Phys. 3, 300 (1935).
- (48) B. J. Hess, J. Chem. Phys. 116, 209 (2002).
- (49) H. Zhang, J. R. Rustad and J. F. Banfield, J. Phys. Chem. A 111, 5008 (2007).
- (50) C. I Chang, W. J. Lee, T. F. Young, S. P. Ju, C. W. Chang, H. L. Chen, J. G. Chang J. Chem. Phys. 128, 154703 (2008).
- (51) S. R. V. Castrillo, N. Giovambattista, I. A. Aksay and P. G. Debenedetti, J. Phys. Chem. B 113, 1438 (2009).
- (52) M. Cieplak, J. Koplik, J. R. Banavar, Physica A 274, 281 (1999).
- (53) M. Cieplak, J. Koplik, and J. R. Banavar, Physica A 287, 153 (2000).
- (54) J. Feng, R. B. Pandey, R. J. Berry, B. L. Farmer, R. R. Naikc and H. Heinz, Soft Matter 7, 2113 (2011).
- (55) A. Starzyk and M. Cieplak, J. Chem. Phys., 2011, 135, 235103.
- (56) A. Starzyk and M. Cieplak, J. Chem. Phys. 139, 045102 (2013).
- (57) J. Tsai, R. Taylor, C. Chothia and M. Gerstein, J. Mol. Biol. 290, 253 (1999).
- (58) M. Sikora, J. I. Sułkowska and M. Cieplak, PLoS Comp. Biol. 5, e1000547 (2009).
- (59) A.P. Gondikas, E.K. Jang and H. Hsu-Kim, J. Colloid Interface Sci. 347, 167 (2010).
- (60) D. Elbaum, private communication (2013).
- (61) A. Baranowska-Korczyc, PhD thesis, “Semiconducting sensors based on electrospun fibers,” 2012, Institute of Physics, PAS, Warsaw, Poland, supervised by D. Elbaum.
| [kJ/mol] | [nm] | |
| ASP | ||
| GLU | ||
| CYS | 1.77 | 0.43 |
| mCYS | 98.35 | 0.40 |
| ASN | 0.79 | 0.50 |
| PHE | 1.52 | 0.51 |
| THR | 4.28 | 0.44 |
| TYR | 3.06 | 0.53 |
| GLN | 0.58 | 0.50 |
| SER | 1.95 | 0.43 |
| MET | ||
| TRP | 0.55 | 0.62 |
| VAL | 2.11 | 0.45 |
| LEU | 1.45 | 0.49 |
| ILE | 1.77 | 0.50 |
| GLY | 0.32 | 0.45 |
| ALA | 0.28 | 0.47 |
| PRO | 0.41 | 0.56 |
| HIE | 1.19 | 0.55 |
| HID | 3.06 | 0.45 |
| HIP | 0.38 | 0.80 |
| LYS | ||
| ARG | ||
| average and dispersion without mCYS | 1.49 1.07 | 0.50 0.06 |
| average and dispersion with mCYS | 7.55 23.47 | 0.49 0.06 |