High Energy Electron Confinement in a Magnetic Cusp Configuration
Abstract
We report experimental results validating the concept that plasma confinement is enhanced in a magnetic cusp configuration when (plasma pressure/magnetic field pressure) is of order unity. This enhancement is required for a fusion power reactor based on cusp confinement to be feasible. The magnetic cusp configuration possesses a critical advantage: the plasma is stable to large scale perturbations. However, early work indicated that plasma loss rates in a reactor based on a cusp configuration were too large for net power production. Grad and others theorized that at high a sharp boundary would form between the plasma and the magnetic field, leading to substantially smaller loss rates. The current experiment validates this theoretical conjecture for the first time and represents critical progress toward the Polywell fusion concept which combines a high cusp configuration with an electrostatic fusion for a compact, economical, power-producing nuclear fusion reactor.
I Background
The use of magnetic fields to confine high temperature plasmas has been one of the main pathways pursued in controlled thermonuclear fusion research since the 1950s. Several magnetic field configurations such as magnetic pinch, stellarator, magnetic mirror, and tokamak, have been explored to achieve net power generation from fusion reactionsBishop (1958); Tuck (1960); Wesson (2011). However, one of the critical technical challenges related to magnetically confined fusion devices is the plasma instability inside the confining magnetic fields. For example, magnetohydrodynamic (MHD) instabilities driven by plasma current or plasma pressure such as kink and Rayleigh-Taylor instabilities can abruptly disrupt the plasma confinement by tearing apart confining magnetic fields and expelling the plasma. Such plasma instabilities limit the maximum operating plasma current or pressure in the device and increase the reactor size required to achieve net fusion power. Moreover, a large engineering safety margin is typically required to prevent reactor failure in the event of a major disruption, increasing engineering complexities and reactor cost.
In comparison, the magnetic cusp configuration provides excellent macroscopic plasma stability due to the convex magnetic field curvature towards the confined plasma system in the center, as shown in Figure 1A.Bishop (1958); Tuck (1960); Grad (1955) Experiments on the cusp field configuration have confirmed the stability property, even at very high plasma pressures up to .Spalding (1971); Haines (1977) Plasma beta, , is defined as the ratio of plasma pressure to confining magnetic field pressure, , where is the plasma pressure, is the magnetic permeability, and is the magnetic flux density. Since the fusion power output scales as for a given magnetic field, high operation is advantageous for a compact economical fusion reactor. In comparison, the design parameter for the International Thermonuclear Experimental Reactor (ITER), a proposed tokamak device to achieve a net fusion power output, is .ITER Physics Basis Editors et al. (1999)
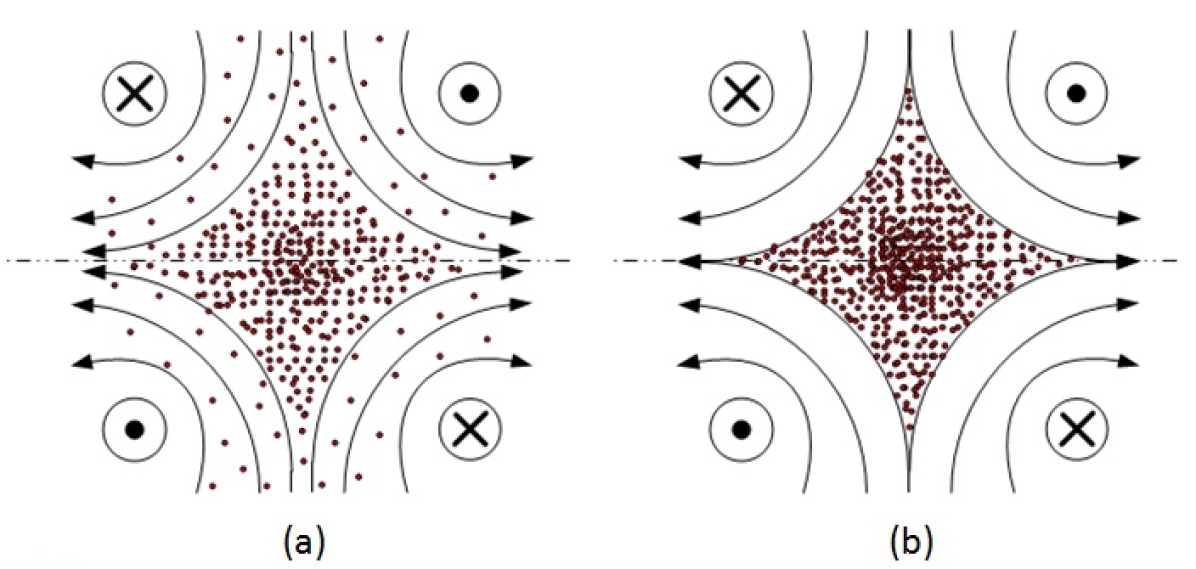
Substantial theoretical and experimental efforts were devoted to investigating the magnetic cusp configuration.Bishop (1958); Wesson (2011); Grad (1955) Initial results, however, showed poor plasma confinement.Bishop (1958) This was thought to be related to the open magnetic field structure and rapid mirror-like plasma loss in a low cusp. Grad and others predicted theoretically that the plasma confinement properties of the cusp configuration would be greatly enhanced if the magnetic field exhibits a sharp boundary separating the field-free high plasmas and the vacuum region with magnetic fields, as shown in Figure 1B.Bishop (1958); Berkowitz et al. (1958) Equation 1 describes the theoretically estimated plasma loss rate for the cusp system in Figure 1B.Berkowitz et al. (1958) The physical idea behind Equation 1 is as follows: When is large there is a sharp transition between the confined plasma and the confining magnetic field. Plasma approaching this transition layer reflects back into the confined volume. Eventually, however, a plasma particle after many reflections will move almost exactly in the direction of the cusp opening, and will be lost. Grad conjectured that this loss hole will have a radius equal to the electron gyro-radius, as shown in Equation 1. By contrast, when is small in the cusp, the transition region is the size of the confined volume, and plasma approaching the boundary attaches to field lines, and streams out the cusp. This loss rate is related to the plasma loss rate in a magnetic mirror and is much larger than the rate given in Equation 1.Krall et al. (1995)
Equation 1: Electron and ion loss rate for a single cusp during high plasma state
| (1) |
where is the loss current, is the electron charge, is the density, is the velocity, is the local gyro-radius at the cusp location, and subscript and denote electron and ion species respectively.
Though several experiments were constructed to validate this conjecture, two critical issues limited their efforts.Spalding (1971); Haines (1977); Marshall (1960); Pechacek et al. (1980) The first issue was the engineering and technical challenge related to initially forming a high plasma, where a required initial injection power is on the order of 100 MW or more. The second issue was the theoretical and experimental difficulty in determining the plasma loss rate in a high plasma state. It was accepted that if the loss rate is determined by the ion gyro-radius, it would be unacceptably large for a fusion power reactor. Experiments seemed to indicate that the ion gyro-radius did indeed dominate the loss rate.Pechacek et al. (1980) Because of these problems, the concept of a fusion power reactor based on a cusp magnetic field was largely abandoned, until a new idea, discussed in the next section, was proposed that retains the advantages of cusp confinement, but removes the issue of the ion gyro-radius dominating the loss rates.
II The Polywell Fusion Concept
In 1985, Bussard introduced a fusion concept, the “Polywell” reactor, which combines the magnetic cusp configuration with the inertial electrostatic confinement (IEC) fusion concept.Bussard (1991); Krall (1992); Bussard (2006) In the Polywell reactor, electrons are confined magnetically by a cusp field while ions are confined by an electrostatic potential well produced by electron beam injection. The use of an electron beam provides two critical advantages for the Polywell reactor over other magnetic cusp devices. The excess electrons from the beam form an electrostatic potential well.Farnsworth (1968); Hirsch (1967); Elmore et al. (1959) By utilizing an electrostatic potential well, the Polywell reactor employs a highly efficient method to accelerate ions to high energies for fusion. In addition, the potential well reduces ion kinetic energy as the ions travel outward toward the cusp exits. This results in electrostatic confinement of ions as well as reduction in the ion loss rate given in Equation 1. In a Polywell reactor, the main issues of high temperature plasma containment and plasma heating are thus reduced to the confinement property of the injected electron beam. In work to date, a deep potential well was formed and maintained in a cusp field.Krall et al. (1995) But that work was limited by the high loss rates typical of a low beta cusp confined plasma. To progress further it is necessary to show that electron confinement is enhanced at high , as conjectured by Grad and others.
III Confinement Measurement at High
In this paper, we present the first experimental confirmation of the idea that confinement of injected electron beam by a magnetic cusp is enhanced in a high plasma state. Figure 2 shows the experimental setup based on a hexahedral, or 6-coil, Polywell system. Two high power pulsed co-axial plasma guns are used to inject plasma to form a high plasma in the interior of the cusp configuration. An electron beam injector is based on lanthanum hexaboride () thermionic emitter and produces 1–3 A of electron current at 7 keV beam energy. The plasma guns produce the high condition and the electron beam measures the confinement property.
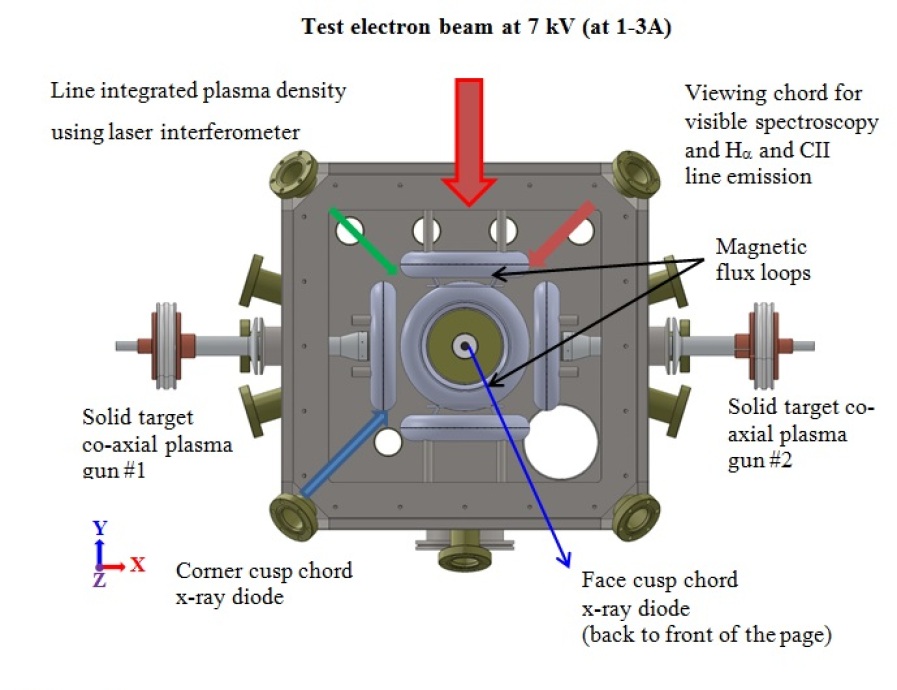
The confinement of the injected electron beams is measured by x-ray diodes via electron beam induced Bremsstrahlung. Improved confinement should lead to a higher density of high energy beam electrons, which would give a stronger x-ray signal. Other plasma diagnostics include a) line integrated laser interferometry for plasma density, b) two magnetic flux loops for plasma diamagnetism, c) time resolved visible light emission spectroscopy for plasma ion composition and plasma density, and d) two visible photodiodes for H and C II line emission intensities. Further details are available in the Supplementary Methods section below.

Figure 3 shows a time integrated visible image of a high plasma in the cusp system and Figure 4 shows time resolved experimental results from the various diagnostics from a high shot, 15640. The coils are energized 40 ms prior to plasma injection and the coil currents are kept at a constant value during the time period shown in Figure 4, with the B-field value of at the cusp points near the plasma guns. In addition, the electron beam is turned on 30 s before gun plasma injection and operates with 3 A of injection current at 7.2 kV until t=150 s. At t=0, two co-axial plasma injectors are switched on with 700 MW combined peak input power for 7 s. Despite ringing in the underdamped gun circuit, the plasma injection provides high density plasma in the cusp system with a rapid rise and a gradual decay as measured by a heterodyne laser interferometer. The interferometer results were consistent with the plasma density estimate by Stark broadening of the H line. Plasma density, marked , increases to at t=9 s as the plasma from the injectors is successfully transported to the center of the magnetic cusp system. The plasma density stays nearly constant until t=20 s and decreases gradually to at t25 s and at t32 s. Flux exclusion signals from flux loops, marked as , show a clear sign of an electron diamagnetic effect from the high plasma formation in the cusp magnetic fields. The flux loop data peaks at of flux exclusion at t=12.7 s and decreases to at t21 s. It is noted that of excluded flux is equivalent to 10% of the vacuum magnetic flux at the location of the flux loop. Separately, visible photodiode data also indicates the injection of plasma and its gradual decay based on H and C II line emission intensity. The faster decrease in the C II line intensity indicates cooling of the injected plasma after initial injection.
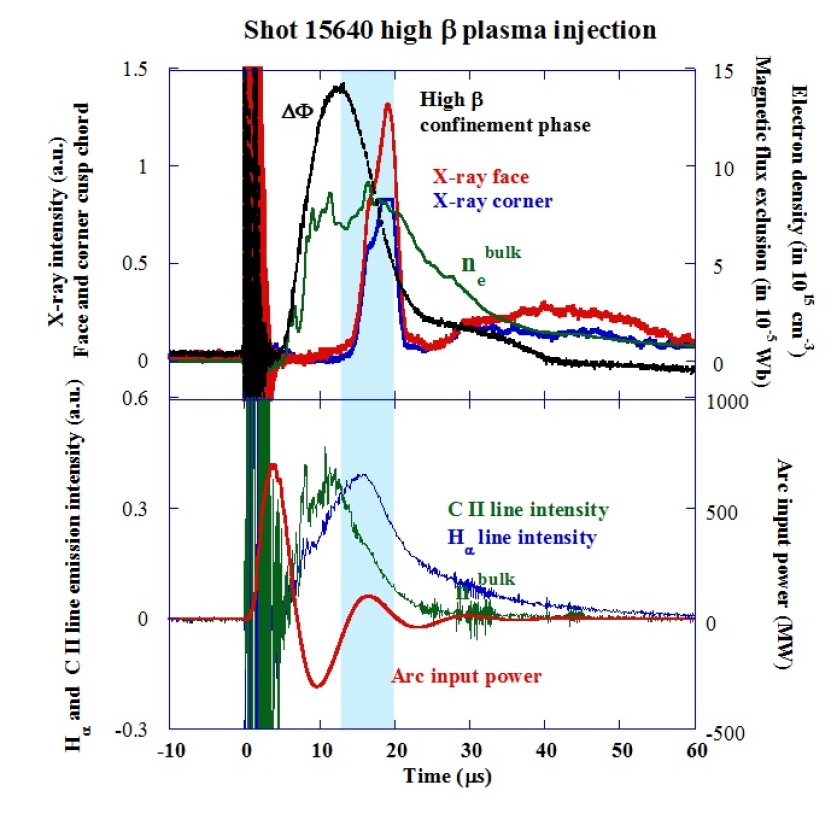
In comparison, the hard x-ray emission intensity shows very distinctive features in the time domain. Prior to plasma injection, the x-ray diode signals between t= and t=0 provide an estimate for the x-ray background data since there are no plasma ions to produce Bremsstrahlung during this time period. The low background signals in the x-ray diodes demonstrate good spatial collimation of x-ray detectors. Covering any metallic surfaces in the line of sight of the x-ray detectors with plastic materials keeps K emission from these surfaces below the Kapton filter threshold energy of 2 keV. Initially, the x-ray signals remain low until 12 s after plasma injection although the plasma density reaches its peak value of at t=9 s. Shortly after the peaking of flux loop data at 12.7 s, both x-ray diodes register strong increases in hard x-ray emission, while the bulk plasma density varies little. The increase in xray emission builds up from t=13 s to t=19 s, while all other plasma diagnostics indicate gradual decay of injected plasma in the cusp. At t=19 s, the x-ray emission intensity from both viewing channels rapidly decreases toward zero within 1.5 s. In contrast, the plasma density shows only gradual decrease during that time period and there is no sudden change in any other diagnostic. It is noted that the fast oscilloscope range was set too low for the x-ray signal viewing through the cusp corners of the coils, resulting in artificial saturation in the x-ray signal.
This temporal behaviour of the x-ray emission signals can be explained as follows, clearly demonstrating the relation between high plasma in the cusp magnetic field and the improved electron beam confinement as postulated by Grad and others.Bishop (1958); Grad (1955); Berkowitz et al. (1958) Initially, the beam electrons are confined poorly in the magnetic cusp system with a low plasma, resulting in low beam density and low x-ray emission. After the intense plasma injection, the cusp magnetic field is altered by the diamagnetism of the high plasma. This altered configuration, as in Figure 1B, gives enhanced electron confinement, as predicted theoretically. The increase in hard x-ray emission shows that beam electrons are now better confined in the magnetic cusp in the presence of high plasma and the beam electron density starts increasing in time. A preliminary estimate indicates that beam electrons are confined for at least 300 bounces in the cusp at high , compared to 7 bounces at low . Since the beam power is limited at 20 kW, the increase in beam density and therefore the x-ray emission intensity is gradual in time. The present experimental setup does not have a subsequent plasma heating system after the initial plasma injection, therefore the high plasma cannot be maintained indefinitely against plasma cooling and eventual loss of injected electron density. The enhanced plasma confinement phase is only temporary and it soon reverts back to the poor confinement phase when plasma becomes low. When this transition occurs, all the previously confined high energy electrons will rapidly leave the magnetic cusp, causing the observed rapid decrease in x-ray emission at t=21 s. It is noted that if the electron beam injection has sufficient power, it may prolong the duration of a good plasma confinement regime.
The key advance of the current work in validating the high plasma cusp confinement property stems from the use of an electron beam and beam induced hard x-ray measurement to measure the confinement property. This is because an electron beam at 7 keV has a transit time of 7 ns to move across the cusp system, compared to several microseconds during which the high state is maintained. This provides the temporal resolution necessary to measure the change in confinement property of the beam electrons by the magnetic cusp system during the plasma injection. This feature was absent in all previous magnetic cusp experiments. In comparison, high energy electron confinement is a critical issue in the Polywell fusion concept, which facilitated the use of electron beam as a diagnostic to measure confinement. In addition, the beam electrons have minimal coupling with the dense background plasma due to their high energy and low density, which avoids diagnostic complexities in separating losses of ions and electrons.
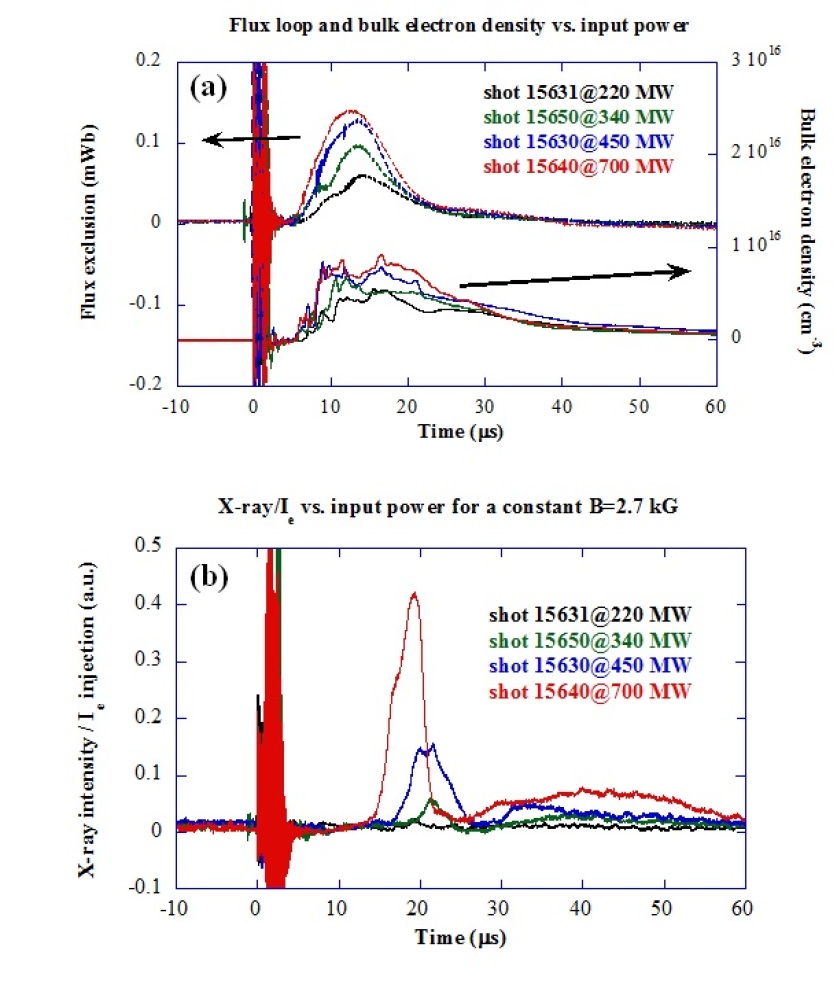
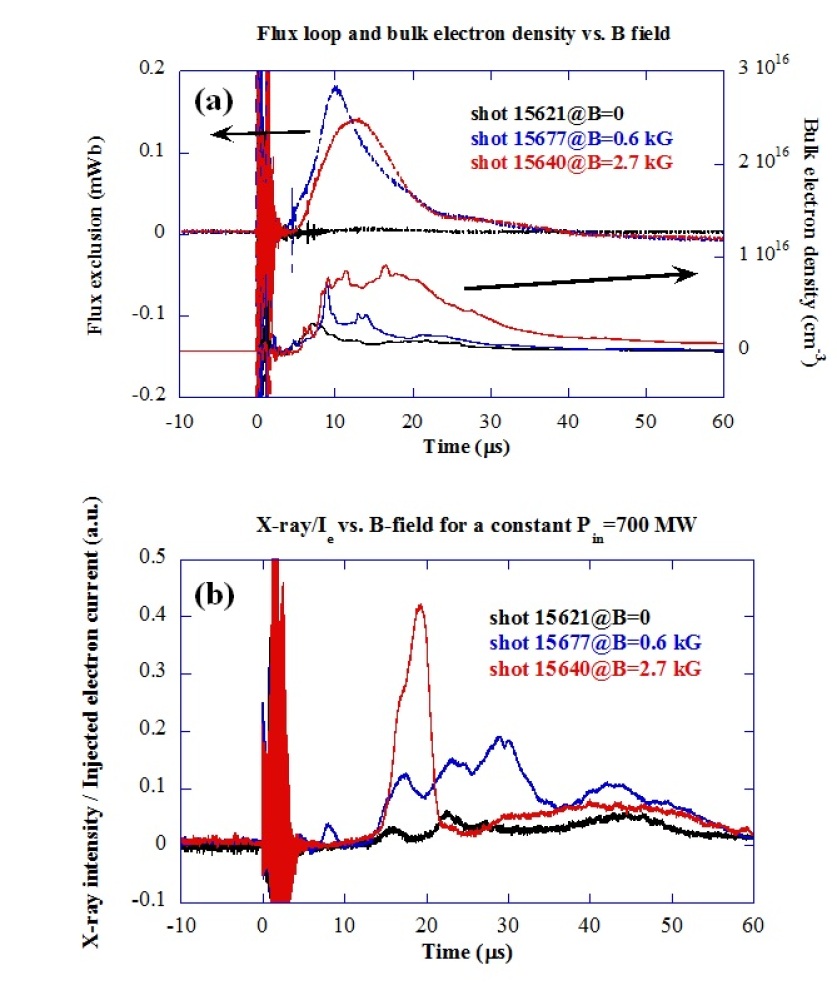
Figure 5 and 6 show variation in x-ray emission characteristic as plasma injection power and cusp magnetic flux density are varied. The plots were generated using the x-ray signals from viewing the cusp via the centers of coils; the characteristics of x-ray signals from the corners of cusps are qualitatively identical. In Figure 5, the plasma injection power is varied from 220 MW to 700 MW for a constant coil current generating 2.7 kG of magnetic field at the cusp points near the plasma injectors. The x-ray signal results show that improvement in electron beam confinement occurs only when there is a sufficient input power or energy in the plasma injection. In comparison, the excluded flux and bulk plasma density increase with plasma injection power. Figure 6 shows the x-ray emission as a function of cusp magnetic field for a constant plasma injection power at 700 MW. At B=0, there is no diamagnetism and the x-ray signal shows no distinctive structure, despite a clear indication of plasma injection from the density measurement albeit at a low level. It is noted that weak x-ray emission with slow and gradual rises and decays is explained by x-ray Bremsstrahlung from high Z impurities such as tungsten from the coaxial gun electrodes. This has been verified by time resolved visible emission spectroscopy using a gated CCD measuring various tungsten impurity line intensities compared to C line intensities. At B=0.6 kG, the x-ray result shows changes in electron beam confinement property but the signal is complex to interpret. In comparison, the x-ray result clearly shows a well-defined period of large increase in electron beam confinement at B=2.7 kG. The excluded magnetic flux shows faster peaking and bigger diamagnetic effects at B=0.6 kG compared to B=2.7 kG. The peak flux exclusion for the B=0.6 kG case is equivalent to 44% of the vacuum magnetic flux, compared to 10% for B=2.7 kG. The injected plasma density is comparable initially, while the density decays rather rapidly for B=0.6 kG. Though the detailed analysis of these results are beyond the scope of this work, the results indicate a level of balance between the magnetic field pressure and the injected plasma pressure may be a key to an improvement in electron beam confinement.
IV Computations and Scaling Implications
The theory of high plasma injection and electron beam confinement has also been investigated using the three dimensional particle-in-cell code, IPIC3D. IPIC3D is a massively parallel code solving the Vlasov-Maxwell system of equations using an implicit time scheme and has been used extensively in simulating magnetic reconnection and space plasma weather.Markidis et al. (2010) Initial results from IPIC3D were promising in that high plasma injection resulted in strong diamagnetic effects and a significant change in magnetic field in a cusp. At present, the numerical study of confinement is limited by the spatial resolution available and the number of particles required to reduce the noise level. As a result of these limitations, available computational resources limited the range of initial vales where the improved confinement is limited. Further discussion and results of these simulations are available with the Supplemental Methods below.
The present experimental result is a major step toward a Polywell fusion reactor in that it validates the conjecture that high energy electron confinement is improved in a high plasma. However, two additional measurements are needed to estimate the performance of a Polywell fusion reactor. The first is to quantitatively determine the loss rate. The second is to measure the efficiency of ion acceleration by electron beam injection. For the purpose of discussion, we estimate the power balance for a 1 meter radius hexahedral D-T Polywell fusion reactor operating at =1 with a magnetic field of 7 T at the cusp points and an electron beam injection energy at 60 kV. This calculation is based on two assumptions: 1) the electron loss rate in Equation 1 is correct, and 2) the efficiency of ion acceleration via a potential well can be made good enough to convert 50% of electron beam injection energy into an average ion energy. From Equation 1, the electron loss current is 254 A per cusp for the electron density and electron energy at 60 keV at the cusp points. Since there are 14 cusps in the hexahedral system, the required electron beam power to maintain a =1 state would be 213 MW. Separately, this system will lose an additional 51 MW of power via Bremsstrahlung radiation for an average electron temperature of 60 keV, assuming no ions other than hydrogen isotopes are present.Huba (2013) In comparison, the expected D-T fusion power output would be 1.9 GW for a D-T cross section of 1.38 barns at a center of mass energy of 30 keV.Bosch and Hale (1992) Though speculative at this point, this simple power balance scaling, coupled with the observed good plasma stability of a magnetic cusp system, indicates that the Polywell may emerge as an attractive concept for a compact and economical fusion reactor.
V Conclusions
In summary, the present experimental results demonstrate for the first time that high plasma operation can dramatically improve high energy electron confinement in the magnetic cusp system. This result validates the central premise of the Polywell fusion concept which uses high energy beam injected electrons to create an electrostatic potential well for ion acceleration and confinement. The current plan is to extend the present work with increased electron beam power to sustain the high plasma state and to form an electrostatic well. If the deep potential well can be formed and the scaling of the electron beam confinement is found to be favourable, as conjectured by Grad and others, it may be possible to construct a compact, low cost, high fusion power reactor based on the Polywell concept.
References
- Bishop (1958) A. S. Bishop, Project Sherwood: The U.S. Program in Controlled Fusion (Addison-Wesley, Reading, 1958).
- Tuck (1960) J. L. Tuck, Nature 4740, 863 (1960).
- Wesson (2011) J. Wesson, Tokamaks (Oxford University Press, 2011).
- Grad (1955) H. Grad, in Proceedings from Conference on Thermonuclear Reactions (University of California, Livermore, 1955) p. 115.
- Spalding (1971) I. Spalding, in Advances in Plasma Physics, edited by A. Simon and W. B. Thompson (Wiley, New York, 1971).
- Haines (1977) M. G. Haines, Nuclear Fusion 17, 811 (1977).
- ITER Physics Basis Editors et al. (1999) ITER Physics Basis Editors et al., Nuclear Fusion 39, 2137 (1999).
- Berkowitz et al. (1958) J. Berkowitz, K. O. Friedrichs, H. Goertzel, H. Grad, J. Killeen, and E. Rubin, in Proceeding of Second U.N. International Conference on Peaceful Uses of Atomic Energy, Geneva, Vol. 31 (1958) p. 171.
- Krall et al. (1995) N. A. Krall, M. Coleman, K. C. Maffei, J. A. Lovberg, R. A. Jacobsen, and R. W. Bussard, Physics of Plasmas 2, 146 (1995).
- Marshall (1960) J. Marshall, Jr., “Methods and means for obtaining hydro-magnetically accelerated plasma jet,” US Patent 2,961,559 (1960).
- Pechacek et al. (1980) R. E. Pechacek, J. R. Greig, M. Raleigh, D. K. Koopman, and A. W. DeSilva, Physical Review Letters 45, 256 (1980).
- Bussard (1991) R. W. Bussard, Fusion Technology 19, 273 (1991).
- Krall (1992) N. A. Krall, Fusion Technology 22, 42 (1992).
- Bussard (2006) R. W. Bussard, “The advent of clean nuclear fusion: Superperformance space power and propulsion,” Presented at the 57th International Astronautical Congress (2006).
- Farnsworth (1968) P. T. Farnsworth, “Method and apparatus for producing nuclear-fusion reactions,” US Patent 3,386,883 (1968).
- Hirsch (1967) R. L. Hirsch, Journal of Applied Physics 38, 4522 (1967).
- Elmore et al. (1959) W. C. Elmore, J. L. Tuck, and K. M. Watson, Physics of Fluids 2, 239 (1959).
- Markidis et al. (2010) S. Markidis, G. Lapenta, and Rizwan-uddin, Mathematics and Computers in Simulation 80, 1509 (2010).
- Huba (2013) J. D. Huba, Plasma Formulary (Naval Research Laboratory, 2013).
- Bosch and Hale (1992) H. S. Bosch and G. M. Hale, Nuclear Fusion 32, 611 (1992).
Acknowledgements.
We would like to thank John Santarius at U. of Wisconsin for his theoretical support and discussions, Malcolm Fowler at McFarland Instrumentation for his assistance in x-ray measurements, Greg Dale and Robert Aragonez at Los Alamos National Laboratory (LANL) for their assistance in pulsed power system construction, Glen Wurden at LANL for his assistance in design and operation of visible spectroscopy and x-ray diagnostics, Kim Gunther and Marc Curtis at Heatwave and Ken Williams at Applied Science and Engineering for their assistance in development of the electron beam injector system, Elizabeth Merritt and Mark Gilmore at University of New Mexico for their assistance in development of laser interferometer, and Mike Wray, Noli Casama and Kevin Wray at EMC2 for their laboratory operation support. This work was performed under Contract N68936-09-0125 awarded by the United States Department of Defense.VI Author Contributions
J.P designed experiments and performed data analysis, N.A.K. provided theoretical support, and assisted in experimental planning and data analysis, P.E.S. performed pulsed power system design and experimental operation, and provided magnetic flux loop measurements, D.T.O. provided x-ray, visible spectroscopy and plasma density measurements, M.S. provided mechanical design of the experiments, A.S. assisted in numerical simulation and power system design, K.D. assisted in experimental operation and power system design, E.A. assisted in mechanical design of the experiments, G.L. performed numerical simulation and interpretation.
VII Supplementary Methods
VII.1 Magnetic cusp system
The magnetic cusp experiments described in this paper were conducted in a cubic vacuum chamber measuring 45 cm on an edge. Centred in this chamber are six identical magnet coils, each coil having major radius 6.9 cm and minor radius 1.3 cm. The coils are arranged such that each coil is centered on a face of a cube measuring 21.6 cm on an edge as shown in Figure 2, producing cusp magnetic field. Each coil is driven by its own battery powered system capable of generating a static magnetic field from 0.6 kG to 2.7 kG at the cusp near the coil center with coil currents between 5–22 kA turns. The coils are energized for pulse duration of 40 ms compared to the 100 s plasma duration, thus generating static magnetic field during the time of interest.
VII.2 Plasma injection system
The plasma injectors consist of two co-axial plasma guns with an anode to cathode gap spacing of 2 mm utilizing plasma acceleration.Marshall (1960) The plasma guns use solid polypropylene film with 4 m thickness instead of more common gas injection to generate high pressure plasmas in a very short time. The amount of material injection is controlled by the number of film layers; two layers were chosen for the work presented here. The plasma guns are constructed with tungsten electrodes and boron nitride insulators to minimize erosion and impurity injection. Each gun is powered by a high voltage capacitor and operates with 60–150 kA of gun current using an Ignitron switch. Each gun is capable of injecting high pressure plasma with up to 500 MW pulse power from the capacitor and pulse duration between 5–10 s. The plasma guns are located 0.5 cm outside the magnetic cusp points along the x-axis.
VII.3 Electron beam injector
The electron beam injector utilizes a Lanthanum hexaboride () cathode to produce thermionic electron emission in the plasma environment. Beam extraction was obtained with the use of a triple grid system made of graphite grids to provide controlled electron extraction, while limiting plasma bombardment to the cathode surface. The electron beam is pulsed for 180 s, starting from 30 s before the plasma injection. The electron beam injector is located 50 cm above the top coil along the Y-axis.
VII.4 X-ray detection system
The x-ray detection system consists of a biased photodiode in a differentially pumped housing, a Kapton black window, a plastic collimator, and a magnetic yoke. The Kapton window was 25 m thick and completely opaque to visible light as well as x-rays below 2 keV. The collimator was designed to maximize the core plasma volume in the line of sight for the photodiode, while preventing the detection of x-rays produced when beam electrons are incident on the coil surfaces. The magnetic yoke with 2 kG magnetic field is used near the entrance of the collimator to prevent the beam electron induced fluorescence of the Kapton window. Two viewing chords are used; one viewing the central confined plasma through the cusp openings in the middle of coils along z-axis and the other viewing the plasma through the cusp openings among the corner of coils along the x=y=z line. The former view has a collection volume of and the latter view has a collection volume of .
VII.5 Laser interferometer
A heterodyne laser interferometer was used to measure a line integrated plasma density through the corner cusp using a green laser at 532 nm. The plasma length is assumed to be 22 cm, equal to the cusp system diameter. At that length, an average electron density of is equal to a phase shift of 180 degrees.
VII.6 Time resolved visible spectroscopy
An Acton monochrometer with selectable gratings (2400, 600, and 300 grooves/mm) was used in conjunction with a Princeton Instruments PI-Max intensified CCD camera to acquire time resolved spectroscopic data for Stark broadening and plasma chemical composition.
VII.7 Magnetic flux loop
Two magnetic flux loops are installed to monitor the plasma diamagnetism. Each loop consists of a single circular turn of a coaxial cable with major radius 5.2 cm and minor radius 1.1 mm. The loops are located 1 cm away from the magnet casing surface, such that the plane of each loop is 8.0 cm from the chamber center.
VII.8 Photodiodes for H and C II line emission
Two optical fibers collected plasma photoemission from the corner of the Polywell to photodiode detectors. Narrowband interference filters were used on each detector, one for the H line and the other for the C II line at 724 nm.
VII.9 IPIC 3D numerical simulation
Since the physics of diamagnetism is not related to the Debye length scale, we chose the implicit method that relaxes the length and time scale requirement of the simulation, compared to the explicit PIC model. The present simulation resolves the electron cyclotron time scale and the electron skin depth, instead of the electron plasma frequency and the Debye length. The simulation utilizes an electron mass of 1/256 of the hydrogen ion mass. The simulation utilizes the same hexahedral geometry of the experiments with the following changes. The total simulation size is 38 cm cube with a conducting metal boundary corresponding to the vacuum chamber. The coil radius is 6.4 cm and the linear distance between two opposing coils is 20.4 cm. The vacuum B-field value is 1.4 Tesla at the cusps near the center of the coils. These parameters represent a scaling of the experimental apparatus that was tractable with available computational resources. Uniform density plasma is initially loaded in a cube of 7.3 cm, centered in the simulation. The subsequent evolution is followed solving the full set of Maxwell equations for the fields and classical Newton equations for the particles. We report two cases, one with initial density equal to , and the other with . An initial electron temperature is set at 135 keV and the ion temperature is set at 34 keV for both cases. We present two movies documenting the diamagnetic effect with frames taken at every 2,500 cycles or . Movie 1 (M1) shows the high initial density case with the density is shown in volume representation in colour, superimposed to a representation of selected surfaces of constant magnitude of the magnetic field, while Movie 2 (M2) shows the low initial density case. The rho1=1 corresponds to the plasma density of and magnitude of B=1 corresponds to the magnetic field of . As time evolves, the initial plasma expands and pushes the magnetic field out, providing clear evidence of the diamagnetic effect. The case with lower initial density shows a weak diamagnetic response, while the higher initial density case shows a strong response. The surface of has a particular importance in determining the diamagnetic effect, because there the plasma and magnetic pressure are nearly equal. This surface expands as the initial plasma loaded centrally expands and relaxes to towards equilibrium with the magnetic field. We report such expansion in the third movie provided in the supporting material, showing the expanding surface for the high density case in Movie 3 (M3). Finally, we compare the precise geometry of the surface for two cases at the cycle 10,000, corresponding to time t= in Movie 4 (M4) and Movie 5 (M5). The movie rotates the view to allow the viewer to appreciate the 3D structure.
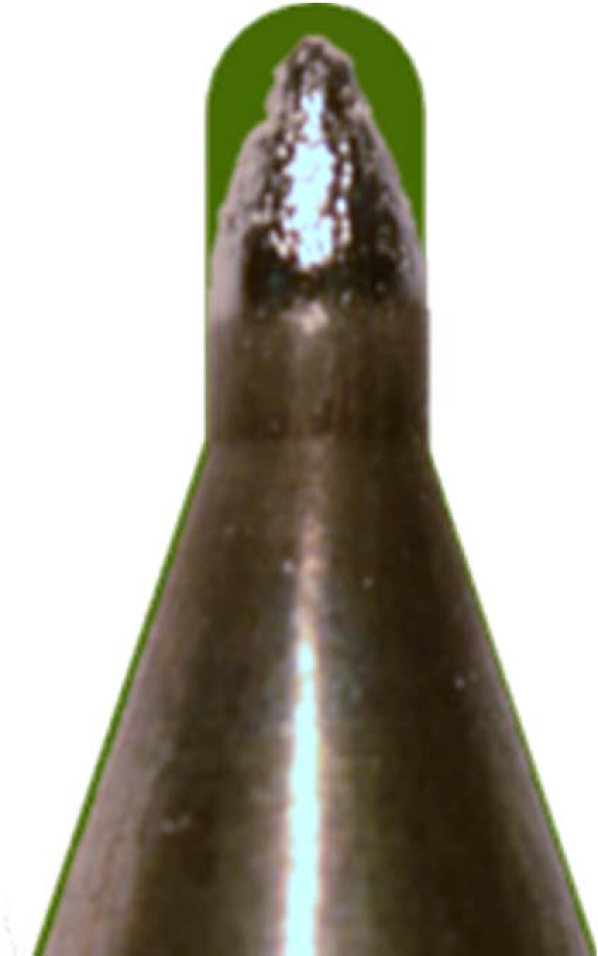
VII.10 Time resolved measurements of Tungsten impurities
After more than 200 plasma injections, the tungsten cathode in the plasma co-axial gun shows significant erosion, as shown in Figure S1. Since tungsten is good x-ray generating target material when exposed to the electron beam, injection of tungsten impurities into the magnetic cusp has been investigated in the visible spectral range from 390 nm to 450 nm with the use of a spectrometer coupled with a gated CCD camera. Figures S2 and S3 show 8 s time integrated spectra from the cups plasma with the same gain setting. Figure S2 shows the plasma emission spectrum during the initial high state, between 12 s and 20 s after the plasma injection. Figure S3 shows the plasma emission spectrum after the plasma decay, between 42 s and 50 s after the plasma injection. During initial high state, emission spectrum is dominated by carbon lines with contributions from Tungsten ion lines. In comparison, emission spectrum is dominated by tungsten neutral lines after the plasma decay. Figure S4 shows relative brightness of carbon and tungsten lines as a function of time. The signals are normalized to their brightness at 12 s after the plasma injection. In addition, signals from photodiodes, filtered to look at hydrogen and ionized carbon (H and C-II), are plotted for comparison. The results indicate that tungsten impurities are introduced to the cusp plasma region gradually and on a slower time scale than the high plasma injection. This is consistent with weak x-ray emission in the experiment with slow and gradual rises and decays.