A new type of X-ray pulsar
Abstract
X-ray emission from stars much more massive than the Sun was discovered only 35 years ago. Such stars drive fast stellar winds where shocks can develop, and it is commonly assumed that the X-rays emerge from the shock-heated plasma. Many massive stars additionally pulsate. However, hitherto it was neither theoretically predicted nor observed that these pulsations would affect their X-ray emission. Here we report the discovery of pulsating X-rays from the massive B-type star CMa. This star is a variable of Cep type and has a strong magnetic field. Our observations with the XMM-Newton telescope reveal X-ray pulsations with the same period as the fundamental stellar pulsation. This discovery challenges our understanding of stellar winds from massive stars, their X-ray emission, and their magnetism.
1 Introduction
Massive stars are among the key players in the cosmic evolution. These hot stars generate most of the ultraviolet radiation of galaxies and power their infrared luminosities. Massive stars, their winds and their final explosions as supernovae provide significant input of radiative and mechanical energy into the interstellar medium, inject nuclear processed material, and largely drive the evolution of star clusters and galaxies.
The majority of all massive stars are of spectral type B. Stars with spectral subtypes B0-B2 are born with masses between and . They are hot, with effective temperatures K. While still young and burning hydrogen in their cores, these stars oscillate with periods of a few hours [1]. The physical mechanism that drives these oscillations is well understood and is attributed to changes in the opacity within the star during the pulsation cycle (“-mechanism”) [2]. A whole class of such variables is termed after its prototype Cephei. A B0-B2 type star ends its life with a supernova explosion, when the stellar core collapses and leaves a neutron star as a remnant [3]. Fast rotating, strongly magnetic neutron stars may manifest themselves as radio and X-ray pulsars.
All hot massive stars drive stellar winds by their intense radiation. Photons that are scattered or absorbed in spectral lines transfer their momentum and thus accelerate the matter to highly supersonic velocities, typically of the order of 1000 km s-1. This driving mechanism is unstable [4]. It is generally believed that the wind instability may result in wind shocks where part of the wind material is heated to X-ray emitting temperatures. These wind shocks are often invoked to explain the X-ray emission which is ubiquitously observed from massive stars [5].
Typically, the observed X-ray spectra of single massive stars are thermal. In high-resolution, X-ray spectra are dominated by slightly blue-shifted and broad emission lines [6]. These line shapes can be explained as originating in a rapidly expanding stellar wind, consisting of hot X-ray emitting matter permeated with cool matter which attenuates the X-ray field [7, 8, 9].
A small fraction of massive stars, including some B-type stars, possess strong, large-scale magnetic fields [11, 12]. According to one hypothesis, such stars may have undergone a recent merger process which powered a dynamo mechanism [13, 14].
Strong magnetic fields can significantly influence the dynamics of stellar winds [15]. If the magnetic field has a dipole configuration, the strong field can in effect “channel” the wind toward the magnetic equator, where the wind streams from the opposite hemispheres collide. The formation of a strong stationary shock is predicted, and it is expected that the X-ray properties of stars with strong magnetic fields will be different from those of non-magnetic stars, e.g. the X-ray temperatures for magnetically confined winds should be are higher [16].
Fluctuations of the X-ray flux on rotational time-scale are reported for single massive stars (magnetic as well as non-magnetic) [17, 18], and may be related to large scale structures in the winds corotating with the star [19, 20].
| Distance | 424 pc |
|---|---|
| Sp. Type | B0.5-B1IV |
| 27 000 — 28 000K | |
| 4.5 | |
| Rotational velocity | km s-1 |
| Mass-loss rate | yr-1 |
| Wind velocity | km s-1 |
| Polar magnetic field strength | kG |
| Pulsation period | 0.2096 d |
| erg s-1 |
Parameters compiled from the literature, see text for details
The two models briefly outlined above (embedded wind shocks for non-magnetic objects and magnetically confined winds) are widely adopted to interpret the X-ray emission from single hot massive stars [21]. However, neither of these models accounts for the effects of stellar pulsations.
The Cep-type variable CMa, spectral type B0.5-B1 V-IV [22], is an ideal target to study the interactions between stellar pulsations, magnetic fields, and stellar wind. The variability of CMa (alias HD 46328, HR 2387, HIP 31125) is known for more than 100 years [23]. The period of its radial velocity variations was established 60 years ago as P=0.2096 d [24]. The range of radial velocity is km s-1 [25]. CMa is one of the rare Cep variables where the velocity amplitude exceeds the local speed of sound [26].
Together with the radial velocity variations, the star shows periodic photometric variability in visual light with a full amplitude of mag (3.2%) [27]. Maximum light occurs about 25 min after minimum radius [25]. The amplitude of photometric variability increases strongly with decreasing wavelength; in the UV near Å it amounts to mag [28].
CMa shows remarkable stability of its pulsational behavior: its period is constant to about 1 s century-1 [25]. The pulsations are non-linear and mono-periodic, with only one frequency and its first harmonic being significant [29, 26].
While there is good knowledge of the pulsation properties of CMa, its rotational velocity became established at km s-1 only recently [22]. This value is consistent with km s-1 derived independently from fitting high-resolution spectra by means of non-local thermodynamic equilibrium (NLTE) models [30].
The fundamental stellar parameters of CMa are typical for its spectral type B0.5IV [31]. The stellar effective temperature changes by K over the pulsation cycle, ranging from 27 000 K to 28 000 K, while changes between 3.7 at maximum and 3.8 at minimum [32, 22].
The chemical abundances in a sample of Cep-type variables were derived from optical spectra using a NLTE line formation code and line blanketed LTE models, but neglecting stellar winds [22]. It was found that, similar to some other magnetic early B-type stars, nitrogen is overabundant by a factor of 3–4 in CMa as compared to the solar value.
The advent of UV spectroscopy provided evidence for a stellar wind from CMa [33]. The study of variability in its UV spectra obtained with the IUE observatory did not reveal temporal modulations [34].
The stellar wind parameters of CMa were constrained from the analysis of UV spectral lines by means of NLTE iron-blanketed model atmospheres calculated with the PoWR code [35]. The wind from CMa is weak, with a mass-loss rate of yr-1 and a terminal velocity of km s-1 [36].
The atmosphere models for CMa show that X-rays have a strong effect on the ionization of the stellar wind. The observed N v resonance doublet can be reproduced only by wind models that include X-rays. Interestingly, the emission measure (a density squared weighted volume) of the hot X-ray emitting plasma in CMa is significantly higher than that of the cool gas. Similar conclusions were reached for other late O and early B-type stars on the main sequence [37].
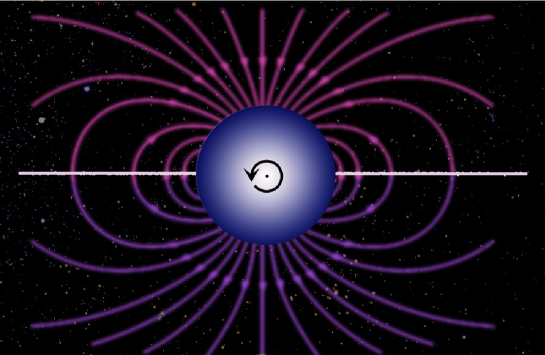
Despite earlier attempts [38], the first firm detection of a magnetic field on CMa was achieved only recently [39]. Periodic modulations of the longitudinal magnetic field with a period of d are observed. This period is identified with the stellar rotation. Using the known value of [22, 30], one can derive the inclination as . The spectropolarimetric observations are best explained by assuming that our view of the rotation axis is almost pole-on while the magnetic axis is inclined by about to the rotation axis; consequently, we have a nearly constant edge-on view of the system’s magnetic equator (see Fig. 1). The field has a dipole geometry, albeit additional magnetic structures on smaller spatial scales cannot be excluded [10]. A summary of stellar parameters for CMa is provided in Table 1. Among pulsating B-type stars with known magnetic field, CMa has by far the strongest field with a polar strength of kG [39].
While the magnetic field of CMa is strong, its stellar wind is relatively weak. Therefore, only at distances of more than the stellar wind can enforce the magnetic field lines to become approximately radial. Below this distance, the stellar wind is controlled by the magnetic field [36].
In this work we analyze new, sensitive X-ray observations of CMa. The first X-ray survey of Cep-type stars was performed by the Einstein observatory [40]. CMa was detected as the most X-ray luminous star in this survey [40, 41]. First X-ray spectra were obtained with the Rosat observatory. It was found that the X-ray spectrum of CMa is somewhat harder than of other B-type stars [42]. Interestingly, during a 0.56 h exposure with Rosat, variability at the level of 25% was noticed, but attributed to spacecraft wobble [42].
2 Results
The X-ray data for CMa discussed in this paper were taken with the X-Ray Multi-Mirror Satellite XMM-Newton of the European Space Agency ESA. Its three telescopes illuminate five different instruments which always operate simultaneously and independently: RGS1 and RGS2 are Reflection Grating Spectrometers [43], achieving a spectral resolution of Å in the wavelength range 5 Å – 38 Å. The other three focal instruments, forming together the EPIC camera, are called MOS1 and MOS2 (Metal-Oxide Semiconductor) and PN (pn-CCDs). Compared to the RGSs, the EPIC instruments have a broader wavelength coverage of 1.2 Å – 60 Å, but their spectral resolution is much lower () [44, 45].

The first dedicated XMM-Newton observation of CMa started on 2009-09-03 with an exposure time of 2 h, which was far too short to reveal the periodic variability [36]. In October 2012, XMM-Newton continuously observed CMa during nearly 29 hours. The light curves and spectra were recorded by all instruments. The sensitivity of the PN camera is superior, and therefore its data are best suited for time variability studies.
The data reduction involved standard procedures of the XMM-Newton Science Analysis System (SAS) v.13.0.1. The event lists have been filtered, and time intervals affected by high background were excluded. The useful exposure time was about 29 h. The object of our study is sufficiently isolated, with no nearby bright optical or X-ray sources.
The visual magnitude of CMa is mag with a pulsation amplitude of 0.034 mag [1]. Because of the brightness of the target in the visual, the optical light blocking filter of XMM-Newton was used in its “thick” mode for our observations. We carefully investigated the potential contamination of the signal by optical/UV light. For the XMM-Newton detectors operating in full-frame mode and with the thick filter, no optical loading is expected for stars with mag (XMM-Newton User Handbook). Moreover, the optical loading would affect the softest part of the X-ray spectrum only, but we don’t see different pulsational behavior between softer and harder parts. Also, while optical pulsations have an amplitude of about 3%, the amplitude of X-ray pulsations is . From these considerations, a contamination of the signal by optical/UV light can be ruled out.
2.1 X-ray light curve and comparison with optical light curve
Visual inspection of the X-ray light curve already reveals the periodic variability (see Fig. 2). To quantify this variability, a statistical analysis is performed. To obtain a characterization of the variability, the light curves in three energy bands (“total”: 0.2 keV–10.0 keV (1.24 Å – 62 Å); “soft”: 0.2 keV–1.0 keV (12.4 Å – 62 Å); and “hard”: 1.0 keV–10.0 keV (1.24 Å –12.4 Å)) are extracted from the event lists of all three EPIC instruments separately. This is done using the sas’s task epiclccorr, which provides equivalent on-axis, full point spread function count rates with background correction. The data are binned in temporal bins of different duration (100 s, 500 s, 1000 s, 3600 s).
For the further analysis, we first employ a test for several hypotheses such as constancy, linear variation, and quadratic variation [46]. The PN and MOS1 data in soft and total bands display significant variations for all time binnings – the probability that the observed curve occurs by chance is . Second, an autocorrelation test is performed to search for recurrence. Variability on a timescale of about five hours is detected in PN and MOS1, but is not obvious in the MOS2 data due to its poorer sensitivity.
Finally, a Fourier algorithm is applied [47, 48], which detects a period of h in the PN data. This is much shorter than the plausible rotation period of the star, but is conspicuously similar to the stellar pulsation period as derived from optical photometry (5.03 h).
Simultaneous optical and X-ray observations of CMa are not available. In order to investigate the phase correlation between X-ray and optical pulsations, we searched for optical photometric data in the archives. The best and most recent photometry of CMa was obtained by the space telescope Hipparcos during the years 1990 - 1993. The Hipparcos photometry was carried out in a wide pass-band, referred to as [49]. All photometric data were analyzed in a uniform and self-consistent manner and yielded the parameters of variability which are compiled in the “Hipparcos Catalogue Epoch Photometry Data”. The median magnitude of CMa is mag, and the full variability amplitude is mag. Based on the 5482 observed cycles, the derived period is d and the epoch of zero phase is JD(TT) 2448500.0280. We retrieved the Hipparcos photometric data for CMa and folded them according to the Hipparcos ephemeris. The result is shown in Figure 3 (lower panel). Comparing this ephemeris to older measurements from 1954 [27], the light curve is found to be still in phase, i.e. the period derived from Hipparcos photometry is very precise and the pulsations have been stable over 40 years.
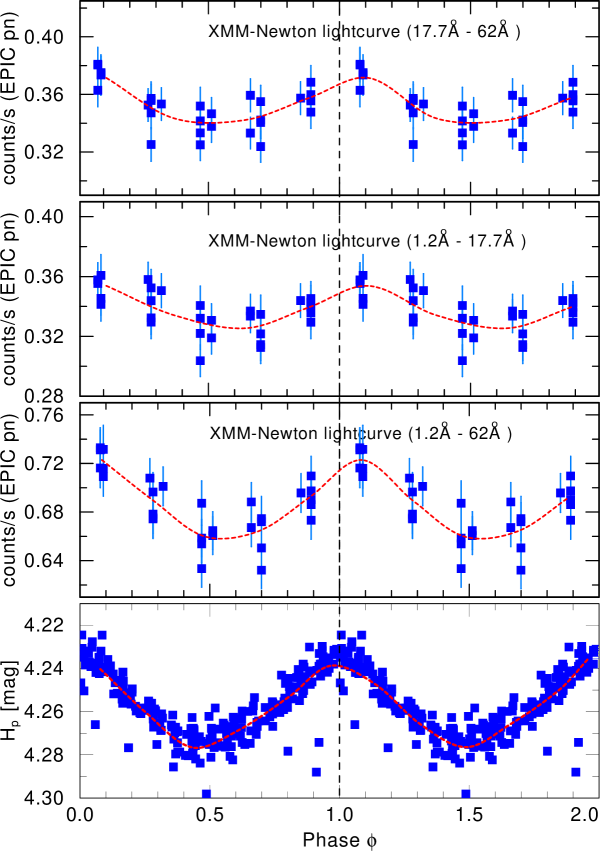
Our XMM-Newton data were obtained about 34000 pulsation cycles after the Hipparcos measurements. However, given the stability of the CMa light curve [25], the Hipparcos ephemeris can be meaningfully applied for the epoch of our X-ray observations. The X-ray light curves were phased with the Hipparcos ephemeris and compared to the optical ones. Figure 3 shows the comparison between X-ray light curves in full, hard, and soft bands and the Hipparcos optical light curve. The X-ray light curve in broad band as well as in softer and harder bands turned out to be in phase with the optical within the precision of the measurement and the formal error margin of the ephemeris (see Fig. 3).
Typically, the optical light curve of Cep-type variables is similar in shape to the radial-velocity curve but lags in phase. The maximum brightness occurs shortly after the stellar radius goes through its minimum. The results of our analysis show that the same is true for the X-ray light – the maximum X-ray brightness is observed close to the phase when the stellar radius is at its minimum.
2.2 Analysis of the low-resolution X-ray spectra
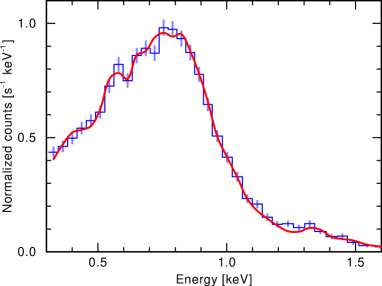
To define the physical properties of the X-ray emitting plasma in CMa, we analyze its X-ray spectra. As a first step, the low resolution data recorded by the EPIC cameras [44, 45] are considered. While individual lines, in general, cannot be resolved with the EPIC, the low-resolution spectra cover a broad energy band and allow to constrain the temperature and the emission measure of the hot plasma. For a phase-resolved analysis, the spectra are extracted for time intervals close to the pulsation maximum (see Fig. 4) and the pulsation minimum, respectively.
The spectra are analyzed with the standard spectral fitting software xspec [50]. In order to reduce the number of free model parameters, the interstellar (ISM) neutral hydrogen column density is fixed at cm-2 according to the interstellar reddening which we obtained from fitting the observed spectral energy distribution from the UV to the optical [36], and in agreement with other works [51]. The fit of the X-ray spectra which we obtain with this hydrogen column density indicates that no additional absorption intrinsic to the source is required.
The spectra were investigated for the presence of an emission component described by a power law. Such emission is the dominant component in spectra of X-ray pulsars containing a neutron star. No convincing evidence for non-thermal radiation was found. Therefore, we adopt a model of thermal plasma in collisional ionization equilibrium as implemented in the apec code [52]. To restrict the number of free parameters, we use only three temperature components. Albeit such a model provides only a simplified description of the plasma, it can give an insight in the characteristic temperatures and emission measures.
| minimum | maximum | |
| [keV] | ||
| EM1 cm-3] | ||
| [keV] | ||
| EM2 cm-3] | ||
| [keV] | ||
| EM3 cm-3] | ||
| [keV] | 0.31 | 0.34 |
| [erg s-1 cm2] |
The abundances were set to solar values [53] for all elements included in the apec model, except for nitrogen and oxygen, which were free fitting parameters. The best fit resulted in a nitrogen overabundance by a factor of relative to solar, and an oxygen overabundance by a factor of . These abundances are in agreement with those found from the analysis of optical spectra of CMa [54].
The best fit to the observed spectra with a three-temperature plasma model is obtained with temperatures ranging between 1.2 and 9 million Kelvin (see Table 2). Spectral fits indicate that at the maximum of the pulsation cycle the plasma’s mean temperature (i.e. the average temperature weighted with emission measure) is somewhat higher (by 500 000 K) than at minimum. During the pulsation cycle, the X-ray flux changes by . From the time between maximum and minimum of the light curve ( h) one can estimate the cooling rate and use it to constrain the density of X-ray emitting plasma. We computed cooling functions with the apec code, and found that the observed cooling rate can only be achieved if the electron density is higher than cm-3.
According to our PoWR models for the cool wind of CMa, such high electron densities are encountered only close to the photospheric radius , and not farther than . Assuming that the electron densities of the hot X-ray emitting plasma are not higher than the densities of the ambient cool wind, the pulsed X-ray emission should originate from regions very close to the stellar photosphere.
2.3 Analysis of the high-resolution X-ray spectrum
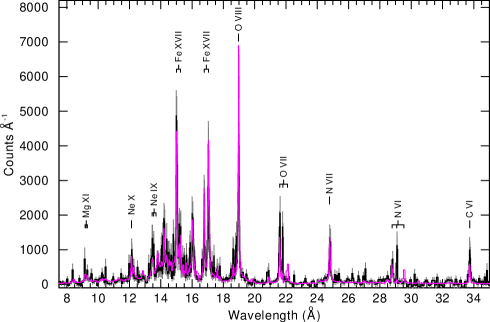
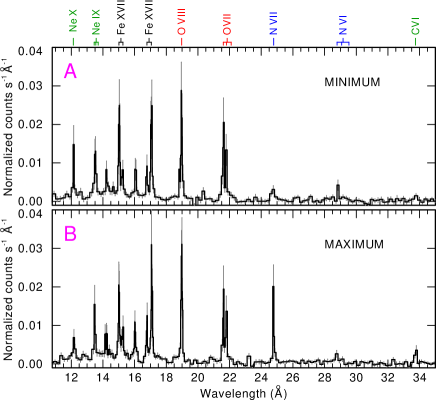
The high-resolution X-ray spectra of CMa obtained with the RGS1 and RGS2 spectrographs [43] are dominated by strong emission lines of metals (see Fig. 5).
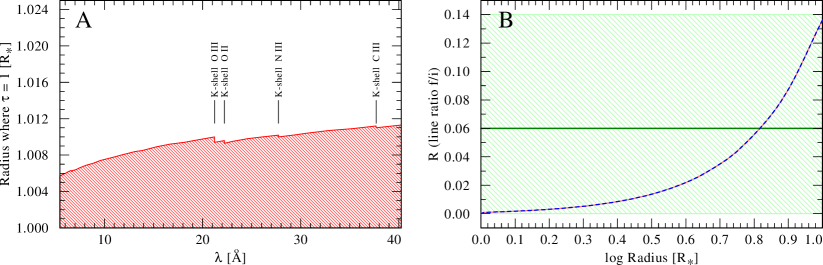
X-ray line profiles formed in a rapidly expanding stellar wind would be Doppler broadened. These lines can appear characteristically blue-shifted and asymmetric, especially when there is significant absorption of the X-rays in the cool stellar wind [7, 8]. To estimate the effects of wind absorption, we computed the radii at which the wind becomes optically thin for X-rays. As can be seen from Fig. 6, the wind of CMa is optically thin for X-rays above . Hence no significant effects of wind absorption are expected.
To analyze the line shape, both RGS spectra were combined and line moments were calculated. Because of high signal-to-noise ratio, the best-suited line for a detailed analysis is O viii Ly. This line is marginally broader than the instrumental response. The maximum wind velocity in CMa is km s-1. If X-ray lines were formed in a plasma moving with such velocity, the corresponding Doppler line broadening would be detectable in the high-resolution spectrum. Only for the O viii Ly line a marginal blue-shift is detected, while the other line are inconclusive. Hence the emitting plasma is not moving rapidly, and the attenuation of the X-rays by the cool wind is low.
The spectrum obtained over the total exposure time and thus covering different pulsation phases can be well modeled by a thermal, optically thin plasma with temperatures that are consistent with those found from fitting the low-resolution spectra as described above (see Fig. 5).
As a next step, we considered how the high-resolution spectrum varies between different pulsation phases (see Fig. 7). While the spectrum close to minimum light can be well reproduced with a three-temperature plasma model, there are difficulties in finding a suitable model that fits the high-resolution spectrum at maximum. Surprisingly, the line ratios between the CNO elements are different in different pulsation phases. Especially interesting is the variability of the N vii Ly resonance line. This line is much stronger at the maximum than at the minimum of the light curve (see Table 3). We tried to reproduce this line variability by selecting models with different temperatures or additional absorption components, but could not find a convincing explanation for the observed line variability. Allowing the nitrogen abundance to be a free fitting parameter results in a lower nitrogen abundance during the phase close to the minimum ( solar nitrogen abundance in maximum versus in minimum). This is a puzzling result.
| Pulsation phase | Photon flux [cm-2s-1] |
|---|---|
| Average | |
| Maximum () | |
| Middle () | |
| Minimum () |
The location of X-ray emitting plasma can be constrained with the help of the lines from helium-like ions. These ions emit a group of three X-ray lines, consisting of a forbidden (), an intercombination (), and a resonance () transition – the so-called triplet. The ratio of fluxes is sensitive to the temperature, while the ratio of fluxes between the forbidden and the intercombination component, , is sensitive to the electron density and the ultraviolet radiation field [55]:
| (1) |
Here, denotes the photo-excitation rate from the term 2s 3S to 2p3P, and is the electron density. The constants , and depend on atomic parameters and slightly on the electron temperature [55, 56]. Most important, the photo-excitation rate scales with the mean intensity of the radiation field at the wavelength of the transition, which is typically in the UV.
The triplets of Ne ix, O vii, and N vi are present in the RGS spectrum of CMa, with the O vii triplet being the strongest one. Only in the O vii triplet, the forbidden line is marginally detected, while forbidden lines in Ne ix and N vi were not detected.
We use the PoWR stellar atmosphere model to calculate the values of for Ne ix, O vii and N vi as function of the radial location in the wind of CMa. The photo-excitation rates are computed at each radius from the radiation intensity as provided by the PoWR model, which accounts not only for geometric dilution, but also for the diffuse radiation field. Figure 6 (right panel) shows for the O vii triplet the predicted ratio as function of the radial location of the emitting plasma. From the spectrum integrated over the full exposure time, the best-fit value of the ratio indicates a plasma location at , while the 1 margins are consistent with any location between and .
3 Discussion
It is generally assumed that X-ray emission from hot massive stars originates from plasma heated by hydrodynamic shocks in a radiatively driven stellar wind. The radiation driven wind theory predicts that the mass loss rate depends on the stellar parameters as
| (2) |
where is the stellar bolometric luminosity and is a dimensionless number (which is about 2/3) representing the power-law exponent of the distribution function of line strength of the thousands of spectral lines driving the wind, and for B-type stars [57, 58].
During a pulsation cycle, the radius of CMa changes by and its effective temperature changes by , with consequent changes for the luminosity. Recall that the luminosity is given by , where is Stefan–Boltzmann constant. With and varying in anti-phase, the bolometric luminosity changes by during a pulsation cycle. According to equation (2), the mass-loss rate may change by , which is a similar amplitude as of the observed X-ray pulsations. According to the wind theory, the wind velocity scales with the escape velocity, i.e. proportional to . Therefore it may also slightly change during the pulsation. The dynamical time scale for a stellar wind is the flow time . For CMa this time is about 2 h. Hence, the wind is principally able to follow changes that are triggered with the pulsation period (5 h). From these considerations one might, in principle, expect that the stellar pulsations lead to periodic changes of the wind parameters and, consequently, of the X-ray luminosity. It is interesting to note that there is an established empirical correlation between bolometric and X-ray luminosity for OB type stars, [59].
However, while these scaling correlations are general, no X-ray pulsations from other stars were detected so far. For instance, a dedicated study of the X-ray light curve of Cephei obtained with XMM-Newton did not reveal the presence of pulsations [60]. We, therefore, believe that the general scaling correlations do not explain the observed X-ray properties of CMa.
The new XMM-Newton observations of CMa may provide important insights into possible mechanisms of plasma heating. In massive stars that possess large scale magnetic fields, plasma heating is commonly explained by the magnetically confined wind shock mechanism (MCWS) [15, 16]. This model predicts that the parameters of X-ray emission depend on mass-loss rate, wind velocity, stellar rotation, and especially on the magnetic field strength [61, 62].
To check these predictions, we compared our data with RGS spectra of comparable quality that are available for two other magnetic Cep-type stars, Cen (B1III) and Cep (B2V). Centauri is a binary system consisting of two Cep-type stars of nearly equal mass [63]. The primary rotates significantly faster ( km s-1) than the magnetic secondary ( km s-1) [63, 64]. For its spectral class, Centauri has an average X-ray luminosity, erg s-1. From the analysis of its X-ray spectrum, the temperature of the X-ray emitting plasma is keV, similar to the one measured in CMa. The ratios of forbidden to intercombination line strengths in He-like ions are also similar to those in CMa [65].
Cephei is also a binary system, which consists of a magnetic B1V star as primary [66] and secondary of type B6-8e [67]. The temperature of the X-ray emitting plasma is also keV, is similar to CMa [60]. The forbidden to intercombination line ratio in He-like ions is basically identical with those measured in CMa.
The wind parameters are also quite similar in Cen, Cep and CMa. However the magnetic field strength of CMa is at least one order of magnitude higher than in other two objects. Moreover, the viewing geometry of CMa may be special as we likely look face on at the plane of the stellar rotational equator. Yet, the X-ray temperatures and the locations of hot plasma are similar in all three stars.
Besides MCWSs, another possibility for plasma heating in Cep-type variables could be the deposition of mechanical energy from the stellar pulsations [68, 69]. However, in a study of a small sample of Cep-type variables, no dependence of the X-ray luminosity on the pulsational period or amplitude was noticed [36].
The properties that make CMa distinct from other Cep-type variables are the supersonic speed of the pulsating photosphere, the high strength of the star’s magnetic field, and the absence of non-radial modes in the stellar oscillations. We suggest that a successful explanatory model must take these ingredients into account in order to understand the X-ray emission and its periodic modulations observed in CMa.
To summarize, we detect pulsations of the X-ray flux from CMa in phase with optical pulsations but with larger amplitude. The X-ray light curves are similar in different energy bands. There are tentative indications that changes of the X-ray emission are due to the plasma heating and cooling – from the spectral analysis, somewhat higher temperatures are deduced at X-ray maximum as compared to X-ray minimum. The X-ray emitting plasma is located close to the photosphere, as follows from the cooling rate and from the analysis of line ratios in He-like ions.
This first discovery of X-ray pulsations from a non-degenerate, massive stars will stimulate theoretical considerations for the physical processes operating in magnetized stellar winds. So far, the mechanism by which the X-rays are affected by the stellar pulsation remains enigmatic.
References and Notes
- [1] A. Stankov, G. Handler, ApJS 158, 193 (2005).
- [2] W. A. Dziembowski, A. A. Pamiatnykh, MNRAS 262, 204 (1993).
- [3] A. Heger, C. L. Fryer, S. E. Woosley, N. Langer, D. H. Hartmann, ApJ 591, 288 (2003).
- [4] L. B. Lucy, P. M. Solomon, ApJ 159, 879 (1970).
- [5] A. Feldmeier, R. Kudritzki, R. Palsa, A. W. A. Pauldrach, J. Puls, A&A 320, 899 (1997).
- [6] W. L. Waldron, J. P. Cassinelli, ApJ 668, 456 (2007).
- [7] J. J. Macfarlane, et al., ApJ 380, 564 (1991).
- [8] R. Ignace, ApJ 549, L119 (2001).
- [9] L. M. Oskinova, A. Feldmeier, W.-R. Hamann, MNRAS 372, 313 (2006).
- [10] S. Hubrig, et al., ApJ 726, L5 (2011).
- [11] S. Hubrig, et al., A&A 528, A151 (2011).
- [12] Grunhut, J. H., Wade, G. A., and MiMeS Collaboration. The Incidence of Magnetic Fields in Massive Stars: An Overview of the MiMeS Survey Component. AIP Conf. Proc.1429, 67–74, (2012).
- [13] L. Ferrario, J. E. Pringle, C. A. Tout, D. T. Wickramasinghe, MNRAS 400, L71 (2009).
- [14] J. Braithwaite, ArXiv e-prints (2013).
- [15] J. Babel, T. Montmerle, ApJ 485, L29+ (1997).
- [16] A. ud-Doula, S. P. Owocki, ApJ 576, 413 (2002).
- [17] L. M. Oskinova, D. Clarke, A. M. T. Pollock, A&A 378, L21 (2001).
- [18] Y. Nazé, et al., A&A 520, A59+ (2010).
- [19] J. Donati, et al., MNRAS 326, 1265 (2001).
- [20] R. Ignace, et al., ApJ 775, 29 (2013).
- [21] M. Güdel, Y. Nazé, A&A Rev. 17, 309 (2009).
- [22] T. Morel, K. Butler, C. Aerts, C. Neiner, M. Briquet, A&A 457, 651 (2006).
- [23] E. B. Frost, ApJ 25, 59 (1907).
- [24] D. H. McNamara, PASP 65, 193 (1953).
- [25] R. R. Shobbrook, MNRAS 162, 25 (1973).
- [26] S. Saesen, M. Briquet, C. Aerts, Communications in Asteroseismology 147, 109 (2006).
- [27] A. D. Williams, PASP 66, 200 (1954).
- [28] J. R. Lesh, P. R. Wesselius, A&A 79, 115 (1979).
- [29] D. Heynderickx, C. Waelkens, P. Smeyers, A&AS 105, 447 (1994).
- [30] K. Lefever, et al., A&A 515, A74 (2010).
- [31] D. R. Gies, D. L. Lambert, ApJ 387, 673 (1992).
- [32] A. van Hoof, ZAp 56, 141 (1963).
- [33] G. J. Peters, PASP 85, 536 (1973).
- [34] R. S. Schnerr, et al., A&A 483, 857 (2008).
- [35] W. Hamann, G. Gräfener, A&A 427, 697 (2004).
- [36] L. M. Oskinova, et al., MNRAS 416, 1456 (2011).
- [37] D. P. Huenemoerder, et al., ApJ 756, L34 (2012).
- [38] R. J. Rudy, J. C. Kemp, MNRAS 183, 595 (1978).
- [39] S. Hubrig, et al., MNRAS 369, L61 (2006).
- [40] P. C. Agrawal, K. P. Singh, G. R. Riegler, R. A. Stern, MNRAS 208, 845 (1984).
- [41] F. Grillo, S. Sciortino, G. Micela, G. S. Vaiana, F. R. Harnden, Jr., ApJS 81, 795 (1992).
- [42] J. P. Cassinelli, D. H. Cohen, J. J. Macfarlane, W. T. Sanders, B. Y. Welsh, ApJ 421, 705 (1994).
- [43] J. W. den Herder, et al., A&A 365, L7 (2001).
- [44] M. J. L. Turner, et al., A&A 365, L27 (2001).
- [45] L. Strüder, et al., A&A 365, L18 (2001).
- [46] Y. Nazé, L. M. Oskinova, E. Gosset, ApJ 763, 143 (2013).
- [47] A. Heck, J. Manfroid, G. Mersch, A&AS 59, 63 (1985).
- [48] E. Gosset, P. Royer, G. Rauw, J. Manfroid, J.-M. Vreux, MNRAS 327, 435 (2001).
- [49] F. van Leeuwen, et al., A&A 323, L61 (1997).
- [50] K. A. Arnaud, Astronomical Data Analysis Software and Systems V, G. H. Jacoby & J. Barnes, ed. (1996), vol. 101 of Astronomical Society of the Pacific Conference Series, p. 17.
- [51] S. B. Gudennavar, S. G. Bubbly, K. Preethi, J. Murthy, ApJS 199, 8 (2012).
- [52] R. K. Smith, N. S. Brickhouse, D. A. Liedahl, J. C. Raymond, ApJ 556, L91 (2001).
- [53] M. Asplund, N. Grevesse, A. J. Sauval, P. Scott, ARA&A 47, 481 (2009).
- [54] T. Morel, S. Hubrig, M. Briquet, A&A 481, 453 (2008).
- [55] G. R. Blumenthal, G. W. F. Drake, W. H. Tucker, ApJ 172, 205 (1972).
- [56] D. Porquet, R. Mewe, J. Dubau, A. J. J. Raassen, J. S. Kaastra, A&A 376, 1113 (2001).
- [57] H. J. G. L. M. Lamers, J. P. Cassinelli, Introduction to Stellar Winds (1999).
- [58] R. P. Kudritzki, Stellar astrophysics for the local group: VIII Canary Islands Winter School of Astrophysics, A. Aparicio, A. Herrero, F. Sánchez, eds. (1998), p. 149.
- [59] R. Pallavicini, et al., ApJ 248, 279 (1981).
- [60] F. Favata, C. Neiner, P. Testa, G. Hussain, J. Sanz-Forcada, A&A 495, 217 (2009).
- [61] M. Maheswaran, J. P. Cassinelli, MNRAS 394, 415 (2009).
- [62] A. Ud-Doula, S. P. Owocki, R. H. D. Townsend, MNRAS 392, 1022 (2009).
- [63] M. Ausseloos, C. Aerts, K. Lefever, J. Davis, P. Harmanec, A&A 455, 259 (2006).
- [64] E. Alecian, et al., A&A 536, L6 (2011).
- [65] A. J. J. Raassen, J. P. Cassinelli, N. A. Miller, R. Mewe, E. Tepedelenlioǧlu, A&A 437, 599 (2005).
- [66] J. Donati, et al., MNRAS 326, 1265 (2001).
- [67] R. S. Schnerr, H. F. Henrichs, R. D. Oudmaijer, J. H. Telting, A&A 459, L21 (2006).
- [68] J. P. Cassinelli, et al., ApJ 460, 949 (1996).
- [69] H. R. Neilson, J. B. Lester, ApJ 684, 569 (2008).