Experimental investigation of the softening-stiffening response of tensegrity prisms under compressive loading
Abstract
The present paper is concerned with the formulation of new assembly methods of bi-material tensegrity prisms, and the experimental characterization of the compressive response of such structures. The presented assembly techniques are easy to implement, including a string-first approach in the case of ordinary tensegrity prisms, and a base-first approach in the case of systems equipped with rigid bases. The experimental section shows that the compressive response of tensegrity prisms switches from stiffening to softening under large displacements, in dependence on the current values of suitable geometric and prestress variables. Future research lines regarding the mechanical modeling of tensegrity prisms and their use as building blocks of nonlinear periodic lattices and acoustic metamaterials are discussed.
keywords:
Tensegrity prisms , Assembling Methods , Compressive response , Elastic softening , Elastic stiffening , Periodic lattices , Acoustic metamaterials1 Introduction
The construction and testing of physical tensegrity models is a topic of particular interest for a broad audience of researchers and engineers, due to the large use of tensegrity concepts in engineering and the physical sciences, and the lack of standardized assembly methods for such structures (refer, e.g., to Skelton and de Oliveira, (2010); Fest et al., (2003); Motro, (2003); Burkhardt, (2008)). A rich variety of small- and full-scale tensegrity structures is presented in Skelton and de Oliveira, (2010), including a nickel-titanium controllable tensegrity column, which is a small-scale model of a tall adaptive building (cf. Fig. 1.28 of Skelton and de Oliveira, (2010)); a full-scale model of a deployable tensegrity wing (Fig. 1.28); a marine tensegrity structure easily dropped into the sea to serve for weather forecasting or ocean studies (Figs. 1.34–1.37); and a vibration control device consisting of a tensegrity column with 9 bars, three actuators, and three sensors (Fig. 1.40), just to name a few examples. Due to their lightness and deployability, it is well known that tensegrity structures are well suited for space applications (cf., e.g., Skelton and de Oliveira, (2010); Duffy et al., (2000)). An interesting model of a deployable reflector structure serving a small satellite is presented in Tibert and Pellegrino, (2002). Such authors make use of a tensegrity system with 6 telescopic bars and 18 strings to build a deployable ring element of the reflector structure. The adopted cables consist of 1.0 mm Kevlar cords connected to the bars through Al alloy cylindrical joint fittings, with length 30 mm and 15 mm diameter. The foldability and deployability of a model is demonstrated through laboratory tests.
For what concerns the experimental response of full-scale models, an interesting system composed of three repetitive modules is analyzed in Fest et al., (2003). Such a system is equipped with sensors and actuators to control its shape and response. Each unit is formed by 6 telescopic bars made up of fiberglass-reinforced polyester tubes with a cross-sectional area of 703 , and 24 stainless steel cables of 6 mm diameter. The nodes of the different units are equipped with ball bearings preventing the transmission of bending moments, and the units are connected with each other through special connection joints. The structure is prestressed by elongating the bars through nut/threaded rod systems, and the cable tension is measured with an interferometric laser system (Cunha and Caetano,, 1999). Symmetric and asymmetric loading tests allow the authors to detect geometrical and mechanical nonlinearities of the overall response. An experimental study of the nonlinear mechanical response of tensegrity prisms equipped with semi-spherical joints is performed in Chen et al., (2004), by employing a cable-shortening method and considering different prestress levels. A tensegrity prism controlled by a pneumatic bar has been constructed in the Structural Systems and Control Laboratory of the University of California, San Diego, employing pneumatic cylinders to realize the compressive members, and replacing the top and bottom cables with rigid aluminum plates (http://maeresearch.ucsd.edu/skelton/laboratory/tensegrity_platform.htm).
The issue of the effective measurement of the self-stress state of a tensegrity structure is treated by Dubé et al., (2008), using direct and indirect measurement methods. The monitored structure consists of a tensegrity minigrid featuring 24 struts and 57 cables. The nodes have a cylindrical shape and host the cables and the pointed extremities of the bars. Direct measurements of the stresses running along the cables and struts are performed by equipping such elements with strain gauges, while indirect estimates of the cable tensions are obtained through the vibrating wire method (Averseng and Crosnier,, 2004). Panigrahi et al., (2010) present experimental and numerical analyses of tensegrity prototypes made through two different (strut based and cable based) techniques. The strut based method changes the length of a suitable telescopic bar to apply the desired prestress. The cable based method instead makes use of a turnbuckle placed on a selected string. A tension meter is used in Shekastehbandi et al., (2013) to measure the tension in the cables of an adaptive tensegrity grid. The cables are tensioned by screwing their adjustable ends, and the tension meter is employed to reach the desired prestress through iterative steps.
The present paper is concerned with the formulation and the practical implementation of original assembly methods of bi-material tensegrity prisms, and the laboratory testing of uniformly compressed prisms with different aspect ratios and boundary conditions. We begin by describing the materials used for the construction of the physical tensegrity models, which consist of threaded steel bars for the compressed members, and Spectra® fibers for the tensile elements. Additional aluminum plates are used in the case of special systems equipped with rigid bases (Section 2). Next, we accurately illustrate the assembly methods proposed in the present study, which include a string-first approach in the case of ordinary prisms, and a base-first approach in the case of systems with rigid bases (Section 3). We then pass to describing the quasi-static testing used to characterize the response in compression of the examined prism models, with the aim of identifying the nature of those responses in the large displacement regime (Section 4). We observe a marked variability of the mechanical response of a tensegrity prism under uniform axial loading: it ranges from stiffening to softening depending on the aspect ratio of the structure, the magnitude of the applied state of prestress, and the rigidity of the terminal bases. We end in Section 5 by drawing the main conclusions of the present study and outlining avenues for future research.
2 Materials
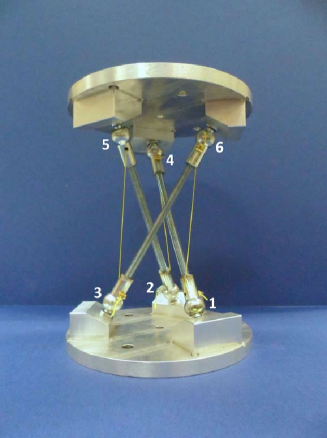
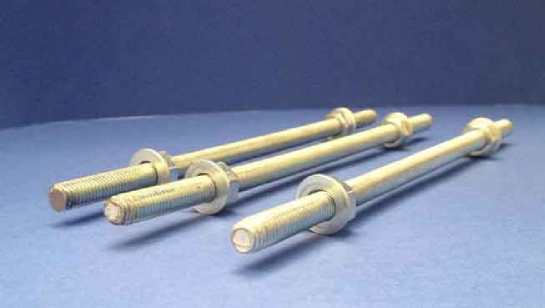
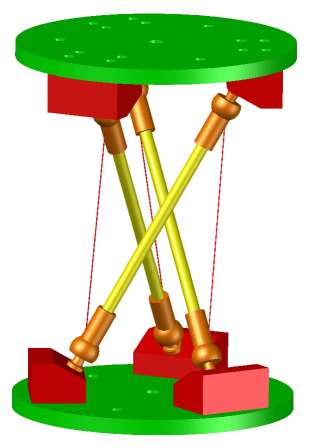
The present section illustrates the materials used to construct the physical tensegrity prism models analyzed in the present paper, and the experimental measurements that were conducted in order to identify the Young’s moduli of the component materials. We analyze ordinary minimal regular tensegrity prisms (Skelton and de Oliveira,, 2010), which are composed of three struts (or ‘bars’), three cross-strings, and six horizontal strings (‘db’ systems, cf. Fig. 1). In addition, we examine a special tensegrity prism which is composed of three bars, three cross-strings, and thick aluminum plates at the bases (‘rb’ system, cf. Fig. 2).
2.1 Strings
The strings of the analyzed prisms are made out of PowerPro® braided Spectra® fibers with diameter 0.76 mm (commercialized by Shimano American Corporation, Irvine, CA, USA, as a fishing line). We measured the Young modulus of such elements through tensile tests carried out at the Instron® Applications Laboratory ‘Itw Test and Measurement Italia Srl’ (Trezzano sul Naviglio, Milan, Italy). The testing device used was a 5940 Single Column Tabletop System equipped with a load cell. Due to the slippery (waxed) surface of the fibers and their relatively small diameter, it was not an easy task to safely clamp the specimens during testing. The best solution was to clamp the specimens (with mm gauge length) into 2714 Series Pneumatic Cord and Yarn Grips (2 KN capacity). Each specimen was wrapped in paper at the point where the grips interface (Fig. 3). Tensile tests were performed at a strain rate of and a preload of 5 mm/min to 20 N. The Young’s modulus of the string was determined as the slope of the linear region of the stress–strain curve, making use a real-time image processing technique based on the video-extensometer AVE 2663-821. The mean value of (over seven measurements) was found to be 5.48 GPa (with a standard deviation of 0.16 GPa). For future use, let us inidicate the properties of the cross-strings with the subscript , and those of the horizontal strings with the subscript . On assuming cross-sectional areas of , we obtain: .
2.2 Bars
We make use of M8 threaded bars made out of white zinc plated grade 8.8 steel (DIN 976-1), which have a nominal cross-sectional area of (BS ISO 68-1,, 1998). We experimentally measured the elastic moduli of such elements through non-destructive ultrasonic tests assisted by a Panametrics® 5058PR High Voltage pulser-receiver working in pulse-echo mode. A V544 ultrasonic probe, generating 10 MHz longitudinal waves, was used to detect the speed v of the pulses excited in the bars. The Young’s modulus of the bars was computed through the equation
| (1) |
where and are the material density per unit volume and the Poisson ratio, respectively (Graff,, 1975). Three different measurements on 2 cm long samples gave an average value of the wave propagation speed equal to 5.889 m/s, and an average Young’s modulus of the bars equal to . Accordingly, the axial stiffness of the bars is .
2.3 Aluminum plates
The ‘rb’ prism features circular bases consisting of aluminum alloy 6082 plates of 12 mm thickness and 18 cm diameter, as shown in Fig. 2. The Young modulus of such plates is assumed to be equal to 69000 MPa, in line with the recommendations of the standard UNI EN 573, (2013). To a first approximation, let us replace the aluminum plates of the ‘rb’ system with triangular networks of rectangular pin-jointed beams of thickness , and width equal to three times the diameter of the bars (; cross-sectional area ). Such ‘ideal’ linkage elements have an axial stiffness , which is much higher than the stiffness of the cross-strings (), and the stiffness of the bars (). It is therefore reasonable to assume that the bases of the ‘rb’ prism behave approximately as rigid bodies during an arbitrary deformation of the system. It is also worth noting that there results . Overall, we conclude that the‘rb’ prism can be reasonably modeled as a system composed of rigid bases and bars, in line with the mechanical model presented in Oppenheim and Williams, (2000).
3 Assembling methods
We now describe the assembly methods used to manufacture the physical prisms models. These methods are based on a string-first approach in the case of ‘db’ prisms, and a base-first approach in the case of the ‘rb’ system.
3.1 Prisms with deformable bases
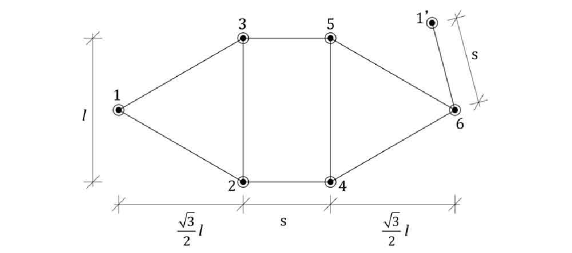
The ‘db’ systems consist of minimal regular tensegrity prisms, according to the definition given in Skelton and de Oliveira, (2010). Using the notation shown in Fig. 4, we group the elements of such prisms into two sets of horizontal strings: (top strings) and (bottom strings); three cross-strings: 1–6, 2–4, and 3–5; and three bars: 1–4, 2–5, and 3–6. Let , and denote the current lengths of the cross-strings, horizontal strings and bars, respectively. Furthermore, let denote the current prism height, and let denote the current angle of twist between the terminal bases (Fig. 4). As shown in Skelton and de Oliveira, (2010); Fraternali et al., (2014), the self-stressed (‘reference’) configuration with zero external forces is characterized by . The referential values of , , , depend on the rest lengths and of the cross-strings and horizontal strings, respectively, and the prestrain of the cross-strings. The assembly procedure of the ‘db’ prisms is as follows.
-
1.
We began by drawing segments with same lengths as the strings , , , , , , , , and on a plywood table (the ‘string table’), as shown in Fig. 5 (where 1’ denote a duplicate of node 1).
-
2.
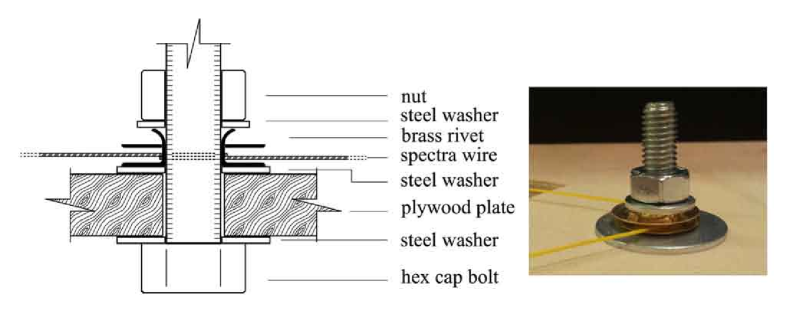
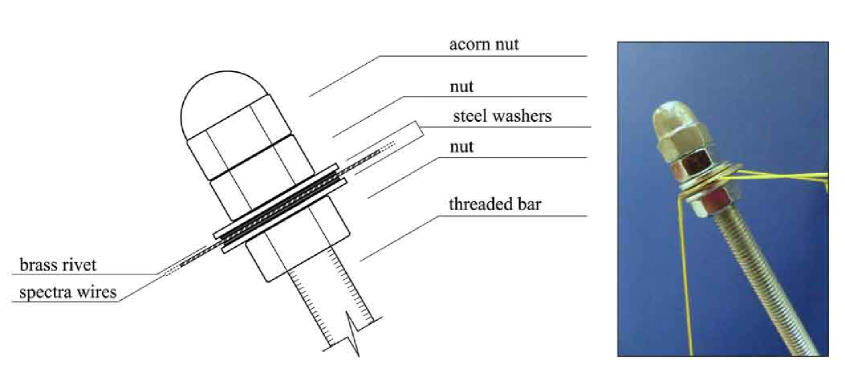
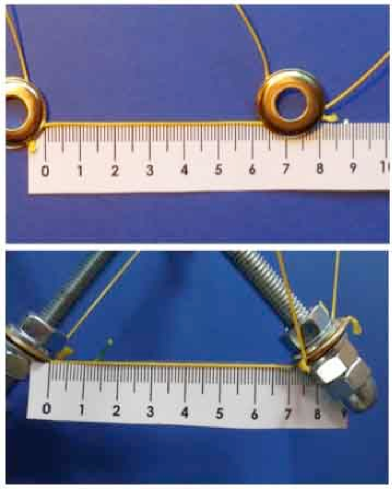
Next, we drilled holes with the same diameter as the bars corresponding to the nodes drawn on the string table, and we inserted temporary hex cap steel M8 bolts within each of these holes. We equipped the temporary bolts with two steel washers separated by a couple of male–female brass eyelets (hereafter referred to as ‘brass rivets,’ cf. Figs. 6).
-
3.
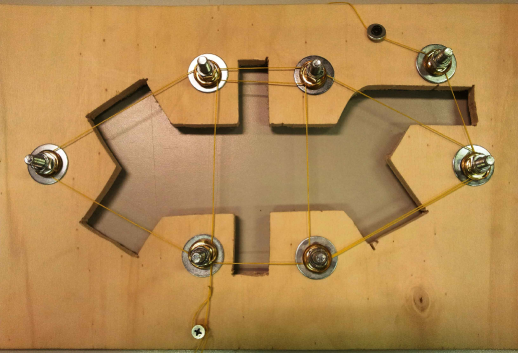
We then connected the temporary bolts with a continuous Spectra® fiber, by moving from node to node along the connection pattern 1’–6–4–2–1–3–5–6–4–5–3–2 (Fig. 5), and wrapping the Spectra® fiber around each rivet (cf. Fig. 7). Note that the above connection table leads to doubled strings in correspondence with the segments 6–4 and 5–3.
-
4.
We continued by screwing steel nuts to the temporary bolts, so as to deform the brass rivets, and lock the strings between the compressed eyelets. Next, we unscrewed the tightening nuts and removed the string network and the brass rivets from the string table (Fig. 8).
-
5.
We prepared separately the bars of the prism to be assembled, by placing steel nuts and washers just below the designated insertion points of the strings (Fig. 9).
-
6.
We then mounted the pre-assembled string network onto the bars, by placing supplementary washers and nuts on top of the brass rivets.
-
7.
We were then ready to apply the desired self-stress state, by applying tightening torques to the nuts placed below and above the brass rivets. Such a step must be accurately completed, with the aim of manufacturing a system which has three bars of approximately equal lengths, three equal length cross-strings, and six equal length horizontal strings (i.e., a regular prism). It is worth noting that the more parallel and twisted by are the bases, the more regular (or ‘symmetric’) is the prism (Skelton and de Oliveira,, 2010; Fraternali et al.,, 2014).
- 8.
3.2 Prism with rigid bases
The ‘rb’ system was assembled through a ‘base-first’ approach based on the insertion of three aluminum pieces (hereafter referred to as ‘base extensions’) on the base plates described in Section 2.3 (cf. Fig. 11). The base extensions were placed at the vertices of an equilateral triangle with side length , and were secured to the aluminum plates through screws. We drill threaded holes inclined at the desired attack angles of the bars within the base extensions, and installed steel axial joints ‘DIN 71802 AXA 13 M08’ into those cavities (Fig. 11). By connecting the bars to the steel joints, we were able to erect the ‘rb’ system in 3D. The assembly of such a system was completed with the insertion of the cross-strings into 2 mm diameter holes preliminarily drilled into the steel joints. The cross-strings were secured to the joints through lock washers (Fig. 11), and were suitably prestressed by applying tensile forces through a tennis stringing machine (‘Babolat® Sensor Expert’ stringing machine, see Fig. 12).
3.3 In situ measurement of the cross-string prestrain
A standard way to measure the cross-string prestress (which characterizes the overall self-stress state of the examined structures, see Fraternali et al., (2014)) is given by the well known vibrating wire method. Unfortunately, such a method is not easily applicable to the current structures, due to the complexity of the support conditions characterizing the string–bar joints (cf. Dubé et al., (2008)). In the ‘db’ systems, we can obtain a rough estimate of the cross-string prestrain by measuring the (average) lengths and of those strings in the assembled and unstressed configurations, respectively (it is worth observing that the strings are unstressed when the string network is removed from the string table, see Figs. 8, 13). On the other hand, estimates of the cross-string prestresses in the ‘rb’ system are offered by the tension force measurements provided by the stringing machine. The above measurements are unavoidably affected by reading errors (‘db’ systems), or tension-loss effects during the locking of the strings to the joints (‘rb’ system).
Let us assume that the prism under examination is subject to a uniform compression test (cf. Section 4), and that the corresponding axial force vs. axial displacement response is known, with measured from the self-stressed configuration (). By the axial stiffness of the prism, we refer to the slope of the curve. An in situ measurement of the cross-string prestrain can be obtained through an experimental characterization of the initial stiffness , i.e., the value of for (). The analytic expression of can be written as follows in the case of a ‘db’ system (Skelton and de Oliveira,, 2010; Fraternali et al.,, 2014)
| (2) | |||||
where, referring to the self-stressed configuration, is the ratio between the height () and the base radius () of the prism (); and , and are the stiffness coefficients of the cross-strings, horizontal-strings, and bars, respectively (Skelton and de Oliveira,, 2010; Fraternali et al.,, 2014). The above formula reduces to the following simplified expression in the case of the ‘rb’ system (, )
| (3) |
4 Quasi-static compression tests
This section presents the results of quasi-static compression tests on the ‘db’ and ‘rb’ systems, showing different aspect ratios and states of prestress. We performed compression tests through a Matest® electromechanical testing system equipped with 50 kN (thick prisms) or 200 kN (slender prisms) load cells, employing displacement control loading with a loading rate of 3 mm/min (Fig. 14). In order to facilitate the twisting of the terminal bases and to minimize frictional effects, we carefully lubricated the acorn nuts in the case of the ‘db’ systems (cf. Fig. 1), and the terminal bases in the case of the ‘rb’ systems (cf. Fig. 2), as well as the testing machine plates, before testing. In addition, we inserted two steel plates separated by an intermediate layer of 12 mm diameter steel balls at the bottom of the specimen (Fig. 14). The upper plate features a central hole, hosting a bolt attached to the bottom plate.
Table 1 shows the geometrical and mechanical properties of the tested samples, which include three thick prisms with deformable bases (systems ‘db1_a’ ,‘db1_b’, and ‘db1_c’), two slender prisms with deformable bases (systems ‘db2_a’ and ‘db2_b’), and two slender prisms with rigid bases (systems ‘rb_a’ and ‘rb_b’). The prisms with equal values of the rest lengths and differed from each other by the value of the cross-string prestrain , which was measured through the in situ identification procedure described in Section 3.3. Different states of prestress were enforced by applying different tightening torques to the nuts placed below and above the brass rivets in the ‘db’ samples (cf. Fig. 10), or different tensile forces through the stringing machine shown in Fig. 12 in the ‘rb’ samples. In Table 1, denotes the force acting on the cross-strings in the self-stressed configuration (zero external forces).
| type | (kN/m) | (m) | (m) | (N) | (m) | (m) | (m) | |
|---|---|---|---|---|---|---|---|---|
| ‘db1_a’ | 0.01 | 0.080 | 0.081 | 30.9 | 0.132 | 0.134 | 0.165 | |
| ‘db1_b’ | 0.03 | 0.080 | 0.083 | 78.2 | 0.132 | 0.136 | 0.168 | |
| ‘db1_c’ | 0.07 | 0.080 | 0.085 | 170.0 | 0.132 | 0.140 | 0.174 | |
| ‘db1_d’ | 0.06 | 0.080 | 0.085 | 140.9 | 0.132 | 0.139 | 0.171 | |
| ‘db2_a’ | 0.07 | 0.162 | 0.173 | 165.9 | 0.08 | 0.081 | 0.194 | |
| ‘db2_b’ | 0.09 | 0.162 | 0.176 | 219.9 | 0.08 | 0.082 | 0.197 | |
| ‘rb_a’ | 0.06 | 0.162 | 0.172 | 150.0 | 0.08 | 0.08 | 0.192 | |
| ‘rb_b’ | 0.11 | 0.162 | 0.181 | 286.0 | 0.08 | 0.08 | 0.200 |
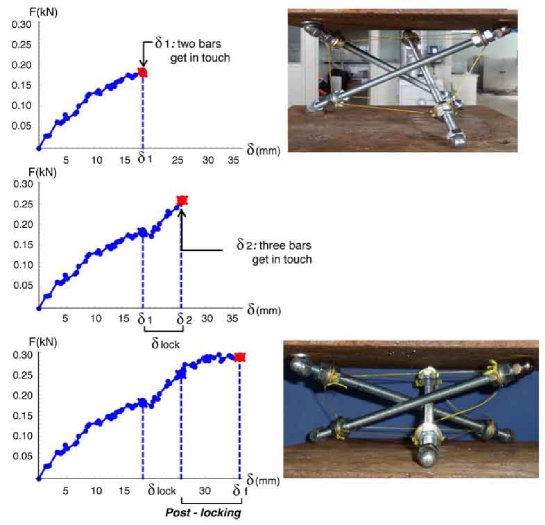
We first ran two ‘extended’ compression tests on the ‘db1_d’ and ‘db2_b’ specimens of Table 1 (cf. Figs. 15 and 16). Such tests were prolonged beyond the ‘locking’ configuration (in which the bars get in touch with each other—theoretically associated with an angle of twist , cf. Fraternali et al., (2014)). Hereafter, by stiffening, we refer to a branch of the response in which the axial stiffness increases with , and by softening, a branch which instead has decreasing with . We note that the locking of the tested specimens takes place for angles of twist appreciably lower than the theoretical value (viz., for ), due to the nonzero thickness of the bars.
The force–displacement response of the ‘db1_d’ specimen () initially features a softening branch, and noticeable oscillations of the experimental measurements, due to signal noise and the small amplitude of the applied forces (Fig. 15). In this, as well as in the other examined thick specimens (‘db1_a’ and ‘db1_b’ ), we observe two distinct locking configurations: a first one with only two bars in contact (‘first locking point,’ indicated by the marker in Fig. 15), and a second one with all three bars in contact (‘second locking point,’ denoted by the marker ). The theoretical models given in Oppenheim and Williams, (2000); Skelton and de Oliveira, (2010); Fraternali et al., (2014) instead predict a unique locking configuration with all three bars in contact. Such a mismatch of theory and experiment is explained by the unavoidable asymmetries that affect the assembly of the prism samples (bases not perfectly parallel to each other; bars, cross-strings and base-strings of slightly different lengths; initial angle of twist not exactly equal to , etc.), which may easily lead to manufacturing imperfectly regular specimens, especially in the case of thick prisms. The response of the ‘db1_c’ specimen in between the two locking points appreciably deviates from the previous ‘class-1’ behavior (no contacts between the bars, cf. Skelton and de Oliveira, (2010); Fraternali et al., (2014)). After the second locking point ‘’ is reached, the curve of the current specimen features very low stiffness , and an almost horizontal plateau (‘post-locking regime’). The post-locking behavior is characterized by marked losses of tension in the cross-strings, which get progressively slacker (Fig. 15). In such a phase, the structure no longer behaves as a tensegrity system: the bars begin to exhibit a significant bending regime, which is induced by the shear forces acting at the interface between the bars in contact. We interrupted the extended compression test of the ‘db1_c’ specimen when significant frictional forces would arise at the contact between the bars and the machine plates. The latter follow from the pronounced inclination of the bars, which tend to rub against the machine places with the non-smooth portion of the terminal acorn nuts in the post-locking phase (Fig. 15). We did not observe bar buckling and/or string yielding in the course of the present tests.
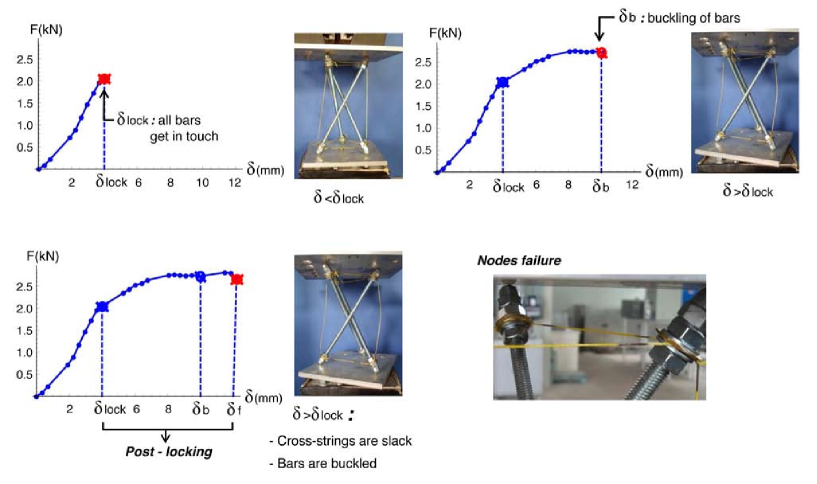
We now pass on to describing the extended compression test on the slender ‘db2_b’ specimen (), which is illustrated in Fig. 16. The initial vs. response of such a specimen is appreciably stiffening and terminates in the locking point ‘’ where all three bars are in contact (we did not observe a preliminary locking point with only two bars in contact in all the ‘db2’ specimens of Table 1). The post-locking response of the current specimen is instead markedly softening and leads first to bar buckling, and next to marked damage to the nodes (Fig. 16). As in the case of the thick specimen ‘db1_c’, we observed that the cross-strings become slack in the post-locking phase. Additionally, in the post-locking regime of the ‘db2_b’ specimen, we observed that the horizontal strings featured plastic yielding, and the nodes were affected by permanent strains (cf. Figs. 16 and 17). The final node failure is characterized by: marked permanent deformations of the brass rivets, accompanied by slipping and yielding of the horizontal strings; and noticeable fraying of the horizontal strings, due to the rubbing of the Spectra® fibers against the sharp protrusions of the brass rivets (cf. Fig 6). By comparing the responses shown in Figs. 16 and 15, we realized that the compressive loading of the slender prism ‘db2_b’ involves significantly higher axial forces and lower signal noise, as compared to the compressive loading of the thick prism ‘db1_c’.
We close the present section by examining the experimental responses of the ‘db1_a,b,c’; ‘db2_a,b’ and ‘rb_a,b’ specimens listed in Table 1 up to the locking configuration with all the bars in contact (cf. Figs. 18, 19, and 20, where the dotted lines indicate the tangents to the experimental force–displacement curves at the origin). The curves of the thick (‘db1’) specimens feature softening-type behavior up to the locking point ‘’ (Fig. 18), while the analogous curves of the slender (‘db2’ ) specimens instead appear slightly stiffening (Fig. 19). In all the systems with deformable bases, we observe an increase of the maximum axial displacement (displacement corresponding to the locking configuration ‘’) with increasing values of the prestrain . Concerning the curves of the specimens endowed with rigid bases (‘rb’ systems), we note that such curves exhibit marked stiffening, which becomes more effective for increasing values of (Fig. 20). We observed progressive node damage (‘db’ systems); fiber slipping at the brass rivets (‘db’ systems) or in correspondence with the lock washers (‘rb’ systems); and/or Spectra® fiber fraying (‘db’ systems), but no string yielding and/or bar buckling, during the course of the tests shown in Figs. 18, 19, and 20.
5 Concluding remarks
We have presented new assembly methods for tensegrity prisms, which include a string-first approach in the case of ordinary prisms, and a base-first approach in the case of prisms endowed with rigid bases. The proposed methods are easy to manage, and require common hardware materials, especially in the case of prisms with deformable bases (cf. Section 3.1). We have also presented the results of quasi-static compression tests on tensegrity prism models, with the aim of characterizing the compressive response of such structures in the large displacement regime. An in situ technique has been employed to measure the state of prestress of the tested structures (Section 3.3). We have observed different force–displacement responses of the prisms showing different aspect ratios and base constraints, noticing softening behavior in the case of thick prisms with deformable bases (Fig. 18), and, in contrast, markedly stiffening behavior in the case of slender prisms with rigid bases (Fig. 20). An intermediate, slightly softening behavior has been observed in slender prisms with deformable bases (Fig. 19).
The experimental results presented in Section 4 highlight that the rigid–elastic model given in Oppenheim and Williams, (2000); Fraternali et al., (2012) is accurate only in the case of tensegrity prisms equipped with rigid bases. Such a model indeed predicts an ‘extreme’ stiffening response in compression, which has not been observed in the experimental testing of prisms with deformable bases, especially in the case of thick prisms. It is worth noting that an accurate mechanical modeling of tensegrity structures could be very useful for the computational design of artificial materials based on periodic lattices of tensegrity units, freestanding or embedded in fluid or solid matrices, to be optimized by tuning suitable geometrical, mechanical, and prestress variables. Such a design could take advantage of optimization techniques recently formulated and employed for the optimal design of granular materials (Daraio et al.,, 2010; Ngo et al.,, 2012; Fraternali et al.,, 2010, 2011). As a matter of fact, the geometrically nonlinear (softening/stiffening) response of tensegrity prisms can be usefully exploited to design acoustic behaviors not found in natural materials, which include extremely compact solitary wave dynamics, useful for the manufacture of super focus acoustic lenses and structural health monitoring devices (stiffening systems, cf. Fraternali et al., (2012); Daraio and Fraternali, (2013)); rarefaction solitary wave dynamics, useful for the design of innovative shock absorption devices (softening systems, cf. Herbold and Nesterenko, (2012, 2013)); stop-bands, and wave-steering capabilities (2D and 3D composite systems, refer, e.g., to Leonard et al., (2013); Manktelow et al., (2013); Casadei and Rimoli, (2013) and the references therein).
Acknowledgements
Support for this work was received from the Italian Ministry of Foreign Affairs, Grant No. 00173/2014, Italy–USA Scientific and Technological Cooperation 2014–2015 (‘Lavoro realizzato con il contributo del Ministero degli Affari Esteri, Direzione Generale per la Promozione del Sistema Paese’). The authors wish to thank Saverio Spadea and Cristian Santomauro (Department of Civil Engineering, University of Salerno); Vittorio Vecchiarelli (Sporting Tennis Team, Mercogliano, Avellino, Italy); and the staff of the Dechatlon s.r.l. Sports Shop, Via A. Vivaldi 706, 84090 Montecorvino Pugliano SA, for their precious assistance with the preparation of physical tensegrity models.
References
References
- Averseng and Crosnier, (2004) Averseng, J. and Crosnier, B. Prestressing tensegrity systems – Application to multiple selfstress state structures. International Journal of Structural Stability and Dynamics 2004;4(4):543–557.
- BS ISO 68-1, (1998) BS ISO 68-1:1998. ISO general purpose screw threads. Basic profile Metric screw threads.
- Burkhardt, (2008) Burkhardt, R. W. Jr. A Practical Guide to Tensegrity Design (2008). http://www.trip.net/ bobwb/ts/tenseg/book/cover.html
- Casadei and Rimoli, (2013) Casadei, F., Rimoli, J. J., 2013. Anisotropy-induced broadband stress wave steering in periodic lattices. Int. J. Solids Struct. 50(9), 1402–1414.
- Chen et al., (2004) Chen, Z.-H., Shi, J. and Liu, X.-L. Experimental study on triangular prism unit of tensegrity 2004. Journal of Tianjin University 2004;37(4):1053–1058.
- Cunha and Caetano, (1999) Cunha, A. and Caetano, E. Dynamic measurement on stay cables of cable-stayed bridges using interferometry laser system. Exp. Tech. 1999;23(3):38–43.
- Daraio et al., (2010) Daraio, C., Ngo, D., Nesterenko, V.F. and Fraternali, F.. (2010). Highly nonlinear pulse splitting and recombination in a two-dimensional granular network. Phys. Rev. E., 82:036603.
- Daraio and Fraternali, (2013) Daraio, C., Fraternali, F., 2013. Method and Apparatus for Wave Generation and Detection Using Tensegrity Structures. US Patent No. 8,616,328, granted on December 31, 2013.
- Dubé et al., (2008) Dubé, J. F., Angellier, N. and Crosnier, B. Comparison between experimental tests and numerical simulations carried out on a tensegrity minigrid. Engineering Structures 2008;30:1905–1912.
- Duffy et al., (2000) Duffy, J., Rooney, J., Knight, B., and Crane, C. D. A Review of a Family of Self-Deploying Tensegrity Structures with Elastic Ties. The Shock and Vibration Digest 2000;32(2):100–106.
- Fest et al., (2003) Fest, E., Shea, K., Domer, B. and Smith, I. F. C. Adjustable tensegrity structures. Journal of Structural Engineering 2003;129:515–526.
- Fraternali et al., (2010) Fraternali, F., Porter, M., and Daraio, C., 2010. Optimal design of composite granular protectors. Mech. Adv. Mat. Struct. 17, 1–19.
- Fraternali et al., (2011) Fraternali, F., Marino, A. and El Sayed, T. and Della Cioppa, A., 2011. On the structural shape optimization through variational methods and evolutionary algorithms. Mech. Res. Commun. 18, 225–243.
- Fraternali et al., (2012) Fraternali, F., Senatore, L. and Daraio, C. Solitary waves on tensegrity lattices. Journal of the Mechanics and Physics of Solids 2012;60:1137–1144
- Fraternali et al., (2014) Fraternali, F., Carpentieri, G., Amendola, A. On the mechanical modeling of the extreme softening/stiffening response of axially loaded tensegrity prisms. E-print, arXiv:1406.1913 [cond-mat.mtrl-sci], 2014.
- Fuller, (1959) Fuller, R. B. Tensile integrity structures (1959). US patent 3.063.521.
- Graff, (1975) Graff, K.F. Wave Motion in Elastic Solids (1975). Courier Dover Publications.
- Herbold and Nesterenko, (2012) Herbold, E. B. and Nesterenko, V. F., 2012. Propagation of rarefaction pulses in discrete materials with strain-softening behavior. Phys. Rev. Lett. 110, 144101.
- Herbold and Nesterenko, (2013) Herbold, E. B., Nesterenko, V. F., 2013. Propagation of rarefaction pulses in particulate materials with strain-softening behavior. AIP Conf. Proc. 1426, 1447–1450.
- Lalvani, (1996) Lalvani, H. Origins of tensegrity: views of Emmerich, Fuller and Snelson. International Journal of Space Structures 1996;11: 27– 55.
- Leonard et al., (2013) Leonard, A. and Fraternali, F. and Daraio, C., 2013. Directional Wave Propagation in a Highly Nonlinear Square Packing of Spheres. Exp. Mech. 53(3), 327–337.
- Manktelow et al., (2013) Manktelow, K.L., Leamy, M.J., and Ruzzene, M., 2013. Topology design and optimization of nonlinear periodic materials. J. Mech. Phys. Solids 61(12), 2433–2453.
- Motro, (2003) Motro, R. Tensegrity: Structural Systems for the Future. Kogan Page Science 2003, London.
- Nagase and Skelton, (2014) Nagase, K. and Skelton, R.E. Minimal Mass Tensegrity Structures. Journal Of The International Association For Shell And Spatial Structures 2014; 55(1):37–48, ISSN:1028-365X.
- Oppenheim and Williams, (2000) Oppenheim, I. and Williams, W. Geometric effects in an elastic tensegrity structure. J. Elast. 2000;59:51–65.
- Ngo et al., (2012) Ngo, D. and Fraternali, F. and Daraio, C. (2012). Highly nonlinear solitary wave propagation in Y-shaped granular crystals with variable branch angles. Phys. Rev. E., 85:036602.
- Panigrahi et al., (2010) Panigrahi, R., Bhalla, S. and Gupta, A. Development and Analysis of a Prototype Dismountable Tensegrity Structures for Shelter Purposes. International Journal of Earth Sciences and Engineering 2010;3(4):561–578.
- Sadao, (1996) Sadao, S. Fuller on tensegrity. International Journal of Space Structures 1996;11: 37–42.
- Shekastehbandi et al., (2013) Shekastehband, B., Abedi, K. and Dianat, N. Experimental and numerical study on the self-stress design of tensegrity systems. Meccanica 2013, Springer.
- Skelton and de Oliveira, (2010) Skelton, R. E. and de Oliveira, M. C. Tensegrity Systems (2010). Springer.
- Tibert and Pellegrino, (2002) Tibert, A. G. and Pellegrino, S. Deployable tensegrity reflectors for small satellites. Journal of Spacecraft and Rockets 2002;39(5):701–709.
- UNI EN 573, (2013) UNI EN 573. Aluminium and aluminium alloys - Chemical composition and form of wrought products - Part 3: Chemical composition and form of products (november 7, 2013).