Music and Vocal Separation Using Multi-Band Modulation Based Features
Abstract
The potential use of non-linear speech features has not been investigated for music analysis although other commonly used speech features like Mel Frequency Ceptral Coefficients (MFCC) and pitch have been used extensively. In this paper, we assume an audio signal to be a sum of modulated sinusoidal and then use the energy separation algorithm to decompose the audio into amplitude and frequency modulation components using the non-linear Teager-Kaiser energy operator. We first identify the distribution of these non-linear features for music only and voice only segments in the audio signal in different Mel spaced frequency bands and show that they have the ability to discriminate. The proposed method based on Kullback-Leibler divergence measure is evaluated using a set of Indian classical songs from three different artists. Experimental results show that the discrimination ability is evident in certain low and mid frequency bands ( - Hz).
Key Words: Music Voice Separation, Music discrimination, modulation features
I Introduction
Increased availability and use of large digital music corpora, requires intelligent music management systems. This has resulted in the development of a variety of intelligent music content management systems. Automatic segmentation of song into vocal and music regions is a very important step for several applications like singer identification, musical instrument analysis, preference based searches of music, to name a few. Audio search, annotation and browsing applications also benefit greatly with automatic music voice segmentation. Early work in this area includes the work carried out by Berenzweig and Ellis [1] where they suggest the use of an artificial neural network (ANN) to train on radio recordings to segment songs into vocal and non-vocal (music) regions. Kim and Whitman [2] filter the audio signal using a bandpass filter and then used hormonicity as a measure to detect vocal regions and separate them from music. More recently, Sridhar and Geetha [3], identified swaras in South Indian classical music by finding the pitch for a particular segment which in turn gives information about middle octave swara. Ramona et al [4] use support vector machine to separate singing voice from pure instrumental region while Demir and others [5] use hidden Markov model (HMM) based acoustic models to calculate posterior probabilities to segment an audio signal as speech and music. Zhou [6] discriminates voice and music using novel spectral feature like averaged cepstrum. and Kos et al [7] on-line segment speech music for broadcast news domain using Mel-Frequency Cepstral Coefficients Variance (MFCCV). Barbedo and others [8] propose a mechanism to discriminate speech and music signal by extracting four features and then combining them linearly into a unique parameter. Didiot [9] propose a wavelet based signal decomposition instead of Fourier Transform for discriminating speech and music. In most of the work cited above the use of conventional speech features is apparent because of processing audio using linear system theory. In this paper, we propose and investigate the use of non-linear feature set to discriminate speech and music. Non-linear speech models attempt to model the spectral variability of the speech signal and decompose it into amplitude modulation (AM) and frequency modulation (FM) components. Modulation of the amplitude and/or frequency of a sine wave has been used extensively in communication systems for transmitting information [10], [11].
Use of nonlinear analysis for speech processing [12] has of late received attention specifically for speaker recognition, speech analysis, voice pathologies, speech recognition and speech enhancement. Specifically, decomposing a non-stationary, bandpass signal into its AM and FM components has been addressed by many researchers and a number of techniques have been published in literature. The most popular approaches are based on the auditory motivated decomposition proposed by Quatieri et al [10] and Teager energy based algorithms proposed by Dimitrios et al [13]. Features derived using non-linear speech framework could reveal the potential of alternative speech models in various speech applications such as speaker identification [14], vocal fold pathology assessment [15] and even emotion classification [16]. Dimitrios et al [17] have used these AM-FM features for phoneme classification and speech recognition tasks [18]. They concluded that these non-linear speech features could be efficiently used in speech classification and recognition tasks.
In this paper, we use Teager energy based algorithm [13] to obtain modulation based features from an audio stream. These features are then used in a supervised learning scheme for segment-wise discrimination of vocal and music component in an audio stream. We first analyze the signal to obtain the instantaneous frequency distribution in a number of Mel scale signified frequency bands for the entire duration of the audio stream. The task of identifying an audio segment as being vocal or music is determined by measuring the well known Kullback-Leibler divergence between the distributions of reference music and vocal regions with the corresponding distributions of the test audio stream. The rest of the paper is organized as follows: Section II explains the theory of non-linear speech modeling and feature extraction method, Section III explains about the data and the methodology used in our experiments. We conclude in Section IV.
II Modulation based feature extraction
Audio signal is non-linear, time-varying and can be looked upon as a AM-FM model as follows (as mentioned in [13])
| (1) |
where, is the time varying amplitude and is defined as
| (2) |
where is the center frequency and is the maximum frequency deviation from the , and is some arbitrary constant phase offset. The time varying instantaneous angular frequency id defined as
| (3) |
Note that (1) has both an AM and FM structure hence we call an AM-FM signal. It has been shown that this non-linear modeling of speech helps in extraction of robust features for speech [18]. These features measure the amount of amplitude and frequency modulation that exists in the audio signal and attempt to model aspects of speech acoustic information. Further, two different information signals can be simultaneously transmitted in the amplitude and the frequency . Such AM-FM signals are very frequently used in communication systems [10]. The AM-FM model can be used to represent a speech signal as a sum of AM-FM signals, namely
| (4) |
where is the number of speech formats. Clearly, and for represents the speech signal . Now, given a speech signal over some time interval, the problem is to estimate the amplitude envelope and the instantaneous frequency of each and at each time . One of the ways to estimate and , is to first isolate individual resonance by bandpass filtering the speech signal around its formants and then estimating amplitude and frequency modulating signals of each resonance based on an ”energy-tracking operator” as described in [10]. The Teager energy operator (TEO) is defined as,
| (5) |
When given by (5) is applied to the bandpass filtered speech signal (1), we get the instantaneous source energy, namely,
| (6) |
In the discrete form as is applicable to most speech processing systems [19] (5) can be written as
| (7) |
where is the sampled speech signal.
The AM-FM demodulation can be achieved by separating the instantaneous energy given in (6) into its amplitude and frequency components. is the main ingredient of the first Energy Separation Algorithm (ESA) developed in [13] and used for signal and speech AM-FM demodulation.
| (8) |
and
| (9) |
where and is the FM component at sample and is the AM component at sample . In practice the speech signal is bandpass filtered using Gabor filters because of their optimal time-frequency discriminability [13], namely,
| (10) |
where is given by,
| (11) |
where is the center frequency and is the bandwidth of the Gabor filter. In the case of speech or audio signals, a Gabor filter-bank (placed at various critical band frequencies such as formant frequencies or at frequencies determined by Mel-scale) with a narrow bandwidth are used. The extraction of AM-FM components (8) and (9) from the bandpass filtered signal may be carried out using the Teager energy of the filtered signal. The efficiency of non-linear speech features, namely instantaneous modulation features such as instantaneous amplitude and instantaneous frequencies around different resonance frequencies of the speech signal have been studied for various applications in speech processing area such as phoneme classification, speech recognition [17, 18], assessment of vocal fold pathology [15], stress detection [20]. In this paper, we investigate the performance of instantaneous frequency modulation features to automatically discriminate vocal and music dominant regions in an audio track. The hypothesis that the instantaneous modulation feature distribution may be different for vocal and music dominant regions is derived from the observation that the generative sources of voice and music are different. For instance, the singing voice (vocal) is replete with large pitch modulations unlike the music component. Additionally, the voice harmonics in the spectrum are observed to be below kHz where as the music energy is observed to be spread throughout the spectrum up to kHz with certain frequency bands dominated entirely by the music energy.
III Experimental results and discussion
To identify and test the performance of non-linear features for voice music separation, we collected several audio signals which had portions of speech (or voice) and music. Distinct voice and music are an essential part of Indian classical music; so we collected a large set of Indian classical music and stored them in wav format. The collection database consisted of a total length of approximately s of audio stream. The audio was sampled at kHz and was manually labeled as (for voice) or (for music) using a semi-automatic process and later manually checked for the correctness of classification. We use the Mel spaced Gabor filter-bank [17] to filter the audio into the first three bands. For each of these filtered signal we computed the non-linear instantaneous features. We restricted our analysis to the lower three filter bands as in our preliminary investigations, we found that the discrimination power to segment voice and music is evident in these three bands. Further it was observed that the instantaneous amplitudes in various bands are not discriminative enough for different audio segments. Hence in all our experiments we have not considered instantaneous amplitudes. The three Mel-spaced center frequencies ( in (11)) we have analyzed are, Hz, Hz and Hz with a bandwidth ( in (11)) of Hz, Hz and Hz respectively. These reference audio segments which have been tagged as and are first bandpass filtered using Gabor filter-bank (11) at three different ’s namely, , and . Instantaneous frequency components are obtained for each of the filtered signal using (8) and (9). Figure 1 to Figure 6 show the typical distributions for vocal () and music () segments of the audio. We took the audio signal and extracted the instantaneous frequencies using three different Gabor filters. We then segregated the instantaneous frequencies based on the tags, namely, and . These tags are used to get the instantaneous feature distribution for voice and music segments of the audio, for three different bands, namely, band 1 (center frequency ), band 2 (center frequency ) and band 3 (center frequency ) are shown in Figure 1, Figure 2 and Figure 3 respectively.
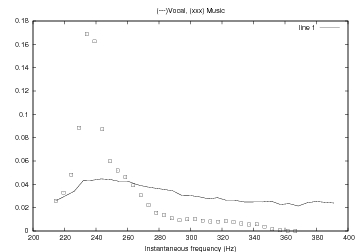
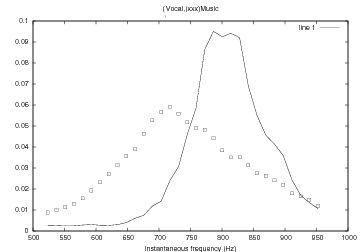
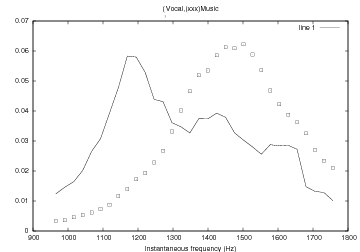
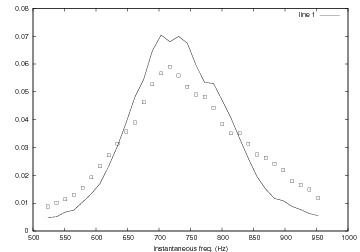
It can also be seen from the distribution plots that the instantaneous frequency has a very distinct distributions for voice and music segments in all the three frequency bands. Additionally, the instantaneous frequency distribution of similar tags (namely, for and ) show similar distribution (see Figures 4, 5 and 6). This observation suggested that non-linear speech parameters do have the ability to distinguish voice and music components very reliably.


In all our experiments we use the Kullback-Leibler (KL) divergence metric, namely,
| (12) |
to compare the distance between any two distributions. If and are two distributions then the distance of the distribution from is given by (12).
In all we had voice and musics segments of which segments had the tag and segments had the tag . Is segment was of an average duration of s. The reference instantaneous frequency distribution for the voice and music segments of the audio signal is computed from the reference vocal and music segments for all the three bands. The reference is created using % of the segments in each category, namely segments for and segments for , and the rest namely segments of and segments of which were not part of the reference segments were used to test the performance of the proposed approach to recognize and . Using these audio reference ( segments for and segments for ) we construct the distributions and . A test audio segment () is taken (which is not part of the audio that has been used to create the reference) and the instantaneous frequency distribution of is computed, as . The distribution of the test segment () is compared with the distribution of the reference music and reference vocal distributions using (12). Namely, we compute and . If the is classified as , else is classified as .
A fold cross validation was used to arrive at the performance of using non-linear features to discriminate voice and speech. Table I tabulates the fold cross validation experimental results.
| Number of | Number of | Number of | |
|---|---|---|---|
| Segments | Misrecognised | Correct Recognitions | |
| Vocal () | 22 | 128 (85 %) | |
| Music () | 12 | 78 (78%) |
As it can be seen the use of non-linear features for segmentation of voice and music is able to segment music and voice quite well. The use of MFCC as the features resulted in large number of misrecognitions as compared to the misrecognitions dues to non-linear instantaneous frequency features.
IV Conclusions
Use of non-linear speech features has not been used for music and voice classification though it has been used in some areas of speech recognition, speaker identification. In this paper we have used the instantaneous frequency calculated over band filtered speech signal to discriminate speech and voice. We first assumed a sum of modulated sinusoidal model for audio signal and investigated the performance of instantaneous frequency modulation feature in discriminating voice and music segments. We used Gabor filters to restrict the analysis to a limited number of carrier frequencies which are nothing but the center frequencies of the bandpass filters. We first observed that the distribution of the instantaneous frequency feature over three bands (centered at 240, 738 and 1361) is able to discriminate voice and music. This observation was exploited to classify the audio stream into music and voice segments. Future work would involve extensive testing of the method with larger data-set for consistency of the results and testing across various genres of music.
Acknowledgment
The authors would like to thank the members of the TCS Innovation Labs - Mumbai for the great working environment.
References
- [1] A. L. Berenzweig and D. P. W. Ellis, “Locating singing voice segments to improve artist classification of music,” pp. 21–24, Oct. 2001.
- [2] Y. E. Kim and B. Whitman, “Singer identification in popular music recordings using voice coding features,” in in Proc. 5th International Conf. on Music Information Retrieval, Nagoya, Japan, Oct. 2004.
- [3] R. Sridhar and T. V. Geetha, “Swara indentification for South Indian classical music,” in ICIT Proceedings of the 9th International Conference on Information Technology. IEEE Computer Society, 2006, pp. 143–144.
- [4] G. R. Mathieu Ramona and B.David, “Vocal detection in music with support vector machines,” in Acoustics, Speech and Signal Processing, 2008. ICASSP 2008. IEEE International Conference, 2008, pp. 1885–1888.
- [5] C. Demir and M. Dogan, “Speech-music segmentation system for speech recognition,” in Signal Processing and Communications Applications Conference, 2009. SIU 2009. IEEE 17th, 2009, pp. 624–627.
- [6] J. R. Huiyu Zhou, Sadka A. and B. Univ., “Feature extraction for speech and music discrimination,” in Content-Based Multimedia Indexing, 2008. CBMI 2008. International Workshop, 2008, pp. 170–173.
- [7] V. D. Kos M., Grasic M. and K. Z, “On-line speech/music segmentation for broadcast news domain,” in Systems, Signals and Image Processing, 2009. IWSSIP 2009. 16th International Conference, 2009, pp. 1–4.
- [8] L. Barbedo, Jayme Garcia Arnal and Amauri, “A robust and computationally efficient speech/music discriminator,” New Paltz,NY, pp. 571–588, 2006.
- [9] D. F. E. Didiot, I. Illina and O. M. Loria, “A wavelet-based parameterization for speech/music discrimination,” in Computer Speech and Language Volume 24, Issue 2, 2010, pp. 341–357.
- [10] T. F. Quatieri, T. E. Hanna, and G. C. O-Leary, “Am-fm separation using auditory-motivated filters,” IEEE Trans. Speech and Audio Proc., vol. 5, pp. 465–480, Sep. 1997.
- [11] M. Schwartz, Information Transmission, Modulation, and Noise. New York: McGraw-Hill, 1980.
- [12] M. Faúndez-Zanuy, L. Janer-García, A. Esposito, A. Satué-Villar, J. Roure, and V. Espinosa-Duro, Eds., Nonlinear Analyses and Algorithms for Speech Processing, International Conference on Non-Linear Speech Processing, NOLISP 2005, Barcelona, Spain, April 19-22, 2005, Revised Selected Papers, ser. Lecture Notes in Computer Science, vol. 3817. Springer, 2006.
- [13] P. Maraso, J. F. Kaiser, and T. F. Quatieri, “Energy separation in signal modulations with applications to speech analysis,” IEEE Trans. Signal Proc., vol. 41, pp. 3024–3051, 1993.
- [14] S. Wenndt and S. Shamsander, “Speaker identification based on nonlinear speech models,” in in 29th Asilomar Conference on Signals, Systems and Computers, 1995, p. 1031.
- [15] L. G. C. John, J. H. L. Hansen, and J. F. Kaiser, “Vocal fold pathology assessment using am auto-correlation analysis of the teager energy operator,” in in Fourth Int. Conf. Spoken Language, vol. 2, 1996, pp. 757 – 760.
- [16] G. Hui, C. Shanguang, and S. Guangchuan, “Emotion classification of mandarin speech based on teo nonlinear features,” Software Engineering, Artificial Intelligence, Networking, and Parallel/Distributed Computing, ACIS International Conference on, vol. 3, pp. 394–398, 2007.
- [17] D. Dimitriadis and P. Maragos, “Continuous energy demodulation methods and application to speech analysis,” Speech Communication, vol. 48, pp. 819–837, 2006.
- [18] D. Dimitriadis, P. Maragos, and A. Potamianos, “Robust am-fm features for speech recognition,” IEEE Signal Process. Lett., vol. 12, pp. 621–624, 2005.
- [19] J. H. H. Guojun Zhou and J. F. Kaiser, “Nonlinear feature based classification of speech under stress,” IEEE Trans. Signal Proc., vol. 9, p. 203, March 2001.
- [20] R. Mandar and H. John, “Frequency distribution based weighted sub-band approach for classification of emotional/stressful content in speech,” in in EUROSPEECH-2003, 2003, pp. 721–724.