Eclipsing binary stars in the Large Magellanic Cloud. Results from the EROS-2, OGLE and VMC surveys††thanks: Based on observations made with VISTA at the Paranal Observatory under program ID 179.B-2003.
Abstract
We present a catalogue of 1768 eclipsing binary stars (EBs) detected in the Large Magellanic Cloud (LMC) by the second generation of the EROS survey (hereinafter EROS-2); 493 of them are new discoveries located in outer regions (out of the central bar) of the LMC. These sources were originally included in a list of candidate classical Cepheids (CCs) extracted from the EROS-2 catalogue on the basis of the period (0.89 15.85 days) versus luminosity ( mag) diagram. After visual inspection of the light curves we reclassified them as eclipsing binaries. They have blue colours ( 0.2 mag) hence we classed them as hot eclipsing binaries (HEBs) containing hot massive components: main sequence (MS) stars or blue giants. We present -band light curves for 999 binaries from our sample that have a counterpart in the VISTA near-infrared ESO public survey of the Magellanic Clouds system (VMC). We provide spectral classifications of 13 HEBs with existing spectroscopy. We divided our sample into contact-like binaries and detached/semi-detached systems based on both visual inspection and the parameters of the Fourier decomposition of the light curves and analysed the period-luminosity () relations of the contact-like systems using the and magnitudes at maximum light. The contact-like binaries in our sample do not follow relations. We analysed the sample of contact binaries from the OGLE III catalogue and confirmed that and sequences are defined only by eclipsing binaries containing a red giant component.
keywords:
Stars: binaries: eclipsing – galaxies: Magellanic Clouds – surveys – techniques: photometric
1 Introduction
Eclipsing binary stars (EBs) are particularly important to study stellar evolution and stellar structure, since some fundamental stellar parameters can be determined using geometrical constraints of the systems. Masses are estimated dynamically via radial velocities, radii from the eclipse durations and the temperature ratio (strictly the surface-brightness ratio) from the eclipse depths. The radii and temperature together are used to measure the luminosity of the system. From the estimated luminosity and observed fluxes the distances to the EBs can be determined. This method requires photometric and spectroscopic data (see reviews by Andersen 1991; Torres et al. 2010) and is used to measure the distances to nearby galaxies. Recently, Pietrzyński et al. (2013) used EBs to measure a distance to the Large Magellanic Cloud (LMC) which is considered to be accurate to 2%. Moreover, analysis of EBs allows to estimate stellar ages by comparing the mass-radius relation with stellar evolution models.
The classification of EBs is based on the distance between components, relative to their sizes. If the two components do not fill their Roche lobes, the system is considered to be a detached binary. In a semi-detached binary one of the two components fills its Roche lobe and mass transfer occurs. In contact eclipsing binaries both stars fill their Roche lobes. To classify contact and detached/semi-detached binaries analysis of the Fourier parameters (see Section 3) and visual inspection of the light curves are necessary. W UMa type stars are contact binary systems with orbital periods typically less than 1 day, composed of main sequence (MS) turn-off stars (Rucinski, 1998). It was shown that this class of binaries could be used as distance indicators since the size of the two components could be determined from the orbital period, which in combination with the colour information allows one to derive absolute magnitudes (Rucinski 1997, and references therein). Indeed, Rucinski (1997) used the method to determine the distance to W UMa-type contact systems in the Galactic Bulge.
Rucinski (1998) analysed contact systems with orbital periods longer than 1 day, discovered in Baade’s Window by the OGLE project. He found that there are two classes of such EBs that had passed the Fourier light-curve shape filter. The first group included W UMa type systems with orbital periods extending to days. These objects could be the most massive representatives of the population of old, close binary systems that are entering the final stages of evolution, before merging of the two components, or analogues of the contact blue stragglers in globular clusters. The second group contained long-period red binaries. Rucinski (1998) suggested that the latter are not contact binaries, but rather systems composed by a red giant or subgiant, close to filling its Roche lobe, that is tidally distorted by the interaction with the companion which is assumed to be invisible (a MS star or a collapsed object). The source of variability is therefore an ellipsoidal variation of the distorted star. Given that the Fourier filter passes genuine contact binaries as well as sources which have light curves with a contact-binary-like shape such as the ellipsoidal variables, we classify all systems which satisfy the Fourier analysis/visual inspection as contact-like binaries. While W UMa type stars in the Galaxy seem to be limited to periods days, massive, young, blue systems of W UMa type with longer orbital periods of 2-3 days exist in the LMC (Rucinski, 1999). These objects may follow a period-luminosity () relation as suggested by Rucinski (1999). One of the aims of the current research was to check this statement.
In the past years a number of microlensing surveys such as OGLE (Udalski et al., 1997), MACHO (Alcock et al., 1997) and EROS (Tisserand et al., 2007) have discovered thousands of variable stars of different types in the Magellanic Clouds. A significant fraction of these variables are EBs. Nine different catalogues of EBs detected in the LMC by the microlensing surveys have been presented. During the first stage of the EROS survey, 79 candidate EBs were identified in the bar of the LMC (Grison et al., 1995). The MACHO survey identified an initial sample of 611 LMC EBs (Alcock et al., 1997). Subsequently, Derekas et al. (2007) reanalysed the eclipsing variables in the MACHO database, corrected their periods and presented a “clean” sample of 3031 EBs. Faccioli et al. (2007) provided a new sample of 4634 EBs in the LMC from the MACHO catalogue, expanding the previous sample of 611 objects from Alcock et al. (1997). Using the OGLE II data 3332 EBs were identified in the LMC (Wyrzykowski et al. 2003, Groenewegen 2005, Graczyk & Eyer 2010). Graczyk et al. (2011) provided a sample of 26121 LMC EBs detected by the OGLE III survey. Finally, Soszyński et al. (2012) identified 1377 EBs and 156 ellipsoidal variables in the Gaia South Ecliptic Pole (GSEP111The GSEP is an area of about 5.3 deg2 around the South Ecliptic Pole, of which a central rhombus-shaped portion of 5 0.7 deg2 corresponds to the region that the European Space Agency satellite Gaia, launched on December 19th, 2013, is observing repeatedly during commissioning.) area based on the OGLE IV survey.
In this paper we present a catalogue of 1768 EBs observed in the LMC by the EROS-2 survey. This survey monitored both the inner and outer regions of the LMC and more than a quarter of the EBs in our sample are new discoveries, not yet identified by other surveys. The stars were originally selected as candidate classical Cepheids (CCs). However, visual inspection of their light curves and the position on the colour-magnitude diagram (CMD) revealed they are, in fact, EBs containing hot massive components (MS stars or blue giants). These bright, relatively young objects (mainly concentrated near the central bar and northwest spiral arm) trace the regions of recent star-formation activity in the LMC. We present the results of the analysis of the 1768 EBs and discuss the general properties of the sample.
We apply Rucinski (1997)’s method to classify the binaries by Fourier analysis of the light curves and divide our sample into contact-binary-like and non-contact (detached and semi-detached) systems. We then check whether the contact-binary-like systems follow a relation using the magnitudes and the -band data provided by the VISTA near-infrared survey of the Magellanic Clouds system (VMC; Cioni et al., 2011). Using the VMC -data we also investigate the near-infrared relation of the whole sample of contact binaries in the OGLE III catalogue.
In Section 2 we describe the method of selection and the general properties of our EROS-2 sample of EBs. In Section 3 we outline the procedure we used to classify the contact binaries. In Section 4 we present the relations of contact binaries extracted from the EROS-2 and OGLE III catalogues. A summary of our results is provided in Section 5.
2 Data
2.1 EROS-2 sample
The EROS-2 microlensing survey has monitored about 88 deg2 of the LMC discovering a large number of CCs, RR Lyrae stars, binaries and long period variables (LPVs), both in the centre and in the outer regions of the galaxy. The survey was carried out with the Marly 1-m telescope at ESO, La Silla, from July 1996 to February 2003. Observations were performed in two wide passbands, the so-called band centered close to the standard band, and the band intermediate between the standard and bands222The passband covers the wavelength interval from 420 to 720 nm, the passband covers the interval from 620 to 920 nm. (Tisserand et al., 2007). The EROS magnitudes can be transformed to the Johnson-Cousins standard system to a precision of 0.1 mag, using the following equations from Tisserand et al. (2007):
| (1) |
| (2) |
The detection of variable stars and the determination of periods () were performed by an automatic pipeline based on the Analysis of Variance (AoV) method and software developed by Beaulieu et al. (1997) and Schwarzenberg-Czerny (2003) (see Marquette et al. 2009 and references therein for further details). As part of the collaboration between EROS-2 and VMC team members a sample of 5800 LMC candidate CCs was extracted from the whole EROS-2 photometric catalogue of candidate variable stars by visually selecting them in the versus diagram on the basis of the relation of CCs. The right panel of Figure 6 of Moretti et al. (2014) shows how the selection was performed. The selected candidate CCs have EROS-2 periods in the range days, and mean magnitudes in the range mag. The faint magnitude/short period limit allows to reduce the contamination of the candidate CC sample by shorter period variables, such as the RR Lyrae stars, whereas the bright magnitude/long period limit reflects the bright cut of the EROS-2 data available to us (see Figure 6 of Moretti et al. 2014). and time-series photometry (and related errors), periods, and mean magnitudes for these 5800 LMC sources were kindly made available to us by the EROS-2 team. Figure 1 shows the , CMD of the candidate CCs after transforming the , average magnitudes of the sources to , standard magnitudes by applying equations 1 and 2. As it could be seen in Fig. 1 the candidate CCs are distributed in three different regions of the CMD: mag (2085 objects), mag (3402 stars) and mag (313 objects). These regions are marked by dashed lines in the figure. We visually inspected the light curves of the stars in all three samples with the GRaphical Analyser of TIme Series (GRATIS) software developed at the Bologna Observatory by P. Montegriffo (see, e.g., Clementini et al. 2000), and discovered that the majority of the objects with colours bluer than 0.33 mag are EBs; objects with colours mag are bona-fide CCs, and stars with colours mag are LPVs. The latter objects accidentally fall in the sample of the candidate CCs, according to the and criteria, because their EROS periods are aliases of the actual periods, which are usually in the range from tens to thousands of days.
The EROS-2 visual photometry of the bona-fide CCs is being used in combination with the VMC photometry to study the relation of CCs and determine the distances to the different regions of the LMC (Ripepi et al., 2012a, b). In the present paper we focus on the sample of EBs contaminating the candidate CCs. Hence, in the following sections we will specifically describe the analysis of the 2085 sources with mag (this corresponds to objects with 0.2 mag). We explicitly note that the EROS-2 catalogue of candidate variables contains a much larger number of EBs, however, their study is beyond the purposes of the present paper.

The analysis of the EBs contaminating the CC sample was performed running GRATIS on the light curves and showed that 83 objects from the sample are bona-fide CCs, 225 are small-amplitude variables, nine objects have light curves which are too noisy to be classified, and 1768 stars are EBs. Information on these EBs is presented in Tables 1 and 2. Coordinates and mean , magnitudes are taken from the EROS-2 catalogue. Periods also generally are those in the EROS-2 catalogue, however an asterisk marks those stars which period was recalculated in this work.Example light curves are shown in Figure 2 with additional information about periods and number of data-points.

and time-series photometry of the EBs is provided in Table LABEL:EROS_phot._More_details_on_the_content_of_these_and_other_tables_in_the_paper_and_specifically_on_the_accuracy/precision_of_the_various_entries_is_provided_in_the_Appendix_section.

Figure 3 shows histograms of the distributions of mean magnitudes and colours for our sample of EBs. The mean and magnitudes range from 17.8 to 13.2 mag (which obviously reflect the initial cuts in magnitude used to extract the sample of candidate CCs from the EROS-2 catalogue) and from 18.1 to 13 mag, respectively, with a peak around 17.1-17.2 mag in both bands. The colours range from to 0.33 mag and peak at 0.3 mag, which reflects instead the colour selection we applied in the CMD of Figure 1 to separate binaries from bona-fide CCs. Hence, according to their blue colours the EBs in our sample are mainly composed of hot components (MS stars or blue giants), for this we have classified them as “hot eclipsing binaries” (HEBs).
It is remarkable the effectiveness of the candidate CCs selection based only on the PL relation in producing also an almost pure sample of HEBs. Indeed, by extrapolating the Moretti et al. (2014) findings we expect only a few (about 50) further EBs with colour between 0.33 and 1.677 mag to still contaminate the CCs sample. On the other hand, we cannot estimate the degree of completeness of our LMC HEB sample since we only had access to the portions of the EROS-2 catalogue corresponding to the candidate Cepheids and RR Lyrae stars. However, judging from the right panel of Moretti et al.’s Figure 6 the EROS-2 catalogue contains a vast number of objects with 0.2 mag. We suspect that many of them are HEBs.

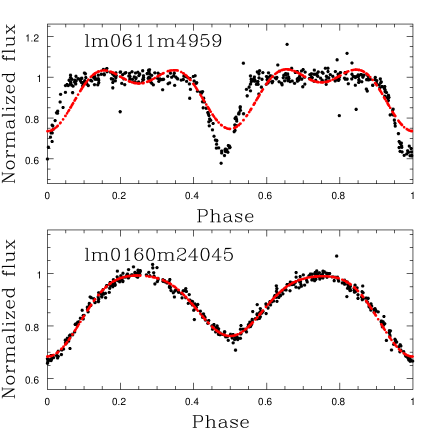
We have compared the periods provided by EROS-2 to those determined by the visual inspection of light curves with GRATIS (). For the majority of binaries is in good agreement with . However, in some cases, the was a harmonic or a subharmonic of the actual period. We corrected the period of 225 objects in the sample by multiplying by different constants until the shape of the light curve was consistent with that of an EB. The same technique was used by Derekas et al. (2007) as part of the redetermination of periods for 3031 EBs in the MACHO catalogue. Example of the light curves before and after the period correction are presented in Figure 4. The systems in the middle and bottom panels of Figure 4 have rather eccentric orbits which hinders the automatic determination of the period. In some cases it was not clear if EROS-2 determined aliases of the true period or if the binary star had only one strong expressed minimum. For these objects we decided to use the periods provided by EROS-2.
We studied the period distribution of our sample of EBs even though the true periods of these objects cover a relatively narrow range (from to days). The distribution of periods is shown in Figure 5. Most of our EBs are short-period systems. The distribution sharply peaks between 1 and 2 days and the majority of EBs in our sample (94%) have periods shorter than 5 days.

2.2 Cross-correlation with other catalogues of EBs in the LMC
We cross-correlated our sample of 1768 HEBs with the catalogues of EBs identified in the LMC by other microlensing surveys. Specifically, we considered: the first stage of the EROS survey (Grison et al. 1995), the MACHO survey (Alcock et al. 1997; Derekas et al. 2007; Faccioli et al. 2007), the OGLE III (Graczyk et al. 2011) and IV (Soszyński et al. 2012) surveys. Objects in the various catalogues were cross-identified when their right ascension and declination differed by less than , and the periods differed by less than 1%. We also considered objects located within less than and with the ratio of the periods approximately equal to integer numbers, in case one of the surveys had picked harmonics or subharmonics of the true period. We used a rather large pairing radius in order to avoid missing counterparts of our EBs in other catalogues, however, we note that the vast majority of the counterparts were found to be within a pairing radius of (OGLE III: 99%; MACHO from Faccioli et al. 2007: 57%; MACHO from Derekas et al. 2007: 63%; EROS: 100%).
Twenty-five out of seventy-nine EBs detected in the LMC bar by the first stage of the EROS microlensing survey (Grison et al. 1995) have a counterpart in our sample of HEBs. Panel (a) of Figure 6 shows the position of those 25 EBs (green dots) on the map of our 1768 HEBs (black dots).
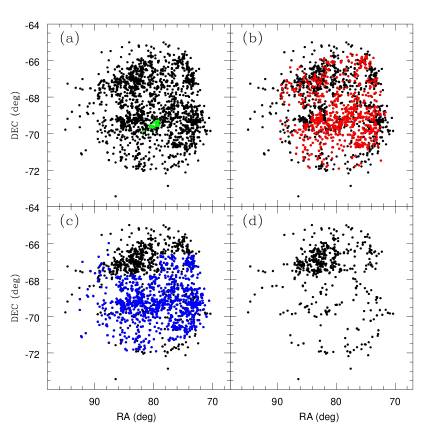
The cross-correlation with Derekas et al. (2007) and Faccioli et al. (2007) catalogues of EBs detected in the LMC by the MACHO survey shows that 797 objects were already known (panel (b) of Fig. 6). The cross-correlation with the sample of 26121 EBs from the OGLE III catalogue (Graczyk et al. 2011), the 1377 EBs and the 156 ellipsoidal stars in the OGLE IV catalogue (Soszyński et al. 2012) showed that 1074 objects were already known (panel (c) of Fig. 6). We also cross-matched our sample with the spectroscopy of massive stars available from the VLT-FLAMES surveys of Evans et al. (2006,2011), in the NGC 2004, N11 and 30 Doradus regions of the LMC. Eight objects from our sample have been observed by these surveys: four stars in 30 Doradus, two in NGC 2004 and two in N11, as summarized in Table 3. Four of these eight objects have a counterpart in the OGLE III catalogue, one was observed by the MACHO project, three objects have not been detected before. Optical spectroscopy is available for a further five of our detected EBs, from observations with the AAOmega multi-object spectrograph on the Anglo-Australian Telescope, one of these objects has not been detected by previous surveys.
To summarize, a total amount of 1275 sources in our EROS-2 HEBs sample had previously been detected by other surveys (OGLE III, OGLE IV, MACHO, EROS, with the FLAMES and AAOmega spectrographs), whereas 493 are new identifications. The positions of these new discoveries in the LMC are shown in panel (d) of Figure 6. As expected they are mainly located in the outer regions of the LMC.
We also compared our corrected periods with the periods from other catalogues of EBs (MACHO, OGLE III, OGLE IV). Among the 225 objects for which we corrected the period 163 were also detected by the OGLE III survey, and our corrected periods are in good agreement (to within 1%) for all but one system. Another 6 and 19 objects with corrected periods were observed by the OGLE IV and MACHO (Faccioli et al. 2007, Derekas et al. 2007) surveys, respectively. The corrected periods for all of these are in good agreement with the published values (to within 1%). In conclusion, of the 225 objects for which we corrected the periods, 188 were detected by other surveys and our estimates are confirmed in all but one of these cases (i.e. ).
Figure 7 shows the comparison of the periods used in this paper with those provided by the OGLE III and OGLE IV catalogues for the 1072 objects in common. Two objects, namely lm0185l23772 and lm0030n12500 are not shown in the plot because their OGLE III periods are harmonics of the periods derived in this paper so they differ significantly. We checked the light curves of these objects with GRATIS and could not confirm the periods in the OGLE III catalogue. In particular, for lm0185l23772 (OGLE-LMC-ECL-09445) we confirmed the period provided by the EROS-2 catalogue (P=4.97 days), whereas for lm0030n12500 (OGLE-LMC-ECL-20762) we determined a new period (P=1.4998 days) which is one third of the period provided by EROS-2, while OGLE III determined a period approximately equal to two thirds of the EROS-2 period. The light curves of these objects are presented in Figure 8. Apart from these two objects, the periods adopted in this paper and those in the OGLE III generally differ by less than 0.03% (see Figure 7).


2.3 Characteristics of EBs with existing spectroscopy
2.3.1 Cross-matches with the VLT-FLAMES surveys
As already mentioned in Section 2.2, eight HEB systems in our sample have existing optical spectroscopy from surveys with FLAMES at the VLT (Evans et al. 2006, Evans et al. 2011), as summarized in Table 3. All were detected as binaries in the multi-epoch spectroscopy, except for VFTS 462 (Dunstall et al. in prep). In addition to the EROS-2 periods, estimates are also available from the OGLE III data for the four VFTS systems (Graczyk et al. 2011), with excellent agreement in all cases; the other four systems (in NGC 2004 and the N11 region) are beyond the OGLE III survey area.
Quantitative analysis of the VFTS spectra is still underway, but evolutionary mass estimates (of the primaries) of the other systems are available from Hunter et al. (2008); 13 for both N11-107 and N11-119, and 11 and 10 for NGC 2004-079 and NGC 2004-094, respectively333However, note that these estimates were on the basis of effective temperatures adopted from the spectral classifications, and the expected uncertainties on these masses is typically 30% (Hunter et al., 2008). Photospheric chemical abundances were presented for the two systems in NGC 2004 by Hunter et al. (2009), with seemingly unremarkable nitrogen abundances. The spectroscopy from the FLAMES surveys was effective in detecting spectroscopic binaries, but further monitoring is generally required to characterize the orbital parameters (e.g., Ritchie et al. 2012). Indeed, spectroscopic monitoring of a subset of the O-type binaries discovered by the VFTS is now underway (P.I. Sana), and includes VFTS 061 among its targets.
2.3.2 AAOmega spectroscopy
Optical spectroscopy is available for a further five of our detected EBs, from observations with the AAOmega multi-object spectrograph on the Anglo-Australian Telescope, obtained during 2006 February 22-24 (P.I. van Loon). The five targets discussed here were obtained as part of two fields centred on N11 and 30 Dor. AAOmega is a twin-arm spectrograph (providing simultaneous blue/red coverage), but only the blue data are discussed here. Both fields were observed on the first night with the 1700B grating and two central wavelengths (4100 and 4700 Å), giving coverage of 3765-5015 Å, at a resolution of 1 Å. The 30 Dor field was also observed on the second night with the 1500V grating, at a central wavelength of 4375 Å, providing coverage of 3975-4755 Å, at a resolution of 1.25 Å. These data were reduced using the AAOmega reduction pipeline and the relevant spectra were rectified and co-added.
Spectral classifications for the five systems are presented in Table 3, in which we have employed the same framework as that used by Evans et al. 2014 (in prep.). All five systems have early B-type spectra (in line with the expectation of these as HEBs), with morphological evidence for binarity (double-lined and/or asymmetric profiles) in all but one.
3 Classification of eclipsing binaries
Our classification of the EBs was based on both the Fourier analysis (Rucinski 1993,1997 and Maceroni & Rucinski 1999) and the visual inspection of the light curves.
Rucinski (1993) showed that a simple description of the light variation of contact binaries could be obtained through the cosine Fourier decomposition . Rucinski (1997) performed the Fourier analysis of the -band light curves to extract a sample of contact binaries from OGLE EBs in nine fields in Baade’s Window. In this study we use an updated version of this method, developed by one of us (C.M). We fitted the light curves of the 1768 HEBs in our sample with a model light curve consisting of six Fourier terms:
| (3) |
In equation 3 the coefficient is the average magnitude of the model fit, and represent the difference in depth between two eclipses, the sine term is related to lack of symmetry between maxima, reflects the total amplitude of the binary variability and is related to the eclipse “peakedness” that goes to zero for the light curves of contact binaries. Hence, the combination of the two cosine coefficients and could serve as a separator of contact and non-contact binaries. Namely, the curve described by the relation , where both coefficients are negative, separates the regions of the contact and non-contact binaries on the versus plane (Rucinski, 1993). However, as mentioned in the Introduction, not only genuine contact binaries, but also variables with contact-like light curves such as the ellipsoidal variables might be misclassified as contact binaries. Ellipsoidal variability is observed in close binary systems when one or both components is (are) distorted by the tidal interaction with the companion. The main reason of the variability is the change of the projected areas on the sky because of the orbital motion of the components. Large samples of ellipsoidal variables were published by Soszyński et al. (2004), who used OGLE II and OGLE III photometry, and by Derekas et al. (2006), who used the MACHO database. Since the light curves of contact binaries and non-eclipsing ellipsoidal variables have similar shapes and could be easily mistaken, we adopt the term “contact-binary-like” systems for all objects passed by the Fourier filter.
By analysis of the Fourier decomposition of the light curves in the passband we identified the contact-like binaries in our sample. The light curves were not expressed in magnitudes but in intensity units, relative to the maxima at phases in the range [0.24, 0.26]. Columns from 8 to 13 of Tables 1 and 2 present the 6 Fourier coefficients to of the Fourier analysis for the 493 new HEBs and for the 1275 HEBs already detected by other surveys, separately. Figure 9 depicts examples of the resultant fits for both contact-like (lower panel) and non-contact (upper panel) binary systems. It should be noticed that six harmonics generally allow very satisfactory fits for contact-like systems, whereas some noticeable differences arose between the observations and the fitted curves for non-contact binaries, which would indeed require a much larger number of harmonics (8-10 or more) to be modelled. This is often due to elliptical orbits, yielding a shift of the secondary minimum from phase 0.5 of the non-contact systems.
Figure 10 shows the position of 1768 EBs from our sample in the versus plane. The solid line in the figure shows the contact locus line defined by Rucinski (1993). We classified objects located below the line as contact-like binaries (324 sources) and those above as non-contact binaries (1444 sources). However, being aware that detached and semi-detached systems could accidentally appear below the locus line due to a bad fit of the light curve, we visually inspected the light curves of all the objects (324 stars) located below the line; we discovered eight objects which have light curves without the characteristic form of contact binaries, so we discarded them.
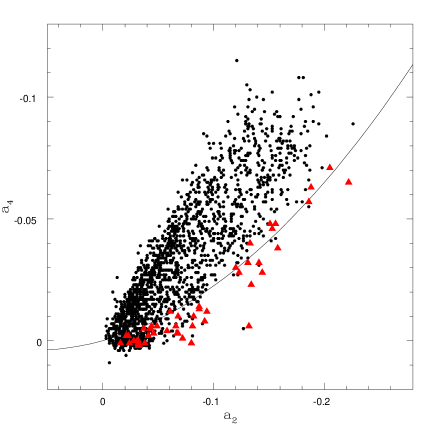
In conclusion, in our analysis a system is classified as contact-like if it is located below the locus line from Rucinski (1993) on the versus plane and its light curve has the characteristic shape of a contact system.
We compared our classifications with those from the OGLE III catalogue. Out of 1055 objects in common, 48 stars were classified as contact systems in the OGLE III catalogue (red filled triangles in Figure 10). Figure 10 shows that the majority of these objects are in fact located below the locus line traced by Rucinski (1993), while the majority of the systems classified as non-contact variables by OGLE III are above the curve. However, eight objects located marginally above the locus line were classified as contact binaries by OGLE III. We checked their light curves and confirmed that these binaries are indeed contact-like systems. When including these, the final number of contact-like binaries in our sample is 324. In contrast, 50 of 1055 objects in common were classified as contact-like systems by us, but as detached, semi-detched or ellipsoidal systems by OGLE III. We double checked their light curves, and found that our classification is in disagreement with OGLE III in some cases. The majority of these objects have low amplitudes so it is difficult to provide an exact classification by visual inspection of light curves. In the following analysis we use our classification for those objects, thus our final sample consists of 324 contact-like binaries and 1444 non-contact systems.
4 Period-Luminosity relation of eclipsing binaries
4.1 PL-relation of EBs from the EROS-2 sample
The relation of blue, luminous contact systems, observed in the LMC by the MACHO project, was studied by Rucinski (1999). He suggested the existence of a relation at maximum light in the visual band, but with a large scatter, possibly due to unaccounted effects of the interstellar extinction. Following Rucinski (1999) we have investigated whether our sample of HEBs follows a relation at maximum light using the red passband photometry of EROS-2 () and near-infrared photometry in the -band obtained as part of the VMC survey (Cioni et al. 2011). The latter was used in order to minimize possible extinction effects.

Started in 2009, the VMC survey aims at covering a total area of 116 in the LMC with 68 contiguous tiles. The -band observations are taken in time-series mode over 12 (or more) separate epochs. Each single epoch reaches a limiting band magnitude mag (see Figure 1 of Moretti et al. 2014). On the bright side, VMC is limited by saturation which produces an essential departure from linearity starting at mag. Aperture photometry of the VMC images is performed by the Cambridge Astronomical Survey Unit (CASU) through the VISTA Data Flow System (VDFS) pipeline. The reduced data are then sent to the Wide Field Astronomy Unit (WFAU) in Edinburgh where they are catalogued by the Vista Science Archive (VSA; Lewis et al. 2010; Cross et al. 2012). To date, the complete multi-epoch dataset is available for ten LMC tiles, whereas a further seven tiles have been observed at least once (observations completed until the 1st of April 2013). These 17 tiles sample different regions of the LMC from the inner bar to the outer regions.
We have cross-matched our catalogue of 1768 HEBs against the VMC catalogue available at VSA (observations completed until the 1st of April 2013) for the 17 tiles and found 999 binaries in common using a pairing radius of 1′′. Examples of the and light curves for some of these binaries are shown in Figure 11. The time-series photometry is provided in Table 5. The number of phase-points of the -band light curves varied from a minimum of one for EBs located in tiles with incomplete observations to a maximum of over 30 phase points for EBs located in regions where different tiles overlap. Furthermore, the EBs in our sample are relatively bright sources. Therefore the shallow VMC epochs, for which the integration time of observation is half that for deep epochs, or epochs not meeting the original quality criteria (e.g., seeing, etc.) were enough to measure the EBs thus increasing the number of available phase-points.
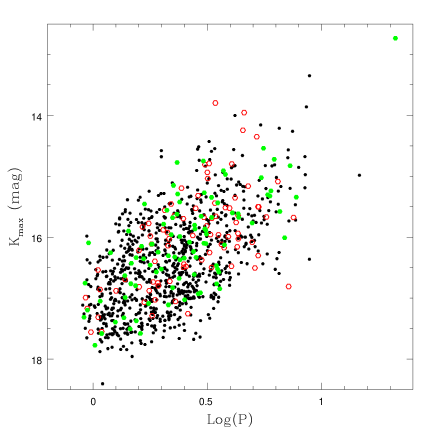
The and magnitudes at maximum light of the binaries that have a VMC counterpart are presented in Table 6. In order to better determine the -band magnitudes at maximum light, we performed an additional analysis of the light curves with GRATIS, for those HEBs which have 13 or more good-quality observations. Figure 12 shows the distribution in the band of the 999 EBs with a VMC counterpart, whereas Figure 13 shows their distribution in the band. In both figures red open circles identify the sources which we classified as contact-like systems. The contact binaries for which we have 13 or more -band epochs (and for which maximum magnitudes were determined with GRATIS) are highlighted in green. Unfortunately, the use of a more robust method to determine the magnitude at maximum light does not decrease the scatter. Both the optical and near-infrared distributions exhibit a very large dispersion, which is of the same order of the scatter observed in the relation originally used by the EROS-2 team to extract the candidate CCs from the EROS-2 general catalogue of LMC variables (see upper-right panel of Fig. 12 in Moretti et al. 2014). Furthermore, the comparison with Fig. 12 of Moretti et al. (2014) shows that the EBs are in fact responsible for the large scatter observed in the candidate CCs in the EROS-2 bands. Thus, there does not appear to be a PL relation for HEBs.
4.2 -relation of EBs from the OGLE III catalogue
In order to study the relation of contact binaries in a more general sample and over a larger range of periods we have used the OGLE III catalogue of EB stars published by Graczyk et al. (2011). We extracted all the objects which were classified as contact binaries in the Graczyk et al. (2011) catalogue. Among them we selected objects with VMC counterparts and, with both and magnitudes from OGLE III, giving 563 objects in total. Twenty-five of these have their counterparts in our sample of HEBs from the EROS-2 catalogue and were already discussed in Section 4.1. To account for extinction we used the LMC reddening maps derived by Haschke et al. (2011) on the basis of OGLE III data. To compute extinction values in the various bands we used the relations from Schlegel et al. (1998) and Cardelli et al. (1989), these were then applied to correct each source.
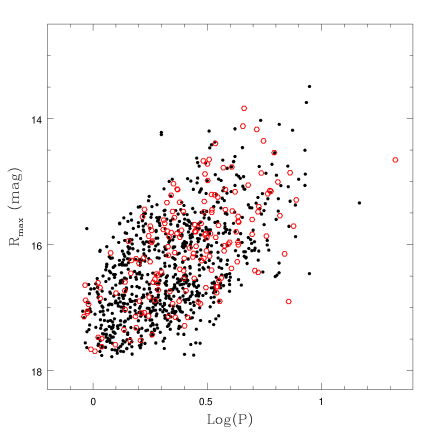
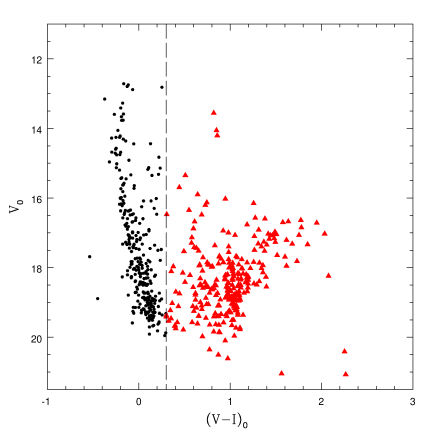
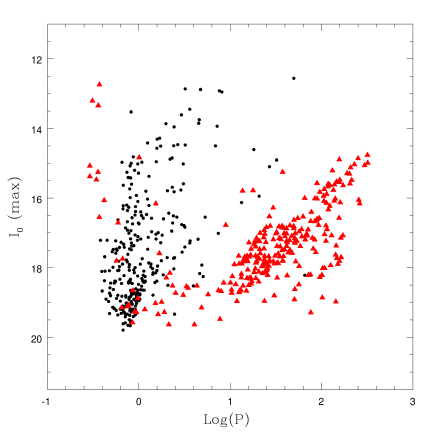
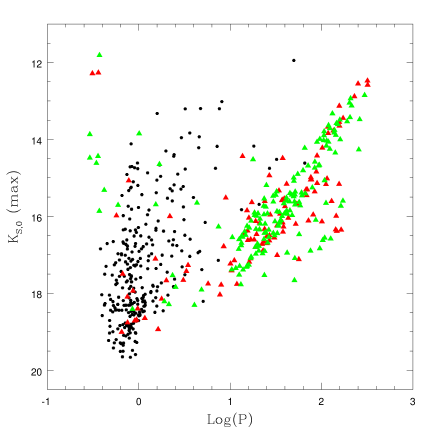
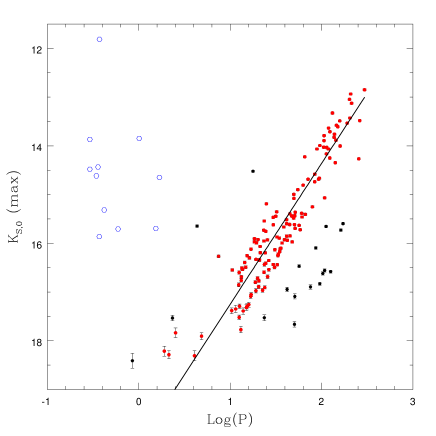
The reddening corrected CMD of contact binaries from the OGLE III catalogue is shown in Figure 14. Contact binaries are located in two regions in the CMD: HEBs which contain MS stars or blue giants have mag, whereas EBs with a red giant component have mag. The corresponding distributions in the and bands are presented in Figures 15 and 16, respectively. In the figures HEBs are indicated with black dots and binary systems containing red giants are indicated with red triangles. For 164 EBs with a red giant component, which have 13 or more good-quality epochs from the VMC survey, we analysed the light curves with GRATIS in order to determine the magnitude at maximum light with a good accuracy. In Fig. 16 we have highlighted these objects with green triangles. While contact HEBs from the OGLE III sample do not distribute along a sequence, contact binaries containing red giant components seem to follow at least one, maybe two, different sequences.
To further investigate this point we restricted our analysis to 164 objects with carefully determined maximum magnitudes (green triangles in Fig. 16). Their PL distribution is shown in Figure 17. As it could be seen, there are 11 objects with low periods which do not follow any PL sequence (blue open circles in Fig. 17). We checked the position of these objects on the CMD (Fig. 14) and found that they are located in the border region between HEBs and binaries with red giant components. Since these objects do not follow the PL sequence and could be HEBs, we discarded them from the following analysis.
For other 153 EBs we computed a weighted linear regression through the data by progressive discarding objects which deviate more than from the linear regression. The majority of contact systems with carefully determined maximum magnitudes (red dots in Figure 17) appear to follow the relation :
| (4) |
with rms=0.406 mag.
In Figure 17 we have highlighted objects located more than from the PL distribution with black dots. Some of them seem to follow a PL sequence parallel to the one described by equation 4 and located mag fainter than the previous one.
To summarize, hot contact binary systems do not follow any relation while the existence of red giant sequence(s) (at least, one) seems quite clear and, as shown by Figs. 15 and 16, this relation appears to be narrower in the passband. However, the large scatter make it impossible to use these sequences any further. On the other hand, that red giants follow multiple PL relations was already reported in many studies (Wood et al. 1999, Soszyński et al. 2004, Derekas et al. 2006). Wood et al. (1999) were the first to recognize five different -sequences: A, B and C, occupied by pulsating red giants, D composed by stars that have long secondary periods (LSPs), and sequence E, containing red giants in contact eclipsing binaries and ellipsoidal variables. Soszyński et al. (2004) showed that a relation of ellipsoidal variables could be well described by a simple model using the Roche-lobe geometry and that sequences E and D merge at specific luminosities. Derekas et al. (2006) presented a period-luminosity-amplitude analysis of 5899 red giant and binary stars in the LMC from the MACHO database and discovered that the sequence of binaries is composed only by contact EBs, while detached and semi-detached systems are spread everywhere in the plane. Moreover, they concluded that sequence E, is located at periods a factor two greater and overlaps with the sequence of LSPs (sequence D). In our study we confirm the existence of a sequence containing contact binaries with red giant components (equation 4) and find evidence for a possible additional sequence of contact binaries located mag fainter.
Furthermore, thanks to the depth achieved by the VMC data, we are able to extend the PL relation of contact binaries, containing red giants, to 18 mag, roughly two magnitudes fainter than in Derekas et al. (2006). The existence of PL relation(s) for red giant EBs and its absence for HEBs could be explained by intrinsic differences occurring between the two samples. In the case of contact systems with red giants the total luminosity of the binary system is dominated by one component - the red giant star, the luminosity of the second component being negligible. On the contrary, for HEBs the ratio of luminosities of the two O-B components could vary significantly. Therefore, the scatter of the relation of binaries with O-B components is expected to be much larger than the scatter of the relation of contact systems with a red giant component.
5 Summary
We have presented results from the analysis of 1768 EB stars detected by the EROS-2 survey in the LMC; 493 are new identifications of eclipsing systems, generally located in the outer regions of the galaxy. The EBs in our sample contain hot MS stars and blue giants, as illustrated by the spectral classifications for 13 of these binaries. We analysed the light curves of the 1768 HEBs and re-determined the previously-defined periods for 225 of them. Following Rucinski (1993), we divided the sample into contact-like (324) and non-contact (1444) systems by visual inspection of their light curves and by analysis of the Fourier decomposition parameters. We presented -band light curves for 999 of these EBs which have counterparts in the catalogue of the VMC survey. We analyzed the relation in the optical ( and ) and bands of the contact-like binaries in our EROS-2 sample and in the more extended sample of OGLE III contact EBs. Hot contact binaries do not follow relations in the and passbands, while binaries containing a red giant component do follow sequences in the and passbands. We computed the weighted linear regression of the PL relation in the passband. There is a possible additional sequence located mag fainter, but the number of objects following it, is too small to allow a reliable fit. The existence of a PL sequence of contact and ellipsoidal variables down to 16 mag was claimed in previous studies (Derekas et al., 2006), in this work we extended the PL down to 18 mag. The luminosity ratios of the components of the HEBs (MS stars and blue giants) can vary significantly. In contrast, in contact systems with a red giant component, the giant dominates the luminosity and the contribution from the secondary is usually negligible. As a consequence the relation of contact HEBs can be much more scattered than the of contact EBs with a red giant component.
Acknowledgments
We are grateful to Prof. Slavek Rucinski for carefully reading the manuscript and for his valuable comments. This work was partially supported by the Gaia Research for European Astronomy Training (GREAT-ITN) Marie Curie network, funded through the European Union Seventh Framework Programme ([FP7/2007-2013] under grant agreement n. 264895. We warmly thank P. Montegriffo for the development and maintenance of the GRATIS software. This work made use of EROS-2 data, which were kindly provided by the EROS collaboration. The EROS (Expérience pour la Recherche d’Objets Sombres) project was funded by the CEA and the IN2P3 and INSU CNRS institutes. We acknowledge the OGLE team for making public their catalogues. We thank the UK VDFS team for providing calibrated data products under the support of the STFC. Financial support for this work was provided by PRIN-INAF 2008 (P.I. M. Marconi), COFIS ASI- INAF I/016/07/0 (P.I. M. Tosi) and by PRIN-MIUR 2010 (2010LY5N2T) “Chemical and Dynamical evolution of the Milky Way and Local Group galaxies” (PI F. Matteucci). RdG acknowledges research support from the National Natural Science Foundation of China (NSFC) through grant 11373010. This work was partially supported by the Argentinian institutions CONICET and Agencia Nacional de Promoción Científica y Tecnológica (ANPCyT).
References
- Alcock et al. (1997) Alcock C. et al., 1997, AJ, 114, 326
- Andersen (1991) Andersen J., 1991, A&AR, 3, 91
- Beaulieu et al. (1997) Beaulieu J. P . et al., 1997, A&A, 321, L5
- Cardelli et al. (1989) Cardelli J. A., Clayton G. C. & Mathis J. S., 1989, ApJ, 345, 245
- Cioni et al. (2011) Cioni M.-R. L. et al., 2011 ,A&A, 527, A116
- Clementini et al. (2000) Clementini G. et al., 2000, AJ, 120, 2054
- Cross et al. (2012) Cross N. J. G. et al., 2012, A&A, 548, A119
- Derekas et al. (2006) Derekas A., Kiss L. L., Bedding T. R., Kjeldsen H., Lah P., Szabó Gy. M., 2006, ApJ, 650, L55
- Derekas et al. (2007) Derekas A., Kiss L.L. & Bedding T.R., 2007, ApJ, 663, 249
- Evans et al. (2006) Evans C. J., Lennon D. J., Smartt S. J., Trundle C., 2006, A&A, 456, 623
- Evans et al. (2011) Evans C. J. et al., 2011, A&A, 530, A108
- Faccioli et al. (2007) Faccioli L., Alcock C., Cook K., Prochter G. E., Protopapas P., Syphers D., 2007, AJ, 134, 1963
- Graczyk & Eyer (2010) Graczyk D. & Eyer L., 2010, Acta Astron., 60, 109
- Graczyk et al. (2011) Graczyk D. et al., 2011, Acta Astron., 61, 103
- Grison et al. (1995) Grison P. et al, 1995, A&AS, 109, 447
- Groenewegen (2005) Groenewegen M. A. T., 2005, A&A, 439, 559
- Haschke et al. (2011) Haschke R., Grebel E. K. & Duffau S., 2011, AJ, 141, 158
- Hunter et al. (2008) Hunter I. et al., 2008, A&A, 479, 541
- Hunter et al. (2009) Hunter I. et al., 2009, A&A, 496, 841
- Lewis et al. (2010) Lewis J. R., Irwin M., Bunclark P., 2010, in Yoshihiko M., Koh-Ichiro M., Masatoshi O., eds, ASP Conf. Ser. Vol. 434, Astronomical Data Analysis Software and Systems XIX. Astron. Soc. Pac., San Francisco, p. 91
- Maceroni & Rucinski (1999) Maceroni C. & Rucinski S. M., 1999, AJ, 118, 1819
- Marquette et al. (2009) Marquette J. B. et al., 2009, A&A, 495, 249
- Moretti et al. (2014) Moretti M. I. et al., 2014, MNRAS, 437, 2702
- Pietrzyński et al. (2013) Pietrzyński G. et al., 2013, Nat, 495, 76
- Ripepi et al. (2012a) Ripepi V., Moretti M. I., Clementini G., Marconi, M., Cioni M. R., Marquette J. B., Tisserand P., 2012a, Ap&SS, 341, 51
- Ripepi et al. (2012b) Ripepi V. et al., 2012b, MNRAS, 424, 1807
- Ritchie et al. (2012) Ritchie B. W., Stroud V. E., Evans C. J., Clark J. S., Hunter I., Lennon D. J., Langer N., Smartt S. J., 2012, A&A, 537, A29
- Rucinski (1993) Rucinski S. M., 1993, PASP, 105, 1433
- Rucinski (1997) Rucinski S. M., 1997, AJ, 113, 407
- Rucinski (1998) Rucinski S. M., 1998, AJ, 115, 1135
- Rucinski (1999) Rucinski S. M., 1999, Acta Astron., 49, 341
- Schlegel et al. (1998) Schlegel D. J., Finkbeiner D.P & Davis M.,1998, ApJ, 500, 525
- Schwarzenberg-Czerny (2003) Schwarzenberg-Czerny A., 2003, Interplay of Periodic, Cyclic and Stochastic Variability in Selected Areas of the H-R Diagram, 292, 383
- Soszyński et al. (2004) Soszyński I. et al., 2004, Acta Astron., 54, 347
- Soszyński et al. (2012) Soszyński I. et al., 2012, Acta Astron., 62, 219
- Tisserand et al. (2007) Tisserand P. et al., 2007, A&A, 469, 387
- Torres et al. (2010) Torres G., Andersen J. & Giménez A., 2010, A&AR, 18, 67
- Udalski et al. (1997) Udalski A., Kubiak M., Szymanski M.,1997, Acta Astron., 47, 319
- Walborn et al. (2014) Walborn N. R. et al., 2014, A&A, 564, A40
- Wood et al. (1999) Wood P. R. et al., 1999, in IAU Symp. 191, Asymptotic Giant Branch Stars, ed. T. Le Bertre, A. Lébre, & C. Waelkens (San Francisco: ASP), 151
- Wyrzykowski et al. (2003) Wyrzykowski L. et al., 2003, Acta Astron., 53,1
Appendix
Main properties and Fourier parameters of the light curves for 493 new HEBs and for 1275 HEBs which were already detected by other surveys are presented in Tables 1 and 2, respectively. The tables provide the EROS-2 identification numbers (column 1) and coordinates (RA and DEC at J2000; columns 2 and 3) of the EBs. Periods (column 4) for the majority of stars are from the EROS-2 catalogue, while for 225 sources marked by an asterisk periods were recalculated in this study. Number of digits in the periods are the same as originally listed in the EROS-2 and OGLE III (for Table 3) catalogues. Mean and magnitudes are listed in columns 5 and 6 respectively. The EROS-2 team provided us values with three digits as computed using all observations involved in the period determination (e.g. after excluding outliers), however we rounded them to two digits to account for the typical errors of the individual data-points which vary from 0.02 to 0.08 mag depending on magnitude (see Table 4). Column 7 lists the epochs of minimum light in the passband we calculated in this study, they are listed with four digits, in agreement with the actual precision of EROS-2 HJDs (see below). Columns from 8 to 13 present the parameters of the Fourier decomposition in the passband calculated in this study. We provide complete time-series data in the EROS-2 passbands of all 1768 EBs from the EROS-2 catalogue in the electronic version of the paper. As an example, Table 4 presents the and time-series photometry and related errors for the eclipsing binary lm0023n11843. All magnitude values are listed with 3 digits as originally given to us by the EROS-2 team. Similarly, HJDs are listed with 5 digits as provided by the EROS-2 catalogue, however they are accurate to within 10 s. Complete time-series data in the -band for 999 EBs in common between the EROS-2 and VMC catalogues is available in the electronic version of the paper. As an example, Table 5 shows the -band time series data and related errors for EB lm0023n11843. All magnitude values are listed with 3 digits as originally listed in the VSA archive.HJDs of the time-series data are accurate to within 6 digits. In the electronic version of the tables missing data are always marked as 99.999 (for magnitudes) and 9.999 (for errors).
Finally, Table 6 provides information about the cross-identifications (EROS-2 and VMC IDs) for 999 EBs in common between the two catalogues, their periods and the and magnitudes at maximum light.
| EROS-2 id | RA | DEC | Period | Epoch(min) | ||||||||
| (J2000) | (J2000) | (HJD2,450,000) | ||||||||||
| (deg) | (deg) | (day) | (mag) | (mag) | ||||||||
| lm0323n20546 | 80.4206 | 66.8744 | 0.900708 | 17.24 | 17.06 | 1851.6263 | 0.879 | 0.028 | 0.167 | 0.014 | 0.062 | 0.0030 |
| lm0341k8979 | 83.66655 | 66.30307 | 0.911721 | 17.00 | 16.75 | 1173.7244 | 0.882 | 0.032 | 0.173 | 0.011 | 0.074 | 0.0 |
| lm0344m26510 | 83.0365 | 67.12818 | 0.912445 | 17.32 | 17.18 | 1751.8628 | 0.917 | 0.01 | 0.117 | 0.0020 | 0.052 | 0.0060 |
| lm0342k18196 | 82.89531 | 66.75002 | 0.941447 | 17.03 | 16.82 | 434.8095 | 0.911 | 0.0060 | 0.111 | 0.0010 | 0.045 | 0.0050 |
| lm0346l14981 | 82.79685 | 67.5609 | 0.941548 | 17.04 | 17.07 | 1657.5184 | 0.985 | 0.025 | 0.035 | 0.011 | 0.017 | 0.0 |
| lm0341k18581 | 83.73331 | 66.3684 | 0.947627 | 17.37 | 17.22 | 1981.6242 | 0.985 | 0.033 | 0.0060 | 0.0050 | 0.0050 | 0.0030 |
| lm0341k4660 | 83.61982 | 66.27231 | 0.953374 | 17.34 | 17.09 | 1869.6179 | 0.932 | 0.0070 | 0.107 | 0.011 | 0.069 | 0.0050 |
| lm0340m15852 | 83.06971 | 66.35575 | 0.958465 | 17.46 | 17.28 | 2310.7127 | 0.979 | 0.062 | 0.019 | 0.017 | 0.0060 | 0.0070 |
| lm0542k20454 | 72.90434 | 70.96458 | 0.965838 | 17.37 | 17.32 | 1659.4784 | 0.975 | 0.048 | 0.039 | 0.032 | 0.02 | 0.0040 |
| lm0362n18001∗ | 86.56198 | 66.88331 | 1.950688 | 17.32 | 17.31 | 1125.6826 | 0.978 | 0.0040 | 0.023 | 0.0020 | 0.0010 | 0.0 |
∗ Star with period re-determined based on our study of the light curve.
The table is published in its entirety as Supporting Information with the electronic version of the article. A portion is shown here for guidance regarding its form and content.
| EROS-2 id | RA | DEC | Period | Epoch(min) | ||||||||
| (J2000) | (J2000) | (HJD2,450,000) | ||||||||||
| (deg) | (deg) | (day) | (mag) | (mag) | ||||||||
| lm0555k12721∗ | 76.2287 | 71.23919 | 0.8010095 | 17.26 | 17.08 | 2184.7009 | 0.957 | 0.037 | 0.055 | 0.0070 | 0.016 | 0.0030 |
| lm0354n8770 | 85.11371 | 67.16454 | 0.904003 | 17.64 | 17.40 | 1185.7298 | 0.913 | 0.03 | 0.127 | 0.0080 | 0.041 | 0.0020 |
| lm0193k19182 | 79.73758 | 68.10716 | 0.905358 | 17.05 | 16.99 | 2213.7821 | 0.958 | 0.01 | 0.047 | 0.0060 | 0.024 | 0.0060 |
| lm0285n10229 | 73.41711 | 67.17722 | 0.911792 | 17.07 | 16.85 | 1532.5773 | 0.973 | 0.015 | 0.02 | 0.0010 | 0.0010 | 0.0020 |
| lm0023n11843 | 83.3321 | 69.62209 | 0.912568 | 17.46 | 17.39 | 1701.4807 | 0.854 | 0.033 | 0.141 | 0.01 | 0.032 | 0.017 |
| lm0123m11836 | 73.49311 | 69.46511 | 0.919332 | 17.18 | 17.29 | 2519.7319 | 0.97 | 0.014 | 0.037 | 0.0050 | 0.013 | 0.0010 |
| lm0122n13303 | 72.46236 | 69.64522 | 0.922604 | 17.17 | 16.94 | 438.8273 | 0.947 | 0.023 | 0.08 | 0.01 | 0.018 | 0.0040 |
| lm0030n21391 | 84.32319 | 69.38179 | 0.922672 | 16.88 | 16.77 | 2304.7686 | 0.883 | 0.043 | 0.153 | 0.018 | 0.046 | 0.0010 |
| lm0226n20767 | 84.60396 | 69.00125 | 0.923941 | 17.65 | 17.45 | 1975.6799 | 0.913 | 0.013 | 0.12 | 0.0050 | 0.056 | 0.0 |
| lm0106n13876 | 76.54384 | 70.34353 | 0.925344 | 17.51 | 17.36 | 498.6062 | 0.892 | 0.033 | 0.133 | 0.02 | 0.043 | 0.0010 |
∗ Star with period re-determined based on our study of the light curve.
The table is published in its entirety as Supporting Information with the electronic version of the article. A portion is shown here for guidance regarding its form and content.
| EROS-2 id | RA(J2000) | DEC(J2000) | Period (day) | Alternative id | Spectral type | Notes | Ref. | |
|---|---|---|---|---|---|---|---|---|
| (deg) | (deg) | EROS-2 | OGLE III | |||||
| lm0290l18998 | 73.88709 | 66.54208 | 3.224805 | N11-107 | B1-2 Early B | SB2 | E06 | |
| lm0290l5213 | 73.95604 | 66.43437 | 1.791025 | N11-119 | B1.5 V | SB2 | E06 | |
| lm0344l12773 | 82.6699 | 67.19545 | 4.952487 | NGC 2004-079 | B2 III | SB1 | E06 | |
| lm034l21656 | 82.78869 | 67.25619 | 4.164156 | NGC 2004-094 | B2.5 III | Binary | E06 | |
| lm0030m4163 | 84.37804 | 69.08817 | 2.333416 | 2.333427 | VFTS 061 | ON8.5III: O9.7: V: | SB2 | W14 |
| lm0030m3468 | 84.42029 | 69.07812 | 1.674098 | 1.674119 | VFTS 112 | Early B Early B | SB2 | E14 |
| lm0030m9744 | 84.46997 | 69.16274 | 1.434738 | 1.434745 | VFTS 189 | B0.7: V | Binary | E14 |
| lm0226n24168 | 84.66296 | 69.02808 | 1.176008 | 1.176008 | VFTS 462 | B0.5-0.7 V | E14 | |
| lm0426m23482 | 75.07795 | 66.06284 | 2.345573 | B1: V | SB2? | … | ||
| lm0294m4825 | 74.53203 | 66.98277 | 2.97779 | 2.9778 | B0-0.5 V | SB? | … | |
| lm0436l19007 | 76.28093 | 66.19386 | 3.301123 | B2 V | … | |||
| lm0020n19615 | 82.67397 | 69.32445 | 4.585353 | 4.585031 | B1.5 Ib | SB1? | … | |
| lm0031l22987 | 85.19681 | 69.34126 | 5.413977 | 5.414011 | B1 III | SB2 | … | |
| HJD 2,450,000 | Err | Err | ||
| (day) | (mag) | (mag) | (mag) | (mag) |
| 303.90001 | 17.276 | 0.041 | ||
| 315.89299 | 17.294 | 0.046 | 17.012 | 0.038 |
| 325.82966 | 17.431 | 0.050 | ||
| 327.82295 | 17.219 | 0.030 | 16.973 | 0.029 |
| 334.87162 | 17.546 | 0.029 | 17.261 | 0.025 |
| 351.82713 | 17.571 | 0.041 | ||
| 361.85427 | 17.606 | 0.063 | 17.448 | 0.047 |
| 367.69923 | 17.168 | 0.041 | ||
| 373.86849 | 17.234 | 0.033 | 16.977 | 0.027 |
| 377.77906 | 17.537 | 0.030 | 17.280 | 0.024 |
The table is published in its entirety as Supporting Information with the electronic version of the article. A portion is shown here for guidance regarding its format and content.
| HJD 2,400,000 | Err | |
|---|---|---|
| (day) | (mag) | (mag) |
| 55140.763187 | 17.406 | 0.055 |
| 55143.762677 | 17.435 | 0.047 |
| 55147.802823 | 17.573 | 0.052 |
| 55152.818276 | 17.607 | 0.065 |
| 55155.725147 | 17.314 | 0.054 |
| 55161.842037 | 17.677 | 0.076 |
| 55164.789981 | 17.333 | 0.042 |
| 55172.764230 | 17.575 | 0.047 |
| 55191.753090 | 17.336 | 0.041 |
| 55209.682223 | 17.412 | 0.049 |
The table is published in its entirety as Supporting Information with the electronic version of the article. A portion is shown here for guidance regarding its form and content.
| EROS-2 id | VMC id | Period | ||
|---|---|---|---|---|
| (day) | (mag) | (mag) | ||
| lm0323n20546 | VMC J052140.98-665227.93 | 0.900708 | 17.116 | 17.057 |
| lm0344m26510 | VMC J053208.76-670741.80 | 0.912445 | 17.260 | 17.161 |
| lm0023n11843 | VMC J053319.72-693719.70 | 0.912568 | 17.314 | 17.143 |
| lm0030n21391 | VMC J053717.63-692254.37 | 0.922672 | 16.754 | 16.644 |
| lm0226n20767 | VMC J053825.02-690004.55 | 0.923941 | 17.497 | 17.560 |
| lm0231k9063 | VMC J054830.84-674223.25 | 0.927999 | 16.992 | 16.883 |
| lm0214n10459 | VMC J053127.29-683413.65 | 0.938971 | 17.652 | 17.635 |
| lm0171m16733∗ | VMC J050444.08-674447.89 | 0.939001 | 15.982 | 15.748 |
| lm0127k12134 | VMC J045304.25-701051.19 | 0.939454 | 16.700 | 17.384 |
| lm0342k18196 | VMC J053134.88-664500.10 | 0.941447 | 17.195 | 16.915 |
∗ Star with period re-determined based on our study of the light curve.
The table is published in its entirety as Supporting Information with the electronic version of the article. A portion is shown here for guidance regarding its format and content.