OFFSETS BETWEEN THE X-RAY AND THE SUNYAEV-ZEL’DOVICH-EFFECT PEAKS IN MERGING GALAXY CLUSTERS AND THEIR COSMOLOGICAL IMPLICATIONS
Abstract
Observations reveal that the peaks of the X-ray map and the Sunyaev-Zel’dovich (SZ) effect map of some galaxy clusters are offset from each other. In this paper, we perform a set of hydrodynamical simulations of mergers of two galaxy clusters to investigate the spatial offset between the maxima of the X-ray and the SZ surface brightness of the merging clusters. We find that significantly large SZ-X-ray offsets () can be produced during the major mergers of galaxy clusters (with mass ). The significantly large offsets are mainly caused by a ‘jump effect’ occurred between the primary and secondary pericentric passages of the two merging clusters, during which the X-ray peak may jump to the densest gas region located near the center of the small cluster, but the SZ peak remains near the center of the large one. Our simulations show that merging systems with higher masses and larger initial relative velocities may result in larger offset sizes and longer offset time durations; and only nearly head-on mergers are likely to produce significantly large offsets. We further investigate the statistical distribution of the SZ-X-ray offset sizes and find that (1) the number distribution of the offset sizes is bimodal with one peak located at low offsets and the other at large offsets 350–450, but the objects with intermediate offsets are scarce; and (2) the probabilities of the clusters in the mass range higher than that have offsets larger than 20, 50, 200, 300, and are 34.0%, 11.1%, 8.0%, 6.5%, and 2.0% respectively at . The probability is sensitive to the underlying pairwise velocity distribution and the merger rate of clusters. We suggest that the SZ-X-ray offsets provide a probe to the cosmic velocity fields on the cluster scale and the cluster merger rate, and future observations on the SZ-X-ray offsets for a large number of clusters may put strong constraints on them.
Our simulation results suggest that the SZ-X-ray offset in the Bullet Cluster, together with the mass ratio of the two merging clusters, requires a relative velocity larger than at an initial separation . The cosmic velocity distribution at the high-velocity end is expected to be crucial in determining whether there exists an incompatibility between the existence of the Bullet Cluster and the prediction of a model.
Subject headings:
cosmic background radiation - cosmology: theory - galaxies: clusters: general - methods: numerical - large-scale structure of universe - X-rays: galaxies: clusters1. Introduction
Clusters of galaxies, the largest virialized systems known in the universe, are formed from mergers of small structures in the hierarchical structure formation and evolution model (see a review in Kravtsov & Borgani, 2012). Collisions of galaxy clusters, with relative velocities up to several hundred or several thousand , are probably the most energetic events since the big bang, which re-distribute both the dark matter (DM) and the baryonic matter in the colliding clusters at an Mpc scale and gas can be shocked and heated. A number of observational features have indicated that some cluster systems are undergoing mergers or are the remnants of recent mergers. For example, the spatial separation of the X-ray emitting gas and the DM clump in the Bullet Cluster is explained by a collision of two clusters, in which gas interacts electromagnetically and moves slower than DM (Clowe et al., 2004, 2006); and the sharp edges shown in some cluster X-ray images are interpreted as either the ‘shock fronts’ or ‘cold fronts’ formed in the intracluster medium (ICM) during cluster collisions (Markevitch et al., 1999, 2000; Markevitch & Vikhlinin, 2007). In addition, recent Sunyaev-Zel’dovich (SZ) cluster surveys, including the South Pole Telescope (SPT), the Atacama Cosmology Telescope (ACT), and the Planck SZ surveys, show that the positions of the maxima of the X-ray surface brightness and the SZ effect differ significantly in some clusters (Andersson et al., 2011; Planck Collaboration et al., 2011c; Menanteau et al., 2012); and also collisions of clusters can lead to the position displacement (Planck Collaboration et al., 2011b). In this paper we study how the spatial displacement of the X-ray and the SZ signals from a merging cluster is affected by the merging process and explore how the statistical distribution of the displacements is connected to the cluster pairwise velocity field and the cluster merger rate. Study of the cluster merging processes and the possible observational signatures would improve our understanding of the baryonic physics involved in cluster collisions, the cosmic velocity fields, and further the structure formation and evolution model and the underlying cosmological model.
Combination of the X-ray properties and the SZ effects of clusters has been used before to constrain the cosmological parameters (Carlstrom et al., 2002) and investigate baryonic physics in clusters of galaxies (e.g., Andersson et al., 2011; Planck Collaboration et al., 2011a, 2012). The X-ray emission of the ICM gas comes mainly from the thermal bremsstrahlung radiation of the hot electrons, and the X-ray luminosity is proportional to , where is the number density of electrons and is the electron temperature. The SZ effect is the result of energy boost of low-energy cosmic microwave background photons due to the inverse Compton scattering off high-energy electrons in the ICM. Depending on whether the high energy of the electrons is due to their temperature (thermal) or bulk motion (kinematic), the SZ effect can be divided into the thermal effect and the kinematic effect. The thermal SZ effect has been detected in many clusters, and its magnitude is proportional to the integral of the electron pressure along the line of sight () and independent of redshift. The kinematic effect is expected to be a potential probe to the motion of clusters, yet it is much weaker than the thermal effect in high-mass clusters. As the thermal SZ effect and the X-ray brightness of a cluster have a different dependence on gas temperature and density distribution, and the location of the maximum X-ray brightness is likely to be offset from the location of the maximum of the SZ effect because of the re-distribution of the gas in the cluster merging process.
In this paper we use numerical simulations to study the merging processes of individual clusters and then obtain the distribution maps of the X-ray brightness and the SZ effect in the merging clusters. Many simulations on mergers of two individual clusters have been performed previously to produce the observed configuration/morphology of a specific unrelaxed galaxy cluster (e.g., Springel & Farrar, 2007; Mastropietro & Burkert, 2008; ZuHone et al., 2009) or investigate various physical effects and features caused by the merging processes (see e.g., Roettiger et al., 1997; Ritchie & Thomas, 2002; Poole et al., 2006; ZuHone, 2011). Molnar et al. (2012) simulated mergers of two clusters to particularly reconstruct the morphology of the galaxy cluster CL 0152-1357 and the offset between its SZ effect and X-ray peaks; and in their study, only the high relative velocity () case of two clusters was explored, which is extremely rare in the universe. In our study, we explore the processes in a larger range of the parameter space (e.g., in the initial kinematic distribution of colliding clusters, their total masses and mass ratios), so that the distribution of the offsets can be investigated statistically. We find that the distribution of the SZ-X-ray offset is mainly affected by the merger rate of clusters and the pairwise velocity distribution of those merging clusters. Therefore, observational estimates of the SZ-X-ray offset distribution by SZ and X-ray surveys can be used to put constraints on both the merger rate of clusters and the pairwise velocity distribution of clusters, and further on the CDM model at the cluster scale.
This paper is organized as follows. In Section 2, we describe our numerical methods of the cluster mergers and the initial conditions of the simulations. In Section 3, we present the general results of the simulations and discuss the factors to affect the offsets between the SZ effect and the X-ray peaks. In Section 4, we estimate the probability of the large offsets and compare it with observations. Finally, conclusions are summarized in Section 5.
Throughout the paper, we use a flat cosmology model with , , , with .
2. Method
We perform numerical simulations of the mergers of two galaxy clusters. In this work, each of the clusters is simplified as a halo with a mixture of only DM and gas. The DM is approximated as collisionless, undergoing only gravity; and the gaseous component is collisional, adiabatic, undergoing both gravity and fluid pressure. Both the particle-based Lagrangian [such as smoothed particle hydrodynamics (SPH)] method (Ritchie & Thomas, 2002; Poole et al., 2006) and the mesh-based Eulerian [such as adaptive mesh refinement (AMR)] method (ZuHone, 2011; Molnar et al., 2012) have been used to carry out such simulations. Mitchell et al. (2009) investigated the discrepancy occurred in the merger simulations between these two different methods, by using GADGET-2 (SPH; Springel et al. 2001; Springel 2005) and FLASH (AMR) codes. They showed that SPH has the advantages in computational speed, effective resolution, and Galilean invariance, but is not good at the treatment of eddies and fluid instabilities, while AMR is on the contrary. Considering the purpose of our work, we choose the SPH code to do the simulations for the following reasons: (1) we need to explore a large parameter space of the merging processes, which demands an efficient calculation speed; (2) we focus on the peak positions of the X-ray and the SZ signals, and the disadvantages of the SPH code do not have significant effects on these; and (3) by applying both the AMR code and the SPH code to simulate the mergers for some cases in Section 3.3, and then comparing both the simulation results concerned in this study, we find that different numerical codes do not lead to significant changes.
We have made some simplifications in simulating the physical processes occurred in the clusters. (1) We do not include radiative cooling and various heating mechanisms in our simulations. A pure cooling model has to face the overcooling problem, which is inconsistent with observations (Suginohara & Ostriker, 1998); and thus an effective heating form is necessitated to counterbalance the cooling effect, such as AGN feedback (Sijacki et al., 2007). However, the physics of those mechanisms is not well understood yet. As argued in ZuHone (2011), the simplified model for gas physics can serve as a baseline to characterize the effect that we are interested in this work. In addition, Mastropietro & Burkert (2008) showed little evidence that the radiative cooling can change the positions of X-ray peaks, though the surface brightness is obviously modified. (2) The magnetic field is omitted in our simulations, and we assume that it has little influence on the SZ-X-ray offsets. In our work SZ-X-ray offset is formed from the breaking of hydrostatic equilibrium of the ICM gas during cluster energetic collisions. The magnetic energy is usually smaller than of the mechanical energy involved in cluster mergers (Carilli & Taylor, 2002), and on average the magnetic pressure in clusters is much smaller than the thermal pressure (Laganá et al., 2010). Moreover, the tangling scale of the magnetic field is about (Carilli & Taylor, 2002), which is an order of magnitude smaller than the typical offsets discussed in this work. Nevertheless, the quantitative analysis on the effects after including the ignored physical processes here needs to be investigated in the future.
2.1. Initial distributions of the dark matter and the gaseous halo of a cluster
We assume a spherical symmetric density profile to model the initial mass distributions of the DM and the gas in a cluster. The Navarro-Frenk-White (NFW) profile (Navarro et al., 1997) is used for the DM mass density distribution within the virial radius ,
| (1) |
where and are the scale density and the scale radius, respectively, and is the concentration parameter. The is calculated from the spherical collapse model (Bryan & Norman, 1998), and is given by a fitting formula obtained from N-body simulations (Duffy et al. 2008; see also Bullock et al. 2001; Wechsler et al. 2002; Zhao et al. 2003; Macciò et al. 2007). The effect of the evolution of and with redshift will be discussed in Section 4.2. The DM density distribution outside the virial radius is given by
| (2) | |||||
where we follow Kazantzidis et al. (2004) and implement an exponential cutoff that suppresses the profile on a truncation scale to avoid a divergent total mass and the parameter is set by keeping the first derivative of the DM density profiles continuous at . The parameter is set so that the total mass obtained by integrating Equations (1) and (2) over the space is the total DM mass of the cluster. Given the mass density distribution, the distribution function of the DM in the six dimensional space is assumed to be ergodic and solved via the Eddington’s formula (eq. 4.46 in Binney & Tremaine 2008). In both the SPH and the AMR simulations, DM is described by Lagrangian particles. To keep the stability of the DM distribution within the virial radius over cosmological relevant timescales, the truncation scale is set to , as done in Zemp et al. (2008), and we have tested that a single cluster with the truncated model is stable within the Hubble time in our simulations.
We choose the Burkert profile (Burkert, 1995) to represent the initial gas density profile as follows,
| (3) |
as done in ZuHone et al. (2009), where is the core radius and the normalization density is set so that the baryonic mass fraction within is consistent with the cosmological average value . For the region outside the virial radius, we assume that the gas density profile traces the DM density profile as follows,
| (4) |
The specific internal energy of the gas at radius is determined by
| (5) |
where the gas is assumed to be in hydrostatic equilibrium and ideal monatomic gas state with mean molecular weight per ion , is the ratio of the heat capacity at constant pressure to that at constant volume, and is the total mass within radius . The temperature distribution of the gas can be obtained from its internal energy distribution.
We also test different gas density distribution models in our work, e.g., the -model (Cavaliere & Fusco-Femiano, 1978) or a gas distribution tracing the DM density profile at all radii. We find that the different gas models do not affect our results significantly, as we focus on the positions of the maxima of projected X-ray and SZ maps of merging systems.
2.2. Simulation settings
In our simulations, the centers of the two clusters with masses and () are initially separated by a distance set to twice the sum of their virial radii, with initial relative velocity and impact parameter . The center of mass of the two clusters is initially put at rest at the origin of the coordinate system in the simulations. The initial position of each cluster center is put at the plane with coordinate , and their coordinates are and , respectively. The initial relative velocity is along the -axis, which are and for the two clusters, respectively.
We explore a large range of the parameter space of the initial conditions. We perform a series of simulations with . The mass ratio () is generally set to be 1, 2, 3, or 5. For some special cases, the values of the mass ratio are set more intensively from 1 to 5. Different from previous work in which a fixed initial relative velocity (1.1 times circular velocity at the virial velocity of the larger cluster) is adopted (McCarthy et al., 2007; ZuHone, 2011), our simulations are done for a large range of from to and show that the SZ-X-ray offset has a strong dependence on the relative velocities (see Section 3.1.1 below). The impact parameter spans from 0 to , as head-on or nearly head-on mergers are relevant here (see Section 3.1.2 below).
We use the GADGET-2, an efficient parallel TreeSPH code, to carry out our simulations (Springel et al., 2001). The mass of each gas particle is , and the mass of each dark matter particle is . The gravitational softening length is set to , for which other choices (e.g., 1.5 or ) are also tested and our main results are not affected.
As mentioned above, we also use the FLASH, a mesh-based Eulerian code, to test whether the discrepancy between Eulerian and Lagrangian methods affects our results significantly (Fryxell et al., 2000). The FLASH uses adaptive mesh refinement (AMR), and solves the equations of hydrodynamics by Piecewise-Parabolic Method (PPM) of Colella & Woodward (1984). The gravitational potential is computed by the multigrid solver (Ricker, 2008). We simulate the cases with for . For the box size of of all the FLASH mergers, the finest resolution achieved in our simulations is .
2.3. Projection analysis: the X-ray and the SZ signals of merging clusters
Given any time of the merging processes, we can obtain the two-dimensional maps of the mass surface density, the X-ray surface brightness, and the SZ emission of the simulated merging clusters by the following equations.
-
•
The mass surface density is given by an integral of the mass density along the line of sight (LOS), i.e.,
(6) -
•
The X-ray surface brightness is obtained by using an approximate expression for the relativistic X-ray thermal bremsstrahlung as follows (see eq. 5.25 in Rybicki & Lightman 1979), considering that the gas temperatures of some regions heated by shocks can be up to ,
where is the frequency average of the velocity averaged Gaunt factor (Rephaeli & Yankovitch, 1997).
-
•
The SZ surface brightness is given by
(8) where is the Thomson cross section, is the electron mass, is the speed of light, , is the Boltzmann constant, and are the factors given by eqs. 2.26–2.30 in Itoh et al. (1998).
In practice, we obtain all the above quantities at a given position calculated from the SPH method by smoothing neighbor particles output from each snapshot of the simulations, where is a neighbor particle number typically used for smoothing.
The values and the spatial positions at the peaks of the projected mass surface density, X-ray and SZ images can then be obtained. Note that all the maps have been smoothed by a Gaussian distribution function with dispersion . We also try other values of , and find that the variations of the positions of the peaks are smaller than . The SZ peak position is not sensitive to the value even when . A similar result is reported in Molnar et al. (2012) although they use a lower SZ resolution. Thus, not only are the obtained peak positions not affected by the smoothing, but also they can be straightforwardly compared with the current SZ observations, though the current observational resolutions are at the sub-arcminute level.
Finally, we clarify the definition of the “SZ-X-ray offset” to be obtained from our simulations, which is not exactly the same as that obtained from observations in the following two points. (1) The offset that we obtain from our simulations is the distance between the positions of the maxima of the whole X-ray and SZ surface brightness maps, which covers a sufficiently large region. However, the offsets obtained from observations are sometimes the displacements between the X-ray and SZ peaks located in a small local region, hence they can be smaller than the offsets obtained in this work. (2) The centroids of the galaxy clusters obtained in the X-ray survey are always obtained by computing the mean emission-weighted positions after removing the extended secondary X-ray maxima, instead of finding the maximum in the surface brightness maps as done here (e.g., Vikhlinin et al., 2009; Andersson et al., 2011).
3. Simulation Results
In this section, we present the following aspects of our simulation results. (1) We show the projected X-ray and SZ surface brightness maps obtained from Equations (LABEL:eq:x-ray) and (8), viewed along the -axis unless otherwise stated. We qualitatively describe the formation and evolution of the SZ-X-ray offsets during the merging process and discuss the impacts of different relative velocities, impact parameters, primary masses, and mass ratios on the maximum and time duration of the offset. (2) We quantitatively measure the time duration of the SZ-X-ray offset, which is used for estimating the probability of the offsets expected in observations in Section 4. (3) We also compare the merging processes simulated by the SPH and the AMR methods. We demonstrate the robustness of our results obtained by only using the SPH method.
3.1. Mapping the X-ray and the SZ emissions from merging clusters
Generally, the merging process of two clusters involves the five distinct stages (Poole et al., 2006): pre-interaction stage, primary core-core interaction, apocentric passage, secondary core accretion, and relaxation (see an example illustrated in Fig. 1 below), if the initial relative velocity is not high enough to detach the two clusters from each other at a later time. As mentioned above, the DM and the gas have different physical behavior during the mergers. The DM is collisionless so that the DM halos of the two clusters can go through each other, undergoing only gravity; while gas experiences gas pressure and shocks can be created during collisions of the gas halos. The different behavior can be revealed from the images of the mass surface density, and the X-ray and the SZ emissions of the merging clusters, as DM dominates the entire mass of the merging system and the X-ray and the SZ emissions are merely sensitive to the baryon distribution.
3.1.1 Dependence on initial relative velocities
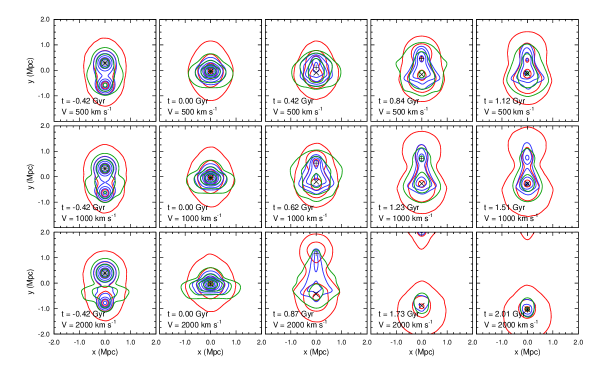

Figure 1(a) shows a time sequence of the snapshots of the mass surface density (red contours), the X-ray surface brightness (blue contours), and the SZ emission (green contours) of a head-on merger of two clusters (, ) with different initial relative velocities. For simplicity, we show the results of the first three stages (the entire five evolution stages can be viewed in Figure 1(b)). The first column shows a snapshot in the pre-interaction stage for each merging system. The second column represents the time of the first pericentric passage of the two clusters. For simplicity, we set the evolution time at the first pericentric passage. As seen from the second column, the blue and the green contours are flattened, i.e., gas is squeezed outwards in the direction normal to the collision axis; and the green contours are relatively more flattened, as the outer region of the merging cluster heated by shocks contributes more to the SZ surface brightness than to the X-ray surface brightness. The SZ and the X-ray peaks (labeled by ‘’ and ‘’ in the figure) start to separate after the first pericentric passage, when the gas at the inner region of the merging clusters is strongly disturbed. Since the central mass density of the large cluster is lower than that of the small cluster, the larger cluster core is penetrated by the small one, and the offset is gradually stretched (see the third column). The fourth column presents the snapshots with the largest peak offsets occurred during the merging processes. The offset returns to a small value or disappears at a later time as the surrounding gas gradually falls into the gravitational potential of the larger cluster (see the fifth column). After the secondary core-core interaction (though not shown in Figure 1(a); cf., the primary core-core interaction in the second column), gas is usually partially relaxed. The SZ-X-ray offsets are then not larger than except for some special massive systems (e.g., bottom panel in Figure 5(b) below).
By comparing the first two rows in Figure 1(a), one can see that there is no obvious qualitative difference between the evolutionary behavior of the offset for the case with relative velocity and that with , except that the largest offset produced during the merging process is larger for the case with a higher relative velocity. For the case with (the third row of Figure 1(a)), however, the result is distinctly different as the small cluster escapes away and cannot get back to collide with the large cluster again after its first pericentric passage because of the high relative velocity. The center of the small cluster becomes the maximum of the X-ray brightness map, when it passes through the larger one. The offset can be up to after their interaction.

Evolution of the SZ-X-ray offsets for different relative velocities is shown in Figure 1(b). The solid lines give the SZ-X-ray offset as a function of time. The dashed lines represent the evolution of the distance between the mass density centers of the two clusters; and a zero distance is used if the two objects cannot be identified as they overlap or merge together. The merging processes are divided into the five different stages as illustrated in the top panel. Initially, the two clusters are in the pre-interaction stage, and then the primary core-core interaction starts around the time of the first pericentric passage at . Before , it is the pre-interaction stage. The time of the first apocentric passage is marked as . After , the second core accretion stage starts; and marks the secondary pericentric passage and the end of the second core accretion stage. As the small cluster in the bound orbit is dragged back and forth during the gradual relaxation process, the apocentric distances damp with time. The whole system appears visually relaxed around the time as marked in the top panel.
As seen from Figure 1(b), the offset is initially zero. A small jump appears before the first pericentric passage, and it then decreases and disappears as the two clusters get closer. The appearance of the small jump in the pre-interaction stage can be understood as follows: as the two clusters approach each other, their outer layers start to be compressed and heated, during which the position of the maximum SZ signal is affected, but the peak of the X-ray remains located at the center of the larger cluster. After the first pericentric passage, the collision of the two clusters destroys the hydrostatic equilibrium and spherical symmetry of the gas halos. As shown in Figure 1(b), a significantly large SZ-X-ray offset always occurs between the primary and secondary pericentric passages. The occurrence of the large offset can be understood as follows: the gas core of the larger cluster is disrupted, and the X-ray peak jumps to the densest region around the center of the small cluster. However, the SZ peak does not jump (see the peak positions shown in the fourth column of Fig. 1(a)), as the temperature at the center of the small cluster is relatively low (see the top right panel in Fig. 4 below), which strongly reduces the SZ surface brightness whose emissivity is proportional to the temperature. The SZ-X-ray offset is therefore nearly boosted to the mass density displacement between the two clusters (hereafter we refer to it as the ‘jump effect’). As seen from the figure, the maximum offset is positively correlated with the initial relative velocity of the two clusters. The X-ray peaks drop back to the center of the larger cluster mostly after , when the gas falls back to the trough of the gravitational potential well. The end of the large SZ-X-ray offset is indicated by the sharp discontinuity in the solid line. Our results suggest that the jump effect should be the dominant reason to lead to the large offset. Our calculations show that adopting different image smoothing scales may result in different time durations of the jump effect if . The duration of the X-ray peaks locating in the center of the small cluster is shorter if is larger, as more substructures in the X-ray map is smoothed. For example, for the offset larger than , the duration obtained with is only half of the value obtained with .

As mentioned above, the evolution of the offset shows different behavior for low (e.g., ) and high (e.g., ) relative velocity mergers. Here we define a critical velocity to distinguish these bound and unbound collision cases, i.e., the two clusters will merge and relax within if . The merger is referred to as the “merger mode” if , otherwise as the “flyby mode”. We perform a series of low-resolution simulations (with fixed DM and gas particle numbers, 40,000 and 10,000 respectively, for computing efficiency) to identify as a function of . The result is shown in Figure 2, and the uncertainty in the obtained is . We approximate the relation between the and the initial condition parameters by the following fitting form:
| (9) |
where the best-fit parameters are , , , and . The critical velocity is strongly related with the primary cluster mass and the mass ratio, but not the impact parameter. The fitting form and the best-fit power-law factors are roughly consistent with the expectation from the escape velocity criterion in a simple two-body gravitational interacting system, that is, , and thus , where is a factor.
3.1.2 Dependence on impact parameters
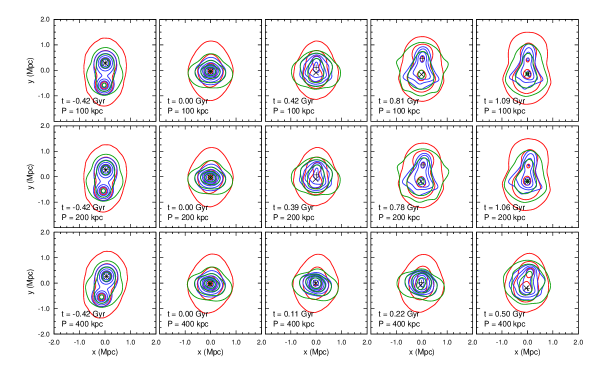
Figure 3(a) shows the snapshots of the simulation results for different impact parameters with . For the low initial relative velocities, the large offsets () occur in both head-on and nearly head-on impacts (i.e., ). They can reach up to 600–700 (see the top and middle panels in Fig. 3(b)). A larger impact parameter results in a smaller offset, which implies that the size of the SZ-X-ray displacement is strongly related with the intensity of the primary core-core interaction. Molnar et al. (2012) studied the high-initial relative velocity case with and find that significant displacements () between the SZ and X-ray peaks can be produced for non-zero impact parameters (about 100–250 kpc) and they decrease with increasing impact parameters; however, the displacement is insignificant for zero impact parameter. We also perform simulations with similar to those done in Molnar et al. (2012). For the non-zero impact parameter cases, we find that the patterns of the mass surface density, the X-ray, and the SZ emission are all very similar with those shown in Molnar et al. (2012); for the head-on merger, however, a displacement up to can also be produced, while the distance between the mass centers of the two clusters is .
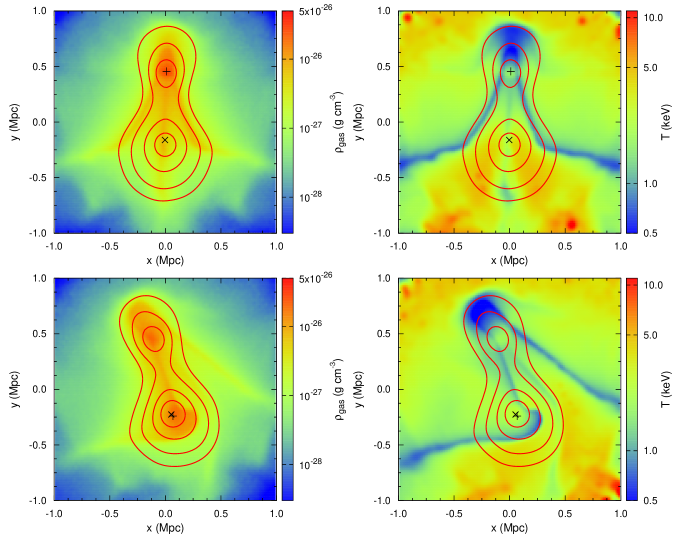
Figure 3(b) shows the evolution of the SZ-X-ray offsets for different impact parameters. As seen from the bottom panel of the figure, there is no significant SZ-X-ray offset for a large impact parameter . This can be understood through the density and temperature maps of the colliding clusters shown in Figure 4. Figure 4 compares the density and temperature slices of the gas at coordinate plane between the head-on () and the off-axis () mergers. For the head-on merger shown in the top panels, as discussed above, the core of the large cluster is disrupted at the collision, and the denser region is near the center of the small cluster; however, the temperature at the center of the small cluster and its surrounding region is relatively low. But for the off-axis merger with a large impact parameter shown in the bottom panels, the gas cores of the two clusters sideswipe each other at the primary collision, and the center of the large cluster remains dense; thus the X-ray and SZ peaks are both near the center of the larger cluster. It is worthy to note that though shocks can heat the gas at shock fronts to a relatively high temperature (e.g., a few ten keV), the X-ray and the SZ peaks still locate near the centers of the clusters, as the observed X-ray and the SZ emission is integrated along the line of sight (see Eqs. LABEL:eq:x-ray and 8).
Our simulation results demonstrate that only the head-on or nearly head-on mergers are possible to produce offsets larger than , e.g., for the simulation with or for . In addition, a smaller impact parameter induces a longer time duration of the non-zero offset.
3.1.3 Dependence on masses
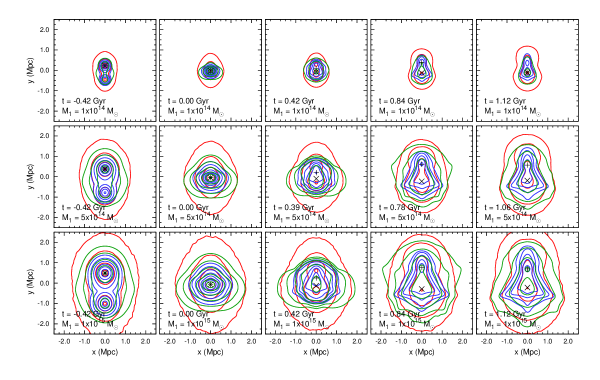
Figure 5(a) shows the snapshots of the simulations for different masses of the primary cluster, , , and , respectively. Compared to the low-mass case shown in the top row, the deformation of the gas distribution, especially viewed from the SZ contours, is much stronger in the more massive merging processes.
Figure 5(b) presents the dependence of the SZ-X-ray offset evolution on . As seen from the figure, a significantly large SZ-X-ray offset can occur in the whole mass range of the galaxy clusters. For the more massive systems, the maximum of the spatial separation between the SZ and the X-ray peaks is larger, and the time duration of a non-zero offset is longer. Our simulation results show that the maxima of the SZ-X-ray offsets for different masses (denoted by ) are approximately as large as the first apocentric distances and so does it for different velocities (). The fitting form to the dependence of on the initial parameters can be obtained first through the following analysis and then from our numerical simulation results. If approximating dynamics of the merging system by the dynamics of a two-body system, can be approximately obtained through the energy conservation law , where is the gravitational constant. By setting and considering the scaling relation between the virial radius and the mass of galaxy clusters, we have and , where is a factor. Thus we fit our numerical simulation results of in the following form,
| (10) | |||||
and obtain the best-fit parameters , , . Equation (10) is used in the integration of Equation (15) to obtain the offset rate. Here we do not consider the dependence of on impact parameters because (1) is not sensitive to the impact parameter (e.g., in Fig. 3(b)) unless is too large to suppress the large offset, and (2) the cases with large impact parameters do not contribute much to the integration of Equation (15) below, as their time durations of the non-zero offsets are shorter (or the term in Eq. 15 is zero when is too large).
As seen from the middle and the bottom panels of Figure 5(b), for the mergers of high-mass clusters (e.g., , ), a significantly large offset can still appear after the third pericentric passage (where the SZ peak deviates from the center of the large cluster due to an offset between the positions of the maxima of the gas density and the temperature distributions). However, when doing the statistical analysis in Section 4 below, we consider the offsets () triggered merely between the primary and secondary pericentric passages for the following reasons: (1) massive mergers with cluster masses larger than are rare events in the universe, which approximately occupy among all major mergers of galaxy clusters; and (2) the time duration of the offset after the third pericentric passage is nearly five times smaller than that of the offset triggered by the first core-core collision.

3.1.4 Dependence on mass ratios
The mass ratio is also an important parameter to affect the values of the offsets. According to our simulations, if the initial relative velocity is below for , we find that only when (i.e., major mergers) can the offsets be larger than . If the mass ratio is larger, the strength of the collision is weaker and has less power to disturb the large cluster, and thus the offset becomes less significant. For producing the offset larger than with higher , more massive merging systems (e.g., ) or higher relative velocities are required. Note that when the mass ratio approaches unity, the offset also turns to be insignificant, as the merging configuration is symmetric.
The dependence of the SZ-X-ray offset on the mass ratio provides a complementary method to constrain the kinematics of an individual merging cluster (see Section 5 below). For example, the Bullet Cluster is a system with two merging clusters with quite different masses; and by doing the simulations with , we find that only when can the maximum of the offset be larger than .
3.2. Duration of the SZ-X-ray offset and the offset ratio
The time duration of the SZ-X-ray offset is important in this work, as it is directly associated with the probability of the offset appearing in the observation. As studied in Section 3.1, the duration has a strong relation with the initial parameters and . To quantitatively describe the duration, we define the “offset ratio” by
| (11) |
where is the time duration between the primary and the secondary pericentric passages. is the time duration of the SZ-X-ray offset larger than (e.g., see and marked in the middle panel of Figure 1(b) where )111Hereafter we use the unit of for for comparison with the observation (see Section 4)..
The time duration obtained from our simulations can be fit as a function of the pairwise velocity, cluster mass, and redshift by the following form,
| (12) | |||||
where , , . The relaxation timescale of the merging clusters in our simulations (i.e., ) is about several Gyr, which is typically times longer than (e.g., see Figs 1(b), 3(b), and 5(b)). The time duration of the mergers listed in Poole et al. (2006) also gives a similar result. In this work, we assume with the factor . We will present our detailed studies of the relaxation timescale in a separate paper.
In Figure 6, we present the offset ratio measured from mergers with different initial conditions. We select , which fall into the typical offset range in observations. We only consider the “merger mode” whose is shorter than in our estimation for its dominant contribution to the large offset in the observation (see Section 4.1.3 below). Except for the massive mergers (see Section 3.1.3), the offsets larger than appear only between the primary and secondary collisions, consequently we have .
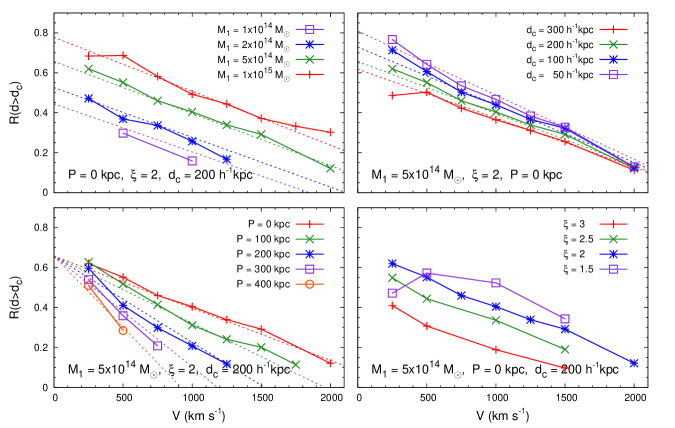
The top left panel of Figure 6 shows the offset ratio as a function of the relative velocity with different for , which indicates that mergers of more massive clusters produce higher offset ratios. For each mass, the ratios reveal an anti-correlation with the relative velocity, and the correlation slopes for different masses are close. The top right panel presents the dependence of the ratio on for , where the duration of the larger offset is shorter. However, the difference is not significant at the high-velocity end. The bottom left panel presents the dependence on different impact parameters for . As seen from the panel, the slopes of the curves decrease as the impact parameters increase, and consequently the effective velocity range for a positive offset ratio decreases strongly, e.g., for . The bottom right panel shows the impact of the different mass ratios on the offset ratio for and . We find that if , the amplitudes of the offset ratios are close; while if is larger than 3 or approaches to 1, the offset ratio decreases significantly.
According to the dependence behavior of the offset ratio on the initial conditions shown in Figure 6, we find that the following functional form fits the data well,
| (13) | |||||
where the offset ratio is linearly correlated with the initial relative velocity. The mass-scaled terms and are included to indicate the dependence on and the impact parameter. We fit simultaneously to all of the simulation results but fix . Considering the limited simulation test explored in this study, the mass ratio is not taken as an argument in the above fitting formula. The possible effects caused by different will be discussed at the end of Section 4.2 below. The best-fit parameters () are given in Table 1. Note that Equation (13) is merely suitable for and . And the ratio is constrained to be non-negative. Therefore, the effective velocity range for the positive offset ratio is for , and the upper limit of the effective velocity range is a few tens percents larger than the critical velocity given in Equation (3.1.1). However, when , the effective velocity could be much smaller than .
We investigate those cases with offsets smaller than below, separately, which is necessary especially when we estimate the observational expectation of the SZ-X-ray offset distribution over all ranges of the offset size in Section 4.4. There are at least the following several reasons to separately investigate the large offsets (i.e., ) and the small ones (i.e., ), respectively. (1) As discussed above, the two ranges of the offsets are caused by different reasons. The large offsets are strongly affected by the ‘jump effect’, mostly appearing between the primary and secondary pericentric passages. On the contrary, the small offsets can be viewed during the whole merging processes. (2) As the uncertainty in our estimation is about a few kpc, the time duration of the offsets smaller than has a relatively larger error. (3) Furthermore, the statistics of the offsets smaller than performs relatively irregular behavior, and is more complex to be described. Note that the criterion to separate the large and the small offsets is at or a few dozens of kpc, which is reasonable because the core radius of the initial gas distribution is . While the size of the SZ-X-ray offset is comparable with or larger than the core radius, the SZ and the X-ray peaks actually locate near the centers of the big and the small clusters, respectively. Only the disturbed core region of the big cluster itself could not generate such a large offset.
We count the ratio of the small offsets by using our simulations and setting , respectively. We find that the offset ratios also show a linear correlation with the relative velocity as those of , though the correlation has a larger scatter than that shown in Figure 6. In addition, for , the offset ratios are not strongly related with the impact parameter, and thus we use a mild dependence on the impact parameter in the fitting function of given by
| (14) |
where the best-fit parameters () are given in Table 1.
3.3. Comparison between the SPH and AMR simulations
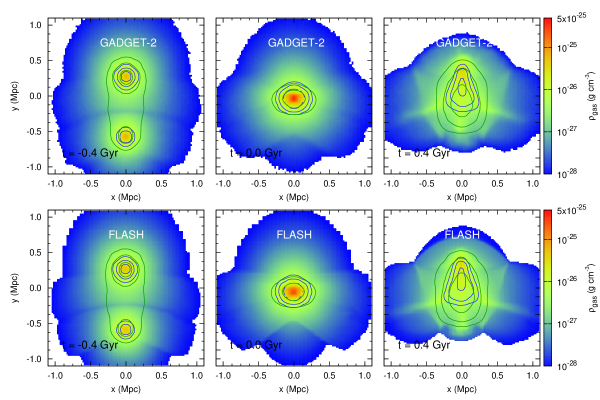
In the last part of Section 3, we show an example of simulating the merging process of two clusters by using both the SPH and the AMR methods. The parameter settings and the results of the simulation are shown in Figure 7. Figure 7 shows the slices of the simulated gas mass density and temperature distributions at the merger plane, i.e., and , obtained at different merging time. The top and the bottom panels represent the results obtained by the GADGET-2 and FLASH codes, respectively. The overlaid contours show the projected X-ray (blue) and SZ (green) surface brightness maps. As seen from the figure, the density and the temperature distributions of the merging structure obtained from the two codes are consistent in general, except for the two main different points below. (1) The discontinuity produced by shocks are sharper in the FLASH merger, which reveals the advantage of the AMR method in capturing sharp gas features. (2) In the inner region of the system, the density of the gas core produced by the SPH code tends to be higher (by ). This minor discrepancy is suggested to be due to the suppression of the turbulence by the SPH method, as reported in Mitchell et al. (2009). These deviations in the strength of the surface brightness, however, affect the positions of the X-ray and SZ peaks little, which guarantee the robustness of our work results obtained by only using the SPH code.
4. Probability of the SZ-X-ray Offset
By exploring the parameter space of the initial conditions in Section 3, we find that the cluster mergers with and may form the SZ-X-ray offset larger than . The parameter space almost covers the whole mass range of the galaxy clusters which experienced major mergers. In this section, we investigate the probability of a significant SZ-X-ray offset occurring in observations.
4.1. Model of the offset rate
The number of the mergers with observational offset 222To distinguish from the SZ-X-ray offset viewed along the -axis, we use to represent the offset viewed along from any one randomly given direction. per unit redshift (or per unit cosmic time after multiplying by ) per unit comoving volume at redshift , which is referred to as the offset rate hereafter, over a given range of mass (, is the total mass of the merging system), mass ratio , impact parameter , and initial relative velocity can be given by:
| (15) | |||||
where and are the initial distribution functions of the impact parameters and the relative velocities of merging cluster pairs with and , respectively. In Equation (15), is defined as the specific probability of a merging system with a given initial condition () showing the observed offset in one observational direction, which can be obtained through the ratio of the time duration of the observed offset () over the total merging time (from the primary pericentric passage to the complete relaxation; cf., Eq. 16 below), and is the average specific probability of the observed SZ-X-ray offset over all random observational directions. The is the Heaviside step function, where is the maximum of the SZ-X-ray offset during the merger (i.e., Eq. 10). The merger rate is defined so that represents the comoving number density of galaxy cluster mergers completed at redshift , with primary mass in the range and mass ratio in the range . The is obtained by the cosmic time difference for large offsets (e.g., ) and for small offsets (e.g., ), where the large offsets occur mainly at the primary core-core interaction stage as mentioned in Section 3.1.3.
Below we present the detailed forms of the functions , , , and in Sections 4.1.1–4.1.4, respectively.
4.1.1 The average specific probability of the offset
We define the average specific probability of offset in Equation (15) by
| (16) |
where is the average of the time duration of the observed offsets larger than over all possible observational directions. To connect the average duration and the duration observed along the -axis that was discussed in Section 3, we introduce the following projection factor
| (17) |
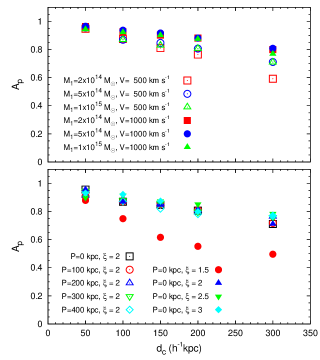
In principle, the projection factor should depend on the initial parameters and . We investigate the dependence by using the Monte-Carlo method and randomly selecting the observational directions for the given snapshots, and the result is shown in Figure 8.

As seen from Figure 8, the values of the points at a given are quite close. The only outliers are the red points in the lower panel, which are for the case with , , and . The factors for the mergers with is around smaller than that for the corresponding cases with . That is, the projection factor does not significantly depend on the cluster mass, the mass ratio, the impact parameter, and the initial relative velocity. Thus, we assume a universal factor , which is only a function of . For simplicity, we set to be the mean value of the data shown in the top panel of Figure 8 at each . For the offsets smaller than , we also find a similar result that the projection factor can be assumed to be only a function of . The results of are listed in Table 2.
| 0.92 | 0.79 | 0.79 | 0.86 | ||
| 0.95 | 0.90 | 0.87 | 0.84 | 0.73 |
4.1.2 The merger rate
We approximate the merger rate of cluster pairs by using the following universal fitting form of the halo merger rate obtained in Fakhouri et al. (2010, see also ):
| (19) | |||||
where , , , , , , . Note that the mass ratio defined in this work is the reciprocal of that in Fakhouri et al. (2010). For the dark matter mass function , we use the universal form derived from the N-body simulations (Tinker et al. 2008; see also Sheth & Tormen 1999; Jenkins et al. 2001),
| (20) |
where is the present mean mass density of the universe, is the square root of the variance of mass, and gives the fraction of the mass associated with halos in a unit range of (see eq. 3 in Tinker et al. 2008).
4.1.3 Initial relative velocity distribution
We approximate the probability distribution function of the pairwise velocity obtained from cosmological simulations with halo masses above (Thompson & Nagamine, 2012) as the distribution of initial relative velocity in this work. The box size employed in the simulation of Thompson & Nagamine (2012) guarantees our requirement for the statistic analysis of massive major merging systems. The best-fit of a skewed normal distribution to the simulation results obtained in Thompson & Nagamine (2012) is
| (21) | |||||
where , , and the best fit parameters are . The peak of this distribution locates at 500–600 . However, the velocity distribution could depend on cluster masses, which was not considered in Thompson & Nagamine (2012). Some other works in the literature also discussed the relative motion of cluster pairs. For example, Dolag & Sunyaev (2013) presented the dependence of the relative motions of cluster pairs on their distance, where the median relative velocity can be described by a simple functional form of (here represents the separation of the two clusters and is measured in units of the sum of their virial radii). In our simulations, the initial separation of two merging clusters is set to , and thus correspondingly the median relative velocity is if adopting the results from Dolag & Sunyaev (2013), which is about larger than the median value of Equation (21). In addition, Wetzel (2011) suggested that the average value of the infalling velocities of the satellite halos shown in cosmological simulations is approximately the circular velocity of the primary halo at the virial radius (), which is smaller than that adopted in our study.
Based on the relative velocity distribution obtained from Thompson & Nagamine (2012), we estimate the probability of the flyby mode defined in Section 3.1.1. It is smaller than of the whole merging events, which is the reason why we only use the merger rate in Equation (15) but ignore the contribution from the rare flyby mode. We ignore the redshift evolution of the pairwise velocity distribution for clusters, which seems insignificant at redshift 0–0.3 (Thompson & Nagamine, 2012; Dolag & Sunyaev, 2013; Watson et al., 2014).
4.1.4 The impact parameter distribution
The distribution of impact parameters for major mergers of massive clusters was investigated in the literature, and it is not easy to give a universal quantitative description for this distribution. We list some works below. Sarazin (2001) suggested that most mergers are expected to involve fairly small impact parameters comparable to the sizes of the gas cores in clusters, which may be also biased to a lower value if most mergers occur along large-scale structure filaments. Wetzel (2011) (see also Vitvitska et al. 2002; Benson 2005) presented the distributions of the radial () and the tangential () velocities of DM substructures at the time of crossing within the virial radius of a larger host halo, where the peak of the distribution is centered on and and the impact parameters are implied to be a few hundred kpc. However, Vitvitska et al. (2002) reported that the tangential velocity decreases with the increase of the secondary mass, and major mergers are significantly more radial than minor mergers. In addition, Benson (2005) found the evidence for a mass dependence of the distributions of orbital parameters, i.e., the orbits of more massive merging systems are more radial and less tangential, though their small sample size limits an accurate determination of this dependence. According to the argument in Poole et al. (2006), the statistics including the secondary or tertiary encounters with the primary one tends to overestimate the tangential velocity, and the average impact parameter is likely to be smaller than what implies in Benson (2005). Khochfar & Burkert (2006) also reported a distribution of the impact parameters, which shows a peak around ; however, the application of that result to the analysis of major mergers of galaxy clusters would be limited as the simulation box size is not sufficiently large enough.
In this work, we construct the distribution of the impact parameters by using the following form,
| (22) |
where are the free parameters to control the position and the width of the distribution peak, and is the normalization. When the parameters are , Equation (22) reduces to the best-fit distribution (eq. 11) obtained in Khochfar & Burkert (2006). In this work, we use as the fiducial model, which gives the distribution peak at . In Section 4.2 below, we also try various choices of the parameters to test the dependence of the probability of the SZ-X-ray offsets on the distribution of the impact parameters.
4.2. Results of the expected offset probability
We use Equation (15) to estimate the offset rate. In our calculation, the integration limits in Equation (15) are set as follows. Current SZ surveys have discovered clusters in a large mass range from a few to a few (Williamson et al., 2011; Reichardt et al., 2013). We set and in our calculation. We also investigate the results with different in Figure 10. We set and , as only major mergers could produce the obvious offsets in the simulations. We set (see Eq. 3.1.1), as we ignore the flyby mode in this work; and is . We set and . We test for a larger value of and find no much difference in the result, as mergers with only induce small offset ratio.

We define the cumulative offset probability of the SZ-X-ray offset as follows,
| (23) | |||||
In Figure 9, we show the cumulative probability as a function of at different redshifts. As seen from the figure, the cumulative probability is smaller while at lower redshift. The probability for significant offsets observed at higher redshift is higher because the factor of in Equation (23) is larger at higher redshift. For all redshift cases, the cumulative probability is flat over the range of . This is consistent with the ‘jump effect’ shown in Section 3 that the offset rapidly increases to a few hundred kpc after the small cluster passes through the larger one, which roughly equals to the displacement between the mass density centers of the two clusters. Forero-Romero et al. (2010) investigated the distribution of displacements between the peaks of the DM and the gas mass densities in clusters from a large non-radiative SPH cosmological simulation. They found that about of the massive clusters (with masses ranging from to ) at redshift have displacements larger than , and about are larger than . Their results are roughly consistent with ours for 50–100; however, when , their probability is several times smaller than our results. The difference is caused by the jump effect of the X-ray position as discussed above. The period when the X-ray position locates around the center of the small cluster is commonly or longer. This significantly enhances the probability of the offset larger than , which however might be omitted by the used hierarchical friends-of-friends algorithm.
We calculate the cumulative probability for by extrapolating Equation (13). As shown in Figure 9, the probabilities reveal an obvious decay when , mostly because in Equation (15) is larger when is close to the peak of the velocity distribution (see Eq. 10).
Specifically, we discuss the probability at in detail for two reasons, (1) the median redshift of the SZ sample in observations is nearly 0.5 (Marriage et al., 2011; Reichardt et al., 2013); (2) the average redshift of the observed SZ clusters to be compared with our estimation is (see Section 4.4). As seen from Figure 9, for the significant offsets with , the cumulative probabilities of the unrelaxed clusters with SZ-X-ray offset larger than are 11.1%, 9.5%, 8.6%, 8.0%, 6.5%, respectively. The best fit to these probabilities by a power-law form () is shown as the dotted line, with . As discussed above that significant offsets might be omitted in Forero-Romero et al. (2010), our best-fit power index () is flatter than their result ().
In addition, the probability of is approximately one third of that of at . We assume an exponential decay to describe this behavior and to extend the best-fit power-law form. Consequently, we fit the cumulative probability for as follows,
| (24) | |||||
where are the best-fit parameters, and is set to . The best fits of and are and , respectively.
For the offsets with , the jump effect has little influence on the cumulative probability. Our results show that the probabilities at are , and , when , and , respectively. We follow equation (1) in Forero-Romero et al. (2010) to fit the results as
| (25) | |||||
The best-fit gives , approximately consistent with those in Forero-Romero et al. (2010). Since the fitting form is divergent when approaches zero, we set an cutoff at the offset where the cumulative probability is 1.0 in Equation (25).
In Figure 10, we show the cumulative probabilities of the SZ-X-ray offset with different (Eq. 23) in panel (a) and the contribution of mergers in different cluster mass ranges to the cumulative probability of those clusters with in panel (b), respectively. Mergers of the massive systems () tend to produce a larger offset. The cumulative probability of is 5% for the case, while it is about 30% for the case (see panel a). The results in panel (b) shows that the clusters in the low mass range (–) dominate the contribution of the offset. In Table 3, we list the best-fit parameters of the cumulative probabilities for Equations (24) and (25) for different redshift and mass range (see Figs. 9 and 10(a)).
| Fig. 9 | Redshift | ||||||
| 0.025 | -0.86 | 0.028 | -0.27 | 369 | 138 | ||
| 0.039 | -0.84 | 0.044 | -0.27 | 370 | 135 | ||
| 0.052 | -0.84 | 0.060 | -0.27 | 370 | 123 | ||
| 0.072 | -0.85 | 0.085 | -0.27 | 369 | 115 | ||
| 0.13 | -0.86 | 0.16 | -0.27 | 368 | 109 | ||
| Fig. 10(a) | Mass range () | ||||||
| 0.026 | -1.1 | 0.040 | -0.29 | 326 | 109 | ||
| 0.13 | -0.71 | 0.14 | -0.28 | 420 | 114 | ||
| 0.27 | -0.56 | 0.26 | -0.28 | 470 | 151 |
The SZ surveys with large sky coverage may be able to determine both the probabilities of the clusters with offsets larger than a given and then the offset rate , which depends on the cluster merger rate in Equation (15) and thus help to constrain it.


Finally, we discuss some possible uncertainties in the above estimation of the cumulative offset probability.
-
•
In the fitting form of the offset ratio in Equations (13) and (14), we do not consider the mass ratio as an argument. The bottom right panel of Figure 6 reveals that the offset ratio with is about lower than that with . Thus, we might overestimate the probability by a factor of 1.5–2. If we select a tighter constraint of the mass ratio range in Equation (15) with , the cumulative probability shown in Figure 9 (solid line) becomes 5.4%, 4.6%, 4.2%, 3.9%, and 3.2% for 50, 100, 150, 200, and 300 , respectively, which are nearly half of the values reported above.
-
•
In this work, the offset ratio is assumed to be redshift independent. The redshift evolution shown in Figure 9 is purely introduced by the halo merger rate in Equation (15). However, the virial radius of the galaxy cluster is proportional to ; the concentration parameter is anti-correlated with redshift; and the physical mass densities of the dark matter and gas halos also depend on redshift. We use Figure 11 to indicate the effect on the maximum and the duration of the SZ-X-ray offset from the redshift-dependent physical size of the galaxy cluster. In Figure 11, we show the results of the ratio of at redshift to its value at redshift , by performing a series of cluster merger simulations with , . As seen from the figure, the deviation of the ratio from unity is smaller than (or 20%) at redshift (or ) for most of the cases. For , the ratios are possibly larger than at higher redshift due to the higher central density of the cluster and thus a strong collision intensity. For larger , the ratios shift to a lower level at high redshift. At redshift , the redshift evolution of the offset ratio becomes more significant, especially for . The maximum of the SZ-X-ray offset in the case is smaller than at , which implies that the redshift-dependence of the cluster size () plays a more important role on the SZ-X-ray offset size with increasing redshift, although a higher central density enhances the strength of the collision. We conclude that the redshift evolution effect is an important factor for estimating the offset probability only at . Considering both the smaller offset ratio and the higher mass limit of in Equation (15) at high redshift, the cumulative probability of the offset for may be suppressed.

Figure 11.— Ratios of at redshift to its value at , obtained from a series of cluster merger simulations with and at redshift . Different colors represent the simulation results with different , and different types of the points represent different cluster masses, as labeled in the figure. As seen from the figure, the ratios for a large (e.g., ) decrease at higher redshift.
4.3. Impacts of different velocity and impact parameter distributions on the probability
In Section 4.2, we estimate the cumulative probability of the SZ-X-ray offset by using the fiducial model of the distributions of relative velocities and impact parameters presented in Sections 4.1.3 and 4.1.4. The forms and the parameters of the fiducial model are motivated or obtained from cosmological simulations, but there is no observational constraint on them so far. In this section, we discuss the impacts of different distribution parameters on the cumulative offset probability.
In Figure 12, we explore the influence of the pairwise velocity distribution on the probability. In the left panel, in addition to in the fiducial model fitted from the cosmological simulation, we also obtain the results with different values of (=2.5, 3.2, 3.5) in Equation (21) to test the effects of different peak positions of the velocity distribution, where is fixed to be . The peaks locate in the range of 200–2200. In the right panel, we test the effect of different FWHMs in the velocity distribution, where we set different values of (=0.10, 0.15, 0.29, 0.50) and the value of is selected to keep the peak positions of the distributions the same as that of the fiducial model. According to the results shown in Figure 12, we find that the amplitude of the probability is sensitive to the peak position of the velocity distribution, but not to the width. The probability obtained in the fiducial model is approximately larger than that obtained with and by a factor of 1.6 and 5.0, respectively. As seen from the figure, the shapes of the cumulative probabilities of with different velocity distributions are approximately similar. That is because the shape of the probability is mainly determined by the dependence of the offset ratios and the projection factor on (see Eq. 18), and the offset ratios are proportional to in Equation (13), where the best-fit index is approximately a constant and not dependent on the parameters and . The same feature also appears in Figure 13 for the effects of different impact parameter distributions below. However, the cumulative probabilities of are sensitive to the peak position of the velocity distribution. The reason is that the mergers with high relative velocities produce large offsets. In the case, the upper boundary of the velocity distribution is about , and only the massive clusters could produce offsets larger than (see Eq. 10). Due to the relatively small number of the massive clusters, the cumulative probability decays rapidly with . When the peak position of the relative velocity distribution is higher (e.g., ), the cumulative probability becomes flatter at , as the relatively less massive cluster mergers can also produce relatively large offsets.
Note that while the velocity distributions shift to the high-velocity end, the flyby mode should not be ignored any more. From our simulations, we find that the time durations of the significant SZ-X-ray offset of the flyby mode are usually 1–1.5 when for different cluster masses (e.g., see the bottom panel of Fig. 1(b)). The durations are also inversely proportional to the relative velocity and very sensitive to the impact parameter (because off-axis mergers with high relative velocity, e.g., , are relatively ineffective in destroying the gas cores in the large clusters, the offsets are strongly suppressed when the impact parameter gets larger). We roughly estimate the effects of the flyby mode on our calculation. We find that when , the effect is smaller than ; and when , the probability will increase by after including the flyby case. The flyby mode however does not significantly weaken the tendency that a higher peak position of the relative velocity distribution results in a smaller probability. Here we stress that the sensitivity of the probability to the velocity is the crux of the Bullet Cluster problem discussed in Lee & Komatsu (2010) and Thompson & Nagamine (2012). The parameter space search of the Bullet Cluster (1E0657-56) in the literature suggested that such a system requires a high relative velocity during the merger (e.g., Mastropietro & Burkert 2008), which however possibly challenges the standard model. We suggest that the cumulative probability of the observed SZ-X-ray offset could provide an opportunity to examine the incompatibility existing between observed bullet clusters and cosmological simulations.

In Figure 13, we show the cumulative probabilities obtained from different distributions of the impact parameters. The left panel displays the results of the distributions with different peak positions (i.e., ), but with the same FWHM. The distribution reported in Khochfar & Burkert (2006) is also tested. We find that if the peak positions are smaller than , the results show little difference. However, if the peak of the distribution shifts to a larger value, the probability is obviously suppressed as shown by the case in the panel. Compared with our fiducial model, the cumulative probability obtained from Khochfar & Burkert (2006)’s distribution is smaller by a factor 1.7. In the right panel, we change the width of the distribution, but keep the same peak position. We find that a wider distribution gives smaller probability, which is reasonable as the larger impact parameter components contribute more to the distribution in the wider case but less to the large offsets. For the two extreme cases shown in the panel, the probability obtained with is approximately two times larger than that obtained with . As a result, we find that the amplitude of the cumulative probability () depends both on the peak position and the width of the impact parameter distributions. However, the shape of the cumulative probability does not, which is different from the dependence on the velocity distributions.

4.4. The SZ-X-ray offset in observations
In this section, we compare our estimation of the cumulative probability of the SZ-X-ray offset with observations in the real universe. This comparison is motivated mainly by the following reasons: (1) in Sections 4.2-4.3, we estimate the probability of the offset, and find that galaxy clusters with significant offsets are not rare, for example, approximately of the clusters have offsets larger than ; (2) the past several years have seen rapid progress in the SZ cluster observation, in terms of the total numbers and the parameter ranges (precision and redshift); and (3) the comparison would potentially provide constraints to the model used in the estimation of the offset probability, e.g., the pairwise velocity distribution. The majority of the observed SZ clusters to be compared with are at redshift (Andersson et al., 2011) and corresponds to at redshift . In the following comparison, we assume that corresponds to , for simplicity.
The spatial offset between the X-ray and the SZ peaks shown in observations can be modeled to comprise the two following components,
| (26) |
where is the physical one produced by the energetic merger defined in Equation (15) and is the observational error. The (differential) distribution of the physical offset follows the derivative of the offset cumulative probability (i.e., Eqs. 24 and 25) with respect to . In this work, we assume that both of the observational errors in the spatial positions of the X-ray and the SZ peaks follow a Gaussian distribution. The standard deviation of for the X-ray peak () is set to , according to the current capability of the X-ray instrument (e.g., Chandra X-ray Observatory). For the SZ effect, the typical position uncertainty of the SPT SZ cluster centroid is approximately , which dominates the uncertainty . In addition, we also test the results by assuming two higher resolutions of the SZ effect (, and ) in this work.
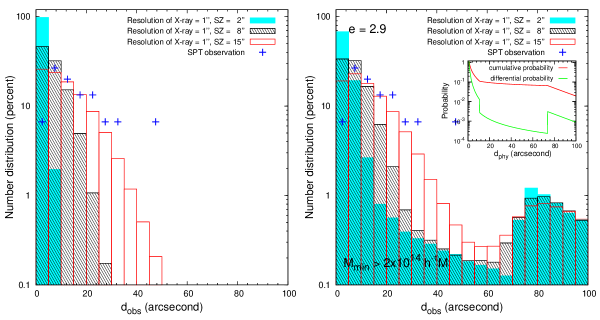
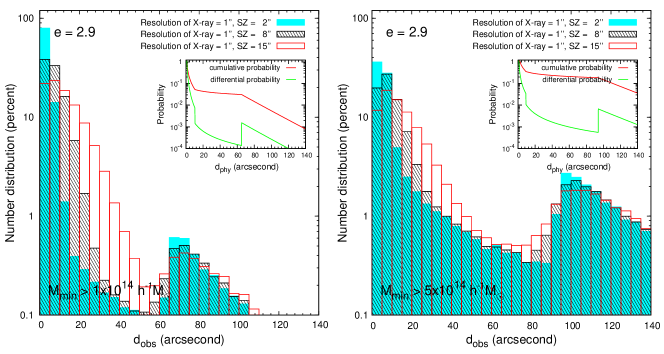
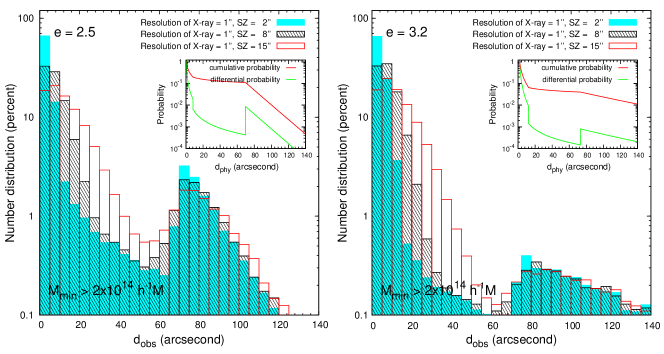
Figure 14 shows the statistical distribution of the SZ-X-ray offsets by using the Monte-Carlo method to simulate both and in Equation (26). The bin size of the offsets is in both panels of Figure 14, and the histogram represents the percentage of the number fraction of the simulated sample in each bin. To illustrate the effect of different distributions of , we show the observational expectations obtained by assuming that and follows the derivatives of Equations (24) and (25) in the left and the right panels, respectively. In the left panel of Figure 14, the offsets are contributed purely by the observational errors; while those SZ-X-ray offsets in the right panel are contributed by both the observational errors and the underlying physical ones. The distribution of is displaced in the inset of the right panel of Figure 14 as the solid line, and the discontinuities appear at and , corresponding to the transitions of the different behavior of the cumulative probability in three different regions of as discussed in Section 4.2 (see Eqs. 24 and 25). As seen from the right panel, the distribution of is bimodal once the underlying physical distribution is considered: some clusters peak around and the others peak at . The lack of clusters with the SZ-X-ray offsets around is mainly due to the “jump effect” as shown in Figures 1(b), 3(b), and 5(b), respectively. The location of the right peak is determined by the combination of the following factors: (1) the maximum offset caused by a merger increases with the cluster mass and the initial relative velocity, as seen from Equation (10); (2) the cluster mass function decreases with increasing mass; and (3) the underlying velocity distribution. A much larger offset is more likely to be contributed by mergers of clusters with relatively large masses and high relative velocities (e.g., see Fig. 15). We list the predicted SZ-X-ray offset distribution for three different SZ resolutions in Table 4 (where the bin size is ).
The distribution of may be significantly biased away from the distribution of , especially when the accuracy in determining the SZ centroid () is not sufficient. For example, the current SPT SZ survey () may obtain mis-estimates of the SZ-X-ray offsets for many clusters simply because of the observational errors. However, these mis-estimates may be modelled and the underlying physical SZ-X-ray offset distribution can still be extracted even if is large. As seen from the right panel of Figure 14, the right peak of the SZ-X-ray offset distribution is hardly to be affected by the uncertainties in determining the SZ centroids. If the current SZ surveys can detect many more clusters, the right peak should be able to be revealed. If future SZ surveys can achieve to higher resolution and higher accuracy in determining the SZ centroids (e.g., or ), the underlying physical distribution of the SZ-X-ray offset may be better determined, and thus can be used to constrain the physics involved in the mergers of clusters.
We show the observational offset distribution obtained from the sample of Andersson et al. (2011) in Figure 14 (plus signs). The observational sample in Andersson et al. (2011) consists of 15 clusters, obtained from observations of of the sky surveyed by the SPT. The average redshift of the sample is . The observational data shown in Figure 14 are the values after transferring the observed displacement between SPT detection and X-ray centroid to the distance at redshift where . As seen from Figure 14, the uncertainties in determining the SZ cluster centroids probably play a dominant role for those clusters with the SZ-X-ray offsets . It appears there are a few clusters with the SZ-X-ray offsets , which cannot be due to the observational errors and must be due to large physical offsets. Our model shows that the cumulative probability of existing clusters with the SZ-X-ray offsets is roughly , which is roughly consistent with observations. Note that the current observational sample is still small (), which may lead to large uncertainties in estimating the distribution of the SZ-X-ray offsets. If SZ surveys can detect many more SZ clusters, it would be possible to accurately estimate the observational SZ-X-ray offset distribution and use it to constrain the underlying cluster merging model and the related physics involved in. In addition, we show that the jump effect plays a dominant role in generating significant offsets, but here we do not consider the secondary X-ray maxima in the data analysis, which would suppress the probability to discover the clusters with offsets larger than .
| 0–20′′ | 20–40′′ | 40–60′′ | 60–80′′ | 80–100′′ | |
|---|---|---|---|---|---|
| 90.7 | 1.6 | 0.8 | 2.0 | 3.0 | |
| 88.7 | 3.5 | 0.8 | 2.0 | 3.0 | |
| 72.9 | 18.3 | 1.9 | 2.0 | 2.8 |
Figure 15(a) presents the model results on the SZ-X-ray offset distribution of clusters within different mass ranges (i.e., different in Eq. 23). As seen from the figure, more massive clusters contribute larger offsets in the observation, as the right peak of the distribution resulted from the high mass case locates at a larger spatial scale in the high mass range (e.g., 100– when ). In Figure 15(b), we show the distributions obtained with different pairwise velocity distributions. As seen from the figure, the bimodal distribution of the offsets still exist for different velocity distributions. As the mean value of the relative velocity increases, the ‘jump effect’ as shown in Figure 1(b) is more significant in causing the scarce of the clusters with intermediate offsets. The higher relative velocity case results in more significant offsets (). The dependence of the distribution of the SZ-X-ray offsets on the pairwise relative velocity distribution of clusters suggests that the observed SZ-X-ray offset distribution can be used to probe the cosmological velocity field at the cluster scale.
5. Conclusion and Discussion
In this paper, we perform a series of numerical simulations for mergers of two galaxy clusters to understand the displacements between the spatial positions of the maxima of X-ray and SZ maps of galaxy clusters. The merger of two clusters destroys their initial thermal state, and the SZ-X-ray offset is produced due to the different dependence of the X-ray and SZ emissions on the density and the temperature distributions of the gas. We find significant offsets () mostly occur between the primary and secondary pericentric passages of the two clusters, due to the “jump effect”. After the primary core-core interaction, the densest gas region locates near the center of the small cluster; and the X-ray peak may jump there from the center of the larger cluster, but the SZ peak does not.
Our simulations explore the parameter space over the primary cluster masses, cluster mass ratios, initial relative velocities and impact parameters of two merging clusters, and we investigate the relation of the maximum and the time duration of the SZ-X-ray offset with the simulation parameter space. Our findings are summarized as follows. (1) A higher initial relative velocity triggers a larger offset. If the initial velocity is high enough (), the two colliding clusters cannot be completely relaxed within the Hubble time (i.e., ‘flyby mode’), different from the behavior of the ‘merger mode’. In the flyby mode, we find that the offset can be even up to . However, since the pairwise velocity distribution obtained from cosmological simulation reveals that of relative velocities lower than , the merger mode dominates the probability of the significantly large offsets appearing in the Universe. For the merger mode, the qualitative features of the offsets caused by the mergers with initial velocity and show no significant difference. (2) The existence and the sizes of the offsets are sensitive to the impact parameter, since they are strongly related with the intensity of the core-core interactions of the two clusters. Only head-on or nearly head-on mergers can form displacements larger than , e.g., for the simulation with and for the one with (). Mergers with smaller impact parameters result in larger sizes and longer durations of the offsets. (3) The SZ-X-ray offsets are strongly related with the masses of the merging clusters. The masses of merging galaxy clusters that possibly result in significant offsets cover the whole mass range of galaxy clusters, i.e., . (4) The mass ratio of the two merging clusters is also an important parameter. The significant offsets are mostly formed by major mergers (). For the mergers with , a large primary cluster mass and a high relative velocity are required to produce offsets larger than .
By applying the above results summarized from the simulations to the individual cluster “Bullet Cluster” (e.g., see Fig. 10 in Hincks et al. 2010), we can give a constraint on the initial relative velocity of the two merging clusters by the SZ-X-ray offset, an observational feature different from that used in previous work (e.g., in Mastropietro & Burkert 2008). In the Bullet Cluster, the maximum of the X-ray image is close to the ‘bullet’, but that of the SZ effect locates near the centroid of the main cluster; and the displacement of the two peaks is around . Considering the high mass ratio of this merging system (Clowe et al., 2006; Bradač et al., 2006), a relative velocity larger than at the initial separation is required to reproduce such a significant offset in our simulations. Note that this lower limit of the initial velocity cannot be decreased, even if the projection effect and the relative uncertainty in other initial parameters are considered. The constraint on the initial velocity is in agreement with the conclusion obtained in Mastropietro & Burkert (2008), and it suggests that the SZ-X-ray offset is a good complement to the methods used in Springel & Farrar (2007) and Mastropietro & Burkert (2008), where the velocity is estimated through reproducing the morphology of the bow shock, the brightness, and the projected temperature profile across the shock discontinuity, etc. Constraints on the relative velocity of the merging cluster is important, as Lee & Komatsu (2010) (see also Thompson & Nagamine 2012) conclude that the existence of the Bullet Cluster is incompatible with the prediction of a model (see also a contrary result in Lage & Farrar 2013), unless a lower infall velocity solution for 1E0657-56 with at is found. In our study (see Section 3.1.4), we show that considering the SZ-X-ray offset and the mass ratio of the two merging clusters, there is little possibility to find such a low velocity solution.
A high relative velocity for merging clusters like 1E0657-56 was also revealed, for example, Molnar et al. (2012) used simulations to reproduce the SZ-X-ray offset of the merging galaxy cluster CL J0152-1357 and found that a large relative velocity of is necessary to explain the observations. As an indicator of the relative velocity, the SZ-X-ray offset owns the advantages of easy identification, simplicity in the relation with the projection effect, and relatively less sensitivity to the detailed gastrophysics in clusters.
To understand the statistic behavior of the SZ-X-ray offsets, we estimate the cumulative probability of the offset, which is related with the merger rate of galaxy clusters and the duration of the offsets in individual merging events. We find that the cumulative probability shows different behavior depending on whether the offset is smaller than or not. This is caused by the “jump effect”, which could significantly enhance the probability of the offset (). We also find that the mergers of the low-mass clusters (i.e., ) dominate the contribution of the offsets for clusters larger than . The amplitude of the cumulative probability decreases with increasing redshift. For clusters with mass larger than at (the average redshift of the observed SZ clusters compared with our model results), the cumulative probabilities are 62.9%, 34.0%, 21.4%, 14.6%, 11.1%, 9.5%, 8.6%, 8.0%, 6.5%, and 2.0% for SZ-X-ray offsets larger than 10, 20, 30, 40, 50, 100, 150, 200, 300, and 500, respectively.
We further discuss some possible uncertainties in our estimation of the probability. (1) We do not consider the mass ratio as an argument in the fitting form of the offset ratio (see Eqs. 13 and 14), which might cause an overestimation of the probability by a factor smaller than . (2) In the simulations, we build the initial conditions of the cluster structure at redshift but not consider that the size of the cluster is redshift-dependent. We find that the redshift-dependence has little effect on the probability when , though the redshift effect becomes more significant at .
We investigate the effects of different distributions of relative velocities and impact parameters on the probability of offset. (1) We find that the amplitude of the cumulative probability within is partly controlled by the relative velocity distribution of merging clusters. For example, if the peak position of the relative velocity distribution shifts from to (or ), the obtained probability decreases by a factor of about (or ). Regarding the challenge of the Bullet Cluster to the standard model for which a high relative velocity is necessary, the crux of solving this problem is the probability of high relative velocities (e.g., ), which has been widely discussed through cosmological simulations (Hayashi & White, 2006; Lee & Komatsu, 2010; Thompson & Nagamine, 2012). However, currently there are few constraints from observations. We suggest that the SZ-X-ray offset provides a tool as the probability of the significant offsets is sensitive to the peak position of the relative velocity distribution. (2) We find that both of the peak position and the width of the impact parameter distribution affect the offset probability. If the peak position shifts from to with the same distribution width, the amplitude of the probability decreases by a factor of 4.7. As the dependence of the shape of the probability on the impact parameter distribution is weaker than the dependence on the relative velocity distribution at , it is robust to use the cumulative probability of the SZ-X-ray offset obtained from observations to explore the distribution of relative velocities at the high-velocity end.
We compare the model distribution of the SZ-X-ray offset with observations and they are roughly consistent. However, the current sample of the SZ clusters with the SZ-X-ray offset estimates are still small, which prevents a comprehensive study from comparing the model distribution with the observations and thus putting constraint on the physics involved in the merging processes of clusters. SZ surveys, such as SPT and ACT, will detect hundreds to several thousands of clusters. Many of them are expected to be followed up by X-ray observations and thus have the SZ-X-ray offset measurements. With a substantial increase of the sample size in the future, the underlying physical distribution of the SZ-X-ray offsets can be extracted, and the unique feature of the second peak around the and the scarce of clusters with at may be revealed. The physical offset distribution can be used to constrain not only the physics involved in cluster merging processes but also the velocity field at the cluster scale.
In this paper, we compare the cluster merging processes simulated by using the GADGET-2 and the FLASH codes. In general, the density and temperature distributions of the merging structure obtained from the two codes are consistent, except that (1) the discontinuity produced by shocks are sharper in the FLASH merger; and (2) the density of the gas core in the inner region of the system produced by the SPH code tends to be higher (by ). These deviations in the strength of the surface brightness, however, have little influence on the positions of the X-ray and the SZ peaks, which guarantees the robustness of our simulation results obtained by merely using the SPH code.
Finally, we discuss some other possible uncertainties or assumptions in this work. First, we do not consider the radiative cooling and various heating mechanisms in the simulation. Among the heating mechanisms, AGN feedback is widely proposed for the required energy in solving the overcooling problem in clusters. However it should not be a key factor in affecting the significant SZ-X-ray offset, because its energy is at least one order of magnitude smaller than the gravitational binding energy released from the cluster merger. But in the inner region of the cluster (e.g. ), AGN feedback has the power to alter the baryon distribution, which reduces the central gas density and increases the temperature in massive clusters (Sijacki & Springel, 2006; Sijacki et al., 2007). This effect should be relatively significant in the X-ray emission since its emission is proportional to , but not in the SZ effect. The AGN feedback might slightly increase the SZ-X-ray offset duration , because the lower central gas density in the large cluster may delay the time of X-ray peak jumping back from the center of the small cluster. Consequently, the probability of the significant SZ-X-ray offset will be enhanced. On the other hand, the lower gas density also mildly reduces the collision strength of the mergers, which could decrease the sizes of the offsets. Though the gastrophysical processes may not have significant influence on the size of the SZ-X-ray offset as they are apt to alter the brightness but not the position of emission peaks, more quantitative explorations on this issue are required in the future. Second, we do not include magnetic field in the simulation. Unless the magnetic field is unusually strong, it should not play an important role in resulting in a significantly large offset, because of the small energy of the normal magnetic field relative to the mechanical energy involving in cluster mergers and its short tangling scale relative to typical size of the SZ-X-ray offset (Carilli & Taylor, 2002). If the magnetic field is quite strong as simulated in Lage & Farrar (2013), the offset probability distribution around the high-SZ-X-ray offset peak shown in this work (the right peak in Fig. 14) would be enhanced. Third, our simulations show that the relaxation of the two cluster mergers always lasts several Gyr. In such a long relaxation time, multiple mergers may have an influence on the SZ-X-ray offset. We run several typical triple merger cases (the whole parameter space is too large to explore) to examine the significance of this effect. We find that there is no apparent difference between the size and the duration of the offsets formed by binary and triple mergers. Though the behavior of the offset arisen by the triple system is complicated, the possibility of the triple mergers especially both of the two subclusters are nearly as massive as the main cluster is extremely low. Even if multiple mergers are taken into account, the correction for the probability of the offsets should be insignificant.
This research was supported in part by the National Natural Science Foundation of China under nos. 10973001, 11273004, and 11373031. Y.L. is supported by the BaiRen program from the National Astronomical Observatories, Chinese Academy of Sciences. The software used in this work was developed in part by the DOE NASA ASC- and NSF supported Flash Center for Computational Science at the University of Chicago.
References
- Andersson et al. (2011) Andersson, K., Benson, B. A., Ade, P. A. R., et al. 2011, ApJ, 738, 48
- Benson (2005) Benson, A. J. 2005, MNRAS, 358, 551
- Binney & Tremaine (2008) Binney, J., & Tremaine, S. 2008, Galactic Dynamics: Second Edition (Princeton University Press)
- Bradač et al. (2006) Bradač, M., Clowe, D., Gonzalez, A. H., et al. 2006, ApJ, 652, 937
- Bryan & Norman (1998) Bryan, G. L., & Norman, M. L. 1998, ApJ, 495, 80
- Bullock et al. (2001) Bullock, J. S., Kolatt, T. S., Sigad, Y., et al. 2001, MNRAS, 321, 559
- Burkert (1995) Burkert, A. 1995, ApJ, 447, L25
- Carilli & Taylor (2002) Carilli, C. L., & Taylor, G. B. 2002, ARA&A, 40, 319
- Carlstrom et al. (2002) Carlstrom, J. E., Holder, G. P., & Reese, E. D. 2002, ARA&A, 40, 643
- Cavaliere & Fusco-Femiano (1978) Cavaliere, A., & Fusco-Femiano, R. 1978, A&A, 70, 677
- Clowe et al. (2006) Clowe, D., Bradač, M., Gonzalez, A. H., et al. 2006, ApJ, 648, L109
- Clowe et al. (2004) Clowe, D., Gonzalez, A., & Markevitch, M. 2004, ApJ, 604, 596
- Colella & Woodward (1984) Colella, P., & Woodward, P. R. 1984, Journal of Computational Physics, 54, 174
- Dolag & Sunyaev (2013) Dolag, K., & Sunyaev, R. 2013, MNRAS, 432, 1600
- Duffy et al. (2008) Duffy, A. R., Schaye, J., Kay, S. T., & Dalla Vecchia, C. 2008, MNRAS, 390, L64
- Fakhouri et al. (2010) Fakhouri, O., Ma, C.-P., & Boylan-Kolchin, M. 2010, MNRAS, 406, 2267
- Forero-Romero et al. (2010) Forero-Romero, J. E., Gottlöber, S., & Yepes, G. 2010, ApJ, 725, 598
- Fryxell et al. (2000) Fryxell, B., Olson, K., Ricker, P., et al. 2000, ApJS, 131, 273
- Genel et al. (2009) Genel, S., Genzel, R., Bouché, N., Naab, T., & Sternberg, A. 2009, ApJ, 701, 2002
- Hayashi & White (2006) Hayashi, E., & White, S. D. M. 2006, MNRAS, 370, L38
- Hincks et al. (2010) Hincks, A. D., Acquaviva, V., Ade, P. A. R., et al. 2010, ApJS, 191, 423
- Itoh et al. (1998) Itoh, N., Kohyama, Y., & Nozawa, S. 1998, ApJ, 502, 7
- Jenkins et al. (2001) Jenkins, A., Frenk, C. S., White, S. D. M., et al. 2001, MNRAS, 321, 372
- Kazantzidis et al. (2004) Kazantzidis, S., Magorrian, J., & Moore, B. 2004, ApJ, 601, 37
- Khochfar & Burkert (2006) Khochfar, S., & Burkert, A. 2006, A&A, 445, 403
- Kravtsov & Borgani (2012) Kravtsov, A. V., & Borgani, S. 2012, ARA&A, 50, 353
- Laganá et al. (2010) Laganá, T. F., de Souza, R. S., & Keller, G. R. 2010, A&A, 510, A76
- Lage & Farrar (2013) Lage, C., & Farrar, G. 2013, arXiv:1312.0959
- Lee & Komatsu (2010) Lee, J., & Komatsu, E. 2010, ApJ, 718, 60
- Macciò et al. (2007) Macciò, A. V., Dutton, A. A., van den Bosch, F. C., et al. 2007, MNRAS, 378, 55
- Markevitch et al. (1999) Markevitch, M., Sarazin, C. L., & Vikhlinin, A. 1999, ApJ, 521, 526
- Markevitch et al. (2000) Markevitch, M., Ponman, T. J., Nulsen, P. E. J., et al. 2000, ApJ, 541, 542
- Markevitch & Vikhlinin (2007) Markevitch, M., & Vikhlinin, A. 2007, Phys. Rep., 443, 1
- Marriage et al. (2011) Marriage, T. A., Acquaviva, V., Ade, P. A. R., et al. 2011, ApJ, 737, 61
- Mastropietro & Burkert (2008) Mastropietro, C., & Burkert, A. 2008, MNRAS, 389, 967
- McCarthy et al. (2007) McCarthy, I. G., Bower, R. G., Balogh, M. L., et al. 2007, MNRAS, 376, 497
- Menanteau et al. (2012) Menanteau, F., Hughes, J. P., Sifón, C., et al. 2012, ApJ, 748, 7
- Mitchell et al. (2009) Mitchell, N. L., McCarthy, I. G., Bower, R. G., Theuns, T., & Crain, R. A. 2009, MNRAS, 395, 180
- Molnar et al. (2012) Molnar, S. M., Hearn, N. C., & Stadel, J. G. 2012, ApJ, 748, 45
- Navarro et al. (1997) Navarro, J. F., Frenk, C. S., & White, S. D. M. 1997, ApJ, 490, 493
- Planck Collaboration et al. (2011a) Planck Collaboration, Aghanim, N., Arnaud, M., et al. 2011a, A&A, 536, A10
- Planck Collaboration et al. (2011b) —. 2011b, A&A, 536, A9
- Planck Collaboration et al. (2011c) Planck Collaboration, Ade, P. A. R., Aghanim, N., et al. 2011c, A&A, 536, A8
- Planck Collaboration et al. (2012) Planck Collaboration, Aghanim, N., Arnaud, M., et al. 2012, A&A, 543, A102
- Poole et al. (2006) Poole, G. B., Fardal, M. A., Babul, A., et al. 2006, MNRAS, 373, 881
- Reichardt et al. (2013) Reichardt, C. L., Stalder, B., Bleem, L. E., et al. 2013, ApJ, 763, 127
- Rephaeli & Yankovitch (1997) Rephaeli, Y., & Yankovitch, D. 1997, ApJ, 481, L55
- Ricker (2008) Ricker, P. M. 2008, ApJS, 176, 293
- Ritchie & Thomas (2002) Ritchie, B. W., & Thomas, P. A. 2002, MNRAS, 329, 675
- Roettiger et al. (1997) Roettiger, K., Loken, C., & Burns, J. O. 1997, ApJS, 109, 307
- Rybicki & Lightman (1979) Rybicki, G. B., & Lightman, A. P. 1979, Radiative processes in astrophysics
- Sarazin (2001) Sarazin, C. L. 2002, Merging Processes in Galaxy Clusters, 272, 1
- Sheth & Tormen (1999) Sheth, R. K., & Tormen, G. 1999, MNRAS, 308, 119
- Sijacki & Springel (2006) Sijacki, D., & Springel, V. 2006, MNRAS, 366, 397
- Sijacki et al. (2007) Sijacki, D., Springel, V., Di Matteo, T., & Hernquist, L. 2007, MNRAS, 380, 877
- Springel (2005) Springel, V. 2005, MNRAS, 364, 1105
- Springel & Farrar (2007) Springel, V., & Farrar, G. R. 2007, MNRAS, 380, 911
- Springel et al. (2001) Springel, V., Yoshida, N., & White, S. D. M. 2001, New Astronomy, 6, 79
- Suginohara & Ostriker (1998) Suginohara, T., & Ostriker, J. P. 1998, ApJ, 507, 16
- Thompson & Nagamine (2012) Thompson, R., & Nagamine, K. 2012, MNRAS, 419, 3560
- Tinker et al. (2008) Tinker, J., Kravtsov, A. V., Klypin, A., et al. 2008, ApJ, 688, 709
- Vikhlinin et al. (2009) Vikhlinin, A., Burenin, R. A., Ebeling, H., et al. 2009, ApJ, 692, 1033
- Vitvitska et al. (2002) Vitvitska, M., Klypin, A. A., Kravtsov, A. V., et al. 2002, ApJ, 581, 799
- Watson et al. (2014) Watson, W. A., Iliev, I. T., Diego, J. M., et al. 2014, MNRAS, 437, 3776
- Wechsler et al. (2002) Wechsler, R. H., Bullock, J. S., Primack, J. R., Kravtsov, A. V., & Dekel, A. 2002, ApJ, 568, 52
- Wetzel (2011) Wetzel, A. R. 2011, MNRAS, 412, 49
- Williamson et al. (2011) Williamson, R., Benson, B. A., High, F. W., et al. 2011, ApJ, 738, 139
- Zemp et al. (2008) Zemp, M., Moore, B., Stadel, J., Carollo, C. M., & Madau, P. 2008, MNRAS, 386, 1543
- Zhao et al. (2003) Zhao, D. H., Mo, H. J., Jing, Y. P., B’́orner, G. 2003, MNRAS, 339, 12
- ZuHone (2011) ZuHone, J. A. 2011, ApJ, 728, 54
- ZuHone et al. (2009) ZuHone, J. A., Ricker, P. M., Lamb, D. Q., & Karen Yang, H.-Y. 2009, ApJ, 699, 1004