Near-UV absorption in very cool DA white dwarfs
Abstract
The atmospheres of very cool, hydrogen-rich white dwarfs (K) are challenging to model because of the increased complexity of the equation of state, chemical equilibrium, and opacity sources in a low-temperature, weakly ionized dense gas. In particular, many models that assume relatively simple models for the broadening of atomic levels and mostly ideal gas physics overestimate the flux in the blue part of their spectra. A solution to this problem that has met with some success is that additional opacity at short wavelengths comes for the extreme broadening of the Lyman line of atomic H by collisions primarily with H2. For the purpose of validating this model more rigorously, we acquired Hubble Space Telescope STIS spectra of eight very cool white dwarfs (5 DA and 3 DC stars). Combined with their known parallaxes, and Spitzer IRAC photometry, we analyze their entire spectral energy distribution (from 0.24 to 9.3m) with a large grid of model atmospheres and synthetic spectra. We find that the red wing of the Lyman line reproduces the rapidly decreasing near-UV flux of these very cool stars very well. We determine better constrained values of and gravity as well as upper limits to the helium abundance in their atmospheres.
1 Introduction
As the end stage of the evolution of the vast majority of stars, white dwarfs (WDs) are common denizens of the solar neighborhood. With masses of about 0.6 M⊙ and radii of cm, they are characterized by high surface gravities of . The coolest known disk white dwarfs have effective temperatures of K or slightly lower (Bergeron, Leggett & Ruiz, 2001; Kilic et al., 2009a, 2010a; Giammichele, Bergeron & Dufour, 2012). The combination of low temperature and high gravity results in high photospheric densities where dense matter physics comes into play and affects the model atmospheres and emergent spectra significantly. The atmospheres of very cool white dwarfs present modeling challenges that are not encountered in other types of stars.
White dwarf atmospheres thus present interesting physics problems in the equation of state of non-ideal gases, molecular dissociation and ionization in the presence of inter-atomic and inter-molecular interactions, extreme pressure-broadening of absorption lines, and other dense matter physics which are unique in the field of stellar atmospheres (Kowalski, 2010). Laboratory opacity measurements have started to probe this interesting regime only recently (Falcon et al., 2013). On the other hand, the spectra of these very cool white dwarfs bear the signatures of dense matter physics and models of these effects can thus be tested in a fairly direct fashion.
In addition to their value as good laboratories for the physics of dense hydrogen and helium, very cool white dwarfs are of interest as common remnants of ordinary stars. Devoid of internal energy sources, they simply cool to ever lower effective temperatures. The finite age of the Galaxy results in a fairly sharp drop in the white dwarf luminosity function at (Harris et al., 2006) or K. The shape of the WD luminosity function – the location of the low-luminosity drop off in particular – contains information about the age of the WD population, the star formation history of its progenitors and the physics of WD cooling as well (Fontaine, Brassard & Bergeron, 2001). This approach to cosmochronology has led to estimates of the age of the disk of the Galaxy (Winget et al., 1987; Wood, 1992; Leggett, Ruiz & Bergeron, 1998; Giammichele, Bergeron & Dufour, 2012) and of several globular and galactic clusters (Hansen et al., 2004; von Hippel, 2005; Hansen et al., 2007; Jeffery et al., 2011; Hansen et al., 2013). Such determinations depend primarily on the estimated ages of the coolest WDs of the sample, requiring accurate values of their basic stellar parameters such as , gravity, and composition (Kowalski, 2007). For disk WDs the drop off in the luminosity function is bright enough to be observed and the accuracy of WD cosmochronology is determined in large part by the ability of atmosphere models and synthetic spectra in matching the spectral energy distributions (SEDs) of the coolest known WDs.
In a landmark analysis of homogeneous optical and near-infrared photometry of a large sample of cool white dwarfs, Bergeron, Ruiz & Leggett (1997) and Bergeron, Leggett & Ruiz (2001) found that their models systematically overestimated the flux in the band of WDs of spectral type DA (showing Balmer lines in the spectra) with K, suggesting that a source of opacity was missing in the calculations at short wavelengths. This deficiency of the models at short wavelengths has sometimes forced several studies to exclude from the analysis the flux (Bergeron, Ruiz & Leggett, 1997; Bergeron, Leggett & Ruiz, 2001) or the Sloan Digital Sky Survey (SDSS, York et al. (2000)) and sometimes fluxes (Kilic et al., 2010a) for the coolest stars. Bergeron, Ruiz & Leggett (1997) suggested that the most likely source of this “blue blanketing” was a broadening of the Lyman bound-free edge of hydrogen atoms (at Å) to longer wavelengths due to a lowering of the continuum by collisions. Modeling this “pseudo-continuum” opacity in an ad hoc fashion, they showed that it could, in principle, reproduce the observed fluxes.
An interesting illustration of this problem is the case of the cool DA star BPM 4729 (WD 0752676). Bergeron, Ruiz & Leggett (1997) and Bergeron, Leggett & Ruiz (2001) found and excellent fit of the photometry and the H line with a pure hydrogen atmosphere with K and . Wolff, Koester & Liebert (2002) re-analyzed this star adding to the photometry a near-ultraviolet (near-UV) spectrum from the Hubble Space Telescope (HST) Faint Object Spectrograph that extends the observed SED down to m. With models that include the pressure broadening of the Ly line, they found that pure hydrogen models failed to reproduce the SED below m. Only by considering atmospheres dominated by helium, with a number ratio of were they able to reproduce the near-UV spectrum, with K and . However, this model did not provide a good match of the photometry and, due to the trace amount of hydrogen, did not produce the H and H lines seen in the spectrum.
By considering the interactions between the H atoms and H2 molecules that form in the atmosphere of a very cool DA, Kowalski (2006b) provided a realistic model of the bound-free opacity and the broadening of the Ly edge and showed that it is negligible in the blue part of the spectrum of cool WDs. On the other hand, using a similar broadening model, Kowalski & Saumon (2006) showed that the Ly line could be collision-broadened well into the blue part of the optical spectrum. Collisions of neutral H atoms with H, He and H2 were modeled and Kowalski & Saumon (2006) showed that in very cool white dwarfs the broadening of Ly was caused primarily by collisions with H2 molecules. Subsequently, Allard & Kielkopf (2009) computed Ly profiles broadened by collisions with H and He but not H2. As a result of this omission, their profiles do not extend into the optical and are unable to fully explain the flux deficiency observed in very cool WDs. The Ly profile was independently modeled by Rohrmann, Althaus & Kepler (2011), including collisions with H2, nicely confirming the calculations of Kowalski & Saumon (2006).
When implemented in atmosphere models, the opacity of the red wing of the Ly line is able to reproduce the photometry of the DA and DC stars in the BRL sample quite well, including the problematic band flux (Kowalski & Saumon, 2006). It also matches the WD sequence in the color-magnitude diagram of hundreds of WDs in the SDSS sample of Kilic et al. (2006). A more critical test of this new opacity model was a fit of the spectral energy distribution of BPM 4729 including the near-UV spectrum. Kowalski & Saumon (2006) produced the first good fit of the entire SED of this star. In contrast with previous efforts, they found that a pure hydrogen atmosphere model nicely reproduces its spectrum, with K and . This represented a good but limited validation of their Ly opacity model. More recent analyses of WD photometry have successfully matched the blue part of the SEDs with these Ly profiles (Kilic et al., 2009a, b; Giammichele, Bergeron & Dufour, 2012). To summarize, the opacity provided in the near-UV and blue part of the spectra of very cool WDs by the red wing of the Ly line as modeled by Kowalski & Saumon (2006) and Rohrmann, Althaus & Kepler (2011) is on a sound theoretical basis. Empirically, it is well-supported by comparison with fits of broad band photometry of dozens of white dwarfs, but these SEDs include only one bandpass that falls within the line wing ( or ). The model passed a more stringent test by reproducing not just a broadband flux () but also the shape of the profile for BPM 4729. Together, these successful applications of the opacity model for the red wing of Ly constitute valuable but limited tests. A more direct and thorough approach is desirable to firmly establish its validity.
In this contribution, we present new near-UV spectroscopy of eight very cool white dwarfs with K acquired with the Space Telescope Imaging Spectrograph (STIS; Hernandez et al. (2014)) on the HST. These data are combined with optical, near-IR and mid-IR photometry, and the stars’ parallaxes to produce complete spectral energy distributions. We fit these data with synthetic spectra with the goals of more thoroughly validating the model of Kowalski & Saumon (2006) for the red wing of the Ly line and determine more reliable and gravities for our sample stars. The possible presence of He in the atmosphere of cool DA and DC stars has long been of interest to understand the mechanism of spectral evolution of cool white dwarfs. The determination of the He abundance remains fraught with uncertainty in the absence of He absorption lines in these stars. As the HST STIS data extends the SEDs of our stars considerably, and that the broadening of the Ly line is sensitive to the presence of He, we also explore what constraints can be obtained on the He/H ratio in the atmospheres of very cool DA and DC white dwarfs.
2 Sample, observations and other data
2.1 Sample of very cool white dwarfs
To achieve these goals, we selected eight very cool WDs, five of spectral type DA and three of type DC to be observed with HST/STIS. The targets were required to have K so that broadening of the Ly line by H2 would be expected, to have H-dominated atmospheres as determined by recent studies, and to be bright enough to be detectable with a sufficient signal-to-noise with the STIS instrument. Furthermore, and to maximally constrain the models, each target was required to have a known trigonometric parallax, optical photometry, Two Micron All Sky Survey (2MASS; Skrutskie et al. (2006)) photometry, and Spitzer Space Telescope Infrared Array Camera (IRAC; Fazio et al. (2004)) fluxes in all four bands. While we selected very cool stars to cover a broad range of , we specifically excluded so-called “ultracool” WDs. These DC stars are characterized by a very strong flux deficit in the near-IR and very peculiar SEDs (Gates et al., 2004; Harris et al., 2008) that cannot be reproduced by current models (Kilic et al., 2009a, 2010a). These poorly understood stars are unsuitable for our purposes.
2.2 HST STIS Observations
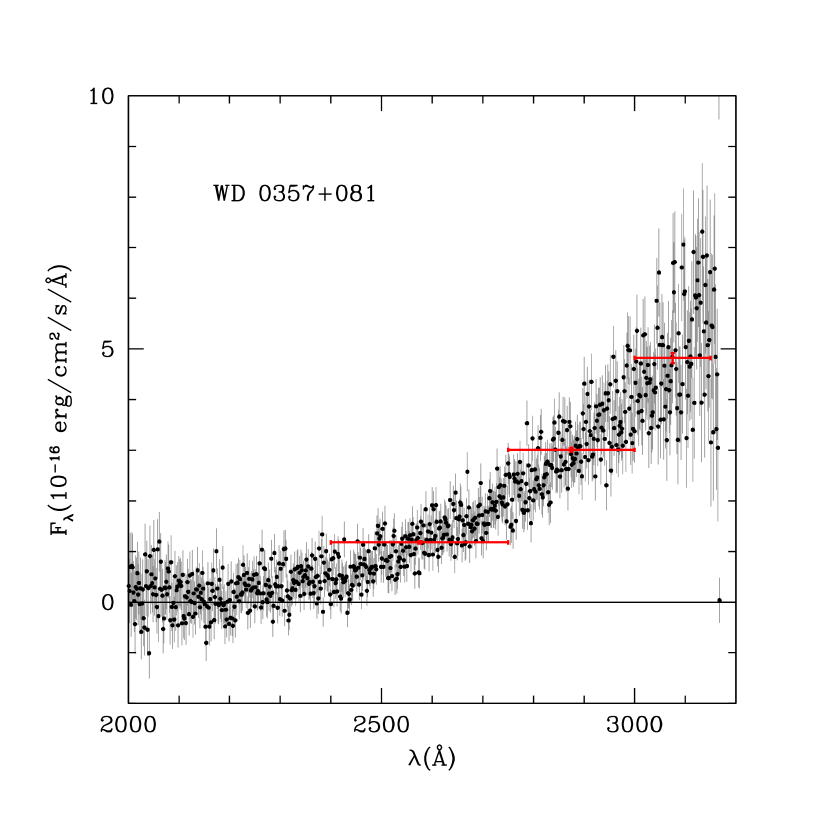
The STIS observations of our eight targets were conducted under HST Cycle 18 GO program 12188 during 2011 and 2012. The primary observing sequence in each instance was identical. The spectra were obtained with the G230L grating in first order and the aperture with the STIS/NUV-MAMA detector in “accumulate” mode. The one-orbit exposures, which ranged from 2000 to 2990 s, covered the wavelength range 1600 to Å with a nominal resolving power of 500. Because our targets are relatively faint and characterized by spectral energy distributions that steeply plunge towards shorter wavelengths, useful data were only obtained longward of 2400 Å. A typical STIS spectrum is shown in Figure 1. All of the STIS spectra are featureless within the noise level of the data.
For the purpose of fitting the SED of each star, we converted the STIS spectra into photometric fluxes in three bandpasses. This effectively puts the STIS data on the same footing as the optical and infrared photometry for the analysis. To maintain a relatively uniform sampling of the SED and weighting of the various spectral regions in the fitting procedure, we defined bandpasses with , which is comparable to the resolving power of standard optical and near-IR filters. We also widened the bandpasses at shorter wavelengths to maintain a reasonable S/N ratio as the flux decreases. The adopted boxcar bandpasses to bin the STIS spectra are 2400 – 2750 Å (“STIS1”), 2750 – 3000 Å (“STIS2”), and 3000 – 3150 Å (“STIS3”) as shown in Figure 1. The resulting fluxes and uncertainties are given in Table 1.
Depending on the band, detected fluxes were at the level of several times corresponding to S/N ratios of 6-50. However, no detectable signal was measured for our faintest target, WD 0747+073A. Another faint target, WD 0747+073B, was barely detected in our STIS3 band at the level. For these two stars only upper limits were obtained that are consistent with background limited uncertainties. It appears likely that these two stars were not properly acquired in the STIS slit and that the pointing missed both targets. WD 0747+073A is our faintest target but is only about 30% fainter in the optical than our second faintest target, WD 2054050 (Table 2). The other undetected star, WD 0747+073B, is comparable in brightness to WD 2054050 in the optical which was cleanly detected in all three STIS bandpasses at . Considering that the SEDs of our samples stars are all rapidly decreasing toward shorter wavelengths, we would expect that a somewhat faint object would show some flux in the STIS3 and perhaps STIS2 bandpasses, but this is not the case here. These two undetected targets form a common proper motion pair separated by . WD 0747+073A was acquired by offset from the position of its companion. Thus, a pointing error in the STIS observations of WD 0747+073B would also compromise the acquisition of WD 0747+074A. Further evidence that only blank sky was observed for these two stars is provided by our analysis of their SEDs (§4). In light of these considerations, we exclude the upper limits on the STIS fluxes given in Table 1 from our analysis of these two stars.
2.3 Photometry and fluxes
Optical photometry in the Landolt bandpasses was obtained primarily from Bergeron, Ruiz & Leggett (1997), complemented with data from additional published sources. In general averages were taken when there was more than one set of data for a star. band photometry is desirable as it bridges the ground-based optical data and the near-UV STIS data. It is obtained from the ground and is well-known to be affected by the strong and steeply increasing atmospheric absorption towards shorter wavelengths. In practice, it is subject to large systematic errors that are not necessarily reflected in the quoted measurement uncertainties. Five of our targets have published magnitudes. For WD 1820+609 the flux is strongly discrepant with the neighboring STIS and fluxes and is thus suspicious. Of the remaining four stars, our fits of the SEDs (see below) reveal the flux to be very poorly matched in three cases, even though the adjacent fluxes are well fitted. Only for WD 2054050 were we able to obtain a good fit of the flux. For these reasons, we consider the magnitudes of these stars to be unreliable and have ignored them in the analysis.
Near-infrared photometry for our targets was drawn from the 2MASS Point Source Catalog111http://www.ipac.caltech.edu/2mass/releases/allsky/. The magnitudes were converted to flux units following the calibration of Holberg & Bergeron (2006). Mid-infrared fluxes are available in all four channels of the Spitzer IRAC instrument (Kilic et al., 2009a). Tables 1–3 compile all the fluxes as well as the parallaxes used in our analysis. The combination of the three STIS fluxes, fluxes and all four IRAC fluxes provides an evenly spaced sampling of the SEDs of our targets from 0.24 to 9.3m with only one gap at the bandpass. In units, the flux distributions typically peak in the or bandpass and reach down to fluxes 100 times fainter at the blue end of our data, and times fainter at the red end. Additionally, H spectroscopy is available for all targets (Giammichele, Bergeron & Dufour, 2012). This represents a remarkably complete data set for such very cool WDs.
3 Analysis
3.1 Atmosphere models
The equation of state, the chemical equilibrium and the opacity of the gas are all affected by the high densities that occur in the atmospheres of very cool white dwarfs. The atmosphere models and synthetic spectra we applied in the following analysis include all the dense fluid models we developed for WD atmospheres over the last decade. Specifically, they include for hydrogen the pressure-broadened red wing of the hydrogen Ly line (Kowalski & Saumon, 2006) – the focus of this study –, the non-ideal dissociation equilibrium of (Kowalski, 2006a), and the pressure induced ionization of (Kowalski, 2010). For helium, density corrections to the Rayleigh scattering, the free-free opacity (Iglesias et al., 2001), and the non-ideal ionization equilibrium in the low-temperature, dense fluid (Kowalski et al., 2007) are all important for He-rich models and especially pure He models. In mixed He/H atmospheres, we used collision-induced absorption recently calculated by Abel et al. (2012). Finally, the solution of the radiative transfer equation takes into account the vertical variation of the refractive index (Kowalski & Saumon, 2004). Because the gas density at the photosphere remains moderate for He/H ratios of , we consider the models of low He/H ratios to be reliable. At higher helium abundances (), the physics of the fluid becomes increasingly challenging to model and the synthetic spectra are more uncertain. These atmosphere models have been successfully applied in several studies of the SEDs of very cool white dwarf stars. This includes two stars with near-UV spectra (BPM 4729 (Kowalski & Saumon, 2006) discussed in the introduction, and the WD companion to a pulsar (Durant et al., 2012)), studies of large samples of WDs from the SDSS or observed with Spitzer (Kilic et al., 2008, 2009a, 2009b) as well as halo WD candidates (Hall et al., 2008; Kilic et al., 2010b, 2012).
Model atmospheres and synthetic spectra were calculated for to 6000 K in steps of 100 K, to 9 in steps of 0.5, and for He/H number ratios of (“pure H”), 2, 1, 0.3, 0, 0.3, 1, 2, 3, 4, 5, 6, and 20 (“pure He”). Due to the difficulty of obtaining converged models for some combinations of parameters – particularly for high gravity combined with low- and high He/H ratios – the final grid contains 969 of the 1365 models that would completely cover the parameter space described above. As we will see below, many combinations of parameters are irrelevant to our analysis and this partial grid is amply adequate for our purposes.
Given the filter bandpasses we defined for the STIS data (§2.2), the filters (Cohen et al., 2003a), the 2MASS filters (Cohen, Wheaton & Megeath, 2003b), and the Spitzer IRAC bands222http://irsa.ipac.caltech.edu/data/SPITZER/docs/irac/calibrationfiles/spectralresponse/ we obtain synthetic photometric fluxes by integrating the synthetic spectra over model bandpasses
| (1) |
where is the model flux density and the transmission curve of bandpass .333The 2MASS bandpasses are given as . These synthetic photometric fluxes can then be directly compared with the data.
3.2 Fitting procedure
The integrated model fluxes are fitted to the data by a least-squares method to obtain the stellar parameters. We proceed by finding the minimum of the surface defined by
| (2) |
for a fixed value of . In Eq. (2), is the number of bandpasses, the observed flux at the Earth in bandpass , its uncertainty, and is the distance given by the parallax . is the radius of the white dwarf obtained from the evolution sequences of Fontaine, Brassard & Bergeron (2001). For a fixed value of , Eq. (2) defines a surface in the plane that can be minimized to find the optimal parameters for each star. A comparison of the fits and obtained for the different values of can then constrain the helium abundance in the atmosphere.
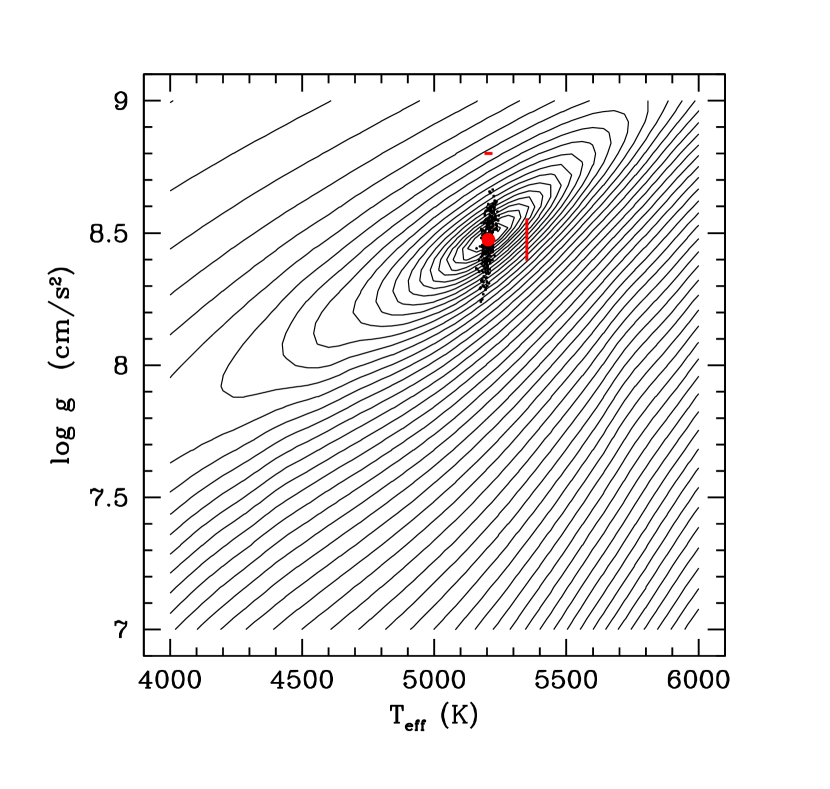
To fit a particular star, we first evaluate Eq. (2) at each model grid point for a fixed value of . Fluxes for missing models are interpolated in with a cubic spline fit along a fixed gravity. Extrapolations are sometimes necessary to fill the model grid, but fits falling in an extrapolated region are discarded. The filled surface is fitted with a two-dimensional cubic spline for the purpose of interpolating between grid points.444Our choice of spline interpolation was driven by the requirement that the interpolation be smooth. While a spline interpolation along only five points in gravity is not a priori reliable, we found that using a 5-point Lagrange polynomial interpolation gives very nearly the same results. Piece-wise linear or quadratic interpolations in bear a strong imprint of the grid and are not suitable. This function is then minimized using a downhill simplex algorithm (Press et al., 1986) to obtain the values of that best fit the data. In all cases, the surface has a single, well-defined minimum (Figure 2).
We determine the uncertainties on the fitted parameters by repeatedly fitting synthetic data generated by adding random variations around the measured values with a Gaussian distribution of a width given by the error bar. These synthetic data sets are obtained by randomly sampling the distributioni of values for the parallax and each of the observed fluxes. We found that 2000 such samplings give converged results. We thus obtain a distribution of values for a fixed for each star. We take the average value and the dispersion along and as the best-fit values and their uncertainties. An example of this procedure in shown in Fig. 2. The surface corresponding to the nominal observed value is shown by the contours. The minimum is within a valley that corresponds closely with a line of constant bolometric luminosity (not shown). The cluster of small dots results from the sampling of the observational error bars, and their average value is indicated by the large dot and their standard deviation by the vertical and horizontal bars. We find that the dispersion in gravity is primarily determined by the uncertainty in the parallax, while that in reflects mostly the photometric error bars. In most cases, as in this example, the values of the gravity and are only weakly correlated.
4 Results
4.1 Pure hydrogen models
Based on previous analyses (Kilic et al., 2009a; Giammichele, Bergeron & Dufour, 2012), we expect our target stars to have atmospheric compositions dominated by hydrogen. To cast our study in the context of the existing body of work, we first perform the analysis with models of pure H composition () which also provides a reference for the discussion of the He abundance in these stars that will follow.
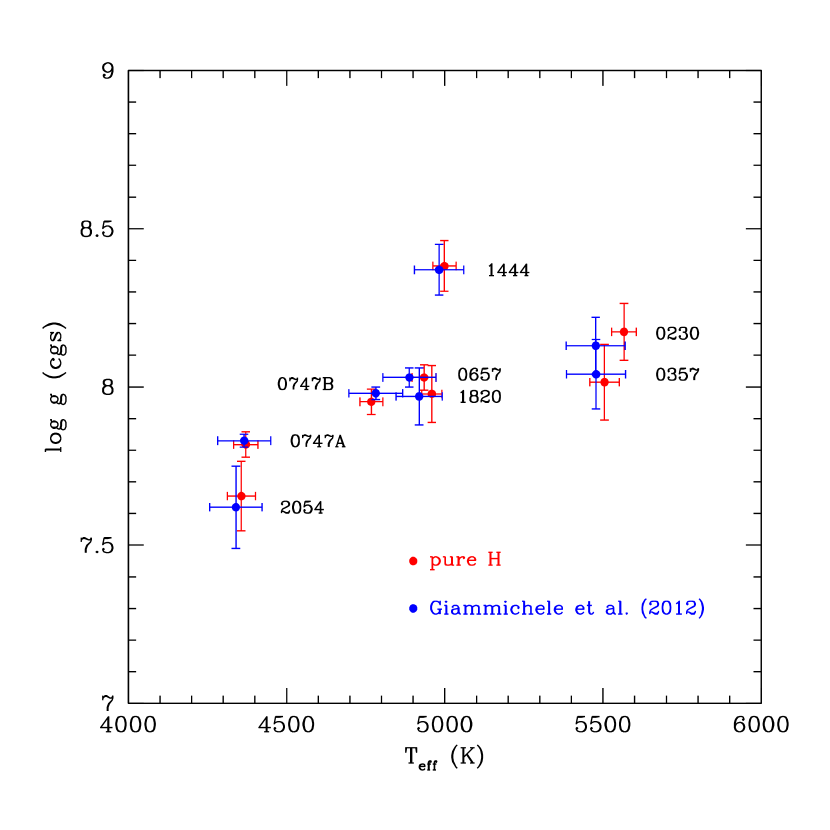
We ascertain the validity of our fitting procedure by comparing with the recent work of Giammichele, Bergeron & Dufour (2012) who have fitted the photometry of 169 nearby white dwarfs, including all 8 of our targets. For this purpose, we fitted only the data (Tables 2 and 3) with our pure H models. This is consistent with their determination that all of our targets are better fitted with pure H atmospheres than with pure He models. Our photometry is on the same photometric system (Holberg & Bergeron, 2006) but we use 2MASS photometry while Giammichele, Bergeron & Dufour (2012) use CIT filters for six of our stars, and 2MASS photometry for the other two. The adopted parallaxes are identical except for WD 2054050 which is slightly updated here but otherwise agrees with the value used by Giammichele, Bergeron & Dufour (2012) within the uncertainties. We have verified that our pure H models are nearly identical to those used in their analysis (P. Bergeron, priv. comm.). Thus differences in the fitted and values can only arise from variations in the adopted fluxes in each band (which are identical in many cases), differences in the adopted near-IR photometric systems, and the numerical implementation of the fitting procedure.
Figure 3 shows the excellent agreement between our results and those of Giammichele, Bergeron & Dufour (2012), well within their respective error bars in every case. Gravities agree to within 0.01 dex for 5 of the stars and differs by 0.04 dex in the worst case (WD 0230144). The effective temperatures are also in excellent agreement with an average absolute difference of 32 K. There seems to be a systematic offset, however, as for all but one star (WD 0747+073A) we find slightly higher effective temperatures. These small differences between our results for may be due to their coarser grid of models (K, versus 100 K here). While our uncertainties in are essentially the same, those in are typically about half of those reported in Giammichele, Bergeron & Dufour (2012). Since the uncertainty in our data (Tables 1-3) is in nearly all cases the same as that reported in Giammichele, Bergeron & Dufour (2012), this systematic difference in must come from our different approaches to estimate the errors in the fitted parameters.
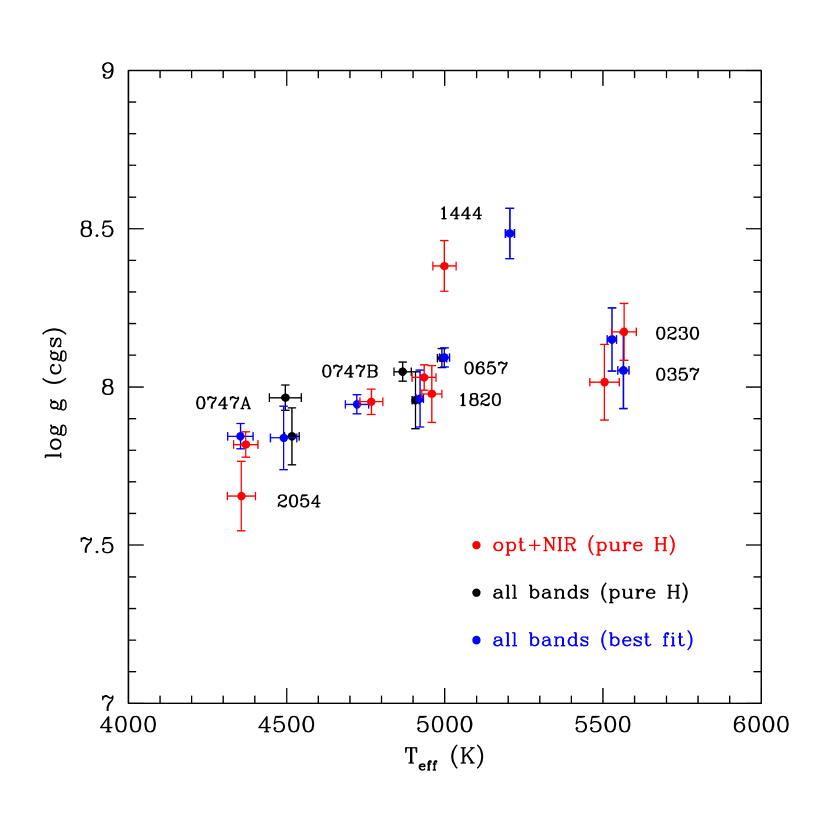
Having established that we reproduce recent published results very well, we now proceed to fit the entire SEDs of our target stars, including the STIS data, photometry, 2MASS photometry and the fluxes in all four Spitzer IRAC bandpasses with pure H models. This set of 14 bandpasses spans wavelengths from 0.24 to 9.3m, which includes 90–96% of the bolometric flux of these cool stars. As and are the only two free parameters in the models (we only consider pure H models for now), this data set strongly constrains the fits and constitutes a stringent test of the models.
The and gravities obtained from fitting the SEDs with pure H models () are given in Table 4 and in Figure 4. Compared to the values we obtained by fitting only the optical and near-IR photometry only, the have increased for five stars and decreased for the other three, but generally within the uncertainties. A similar pattern is found for the change in . Although two stars (WD 1444174 and WD 2054050) stand out for their much larger change in the values of both and , there is no pattern in terms of gravity, or He/H ratio (see below) in the effect of adding the near-UV and the IRAC fluxes to the fitting procedure. On the other hand, the near-UV and mid-IR fluxes very effectively constrain the range of models that can fit the data, resulting in formal uncertainties that are 2–3 times smaller than when fitting only the optical and near-IR fluxes (Figure 4). The typical uncertainty is 10–20 K, which shows the advantage of using as broad a photometric baseline as possible to accurately determine the of the coolest DA and DC white dwarfs. This is only the formal internal uncertainty and it does not include errors due to the limited fidelity of the models or in the photometry that are systematic in nature. The true uncertainty on is likely larger than the values quoted in Table 4. On the other hand, the uncertainty in the gravity is unchanged as it depends primarily on the accuracy of the parallaxes.
Except for WD 0230144, for which the is almost as good as for the fits with the optical and near-IR fluxes only, fits of the complete SEDs have larger values of . This is not surprising as it is much harder to get models to fit a full SED. It also shows that while our description of the physics of these very cool atmospheres is fairly realistic (see below), it needs to be further refined to fully match the precision of the data. Nonetheless, some very good fits are obtained with this pure H composition for WD 0230144 and WD 0357+081 (Figure 5). In the next section we discuss the overall best fit for each star.
4.2 Mixed helium and hydrogen models
Several mechanisms of great import occur in the atmospheres of cool WDs such as inter-species diffusion, convective mixing, and the accretion of interstellar or planetary material. These processes cause temporal variations in the atmospheric composition that, when combined with the changes in the chemistry and opacity as decreases lead to distinctive changes in WD spectra, collectively known as spectral evolution. Because of decreasing thermal excitation, absorption lines of neutral He disappear in WD spectra for K (Bergeron, Wesemael & Fontaine, 1991; Tremblay et al., 2010) and the presence of He in the atmosphere must be inferred indirectly. In cool DA stars for instance, only H lines are seen but the presence of neutral He atoms can broaden the Balmer line profiles (Wehrse, 1977; Liebert & Wehrse, 1983; Bergeron, Wesemael & Fontaine, 1991). In the coolest stars with H-rich atmospheres (K), the Balmer lines also become invisible for lack of thermal excitation and their spectra are featureless (Bergeron, Ruiz & Leggett, 1997), the defining characteristic of the DC spectral class. In the absence of spectral lines or with only a very weak H line, the spectroscopic method (Bergeron, Wesemael & Fontaine, 1991; Bergeron, Saffer & Liebert, 1992) can no longer be applied and the composition of these very weak DA stars and very cool DC stars must be inferred primarily from the shape of their SEDs. Continuum absorption processes involving H2 and He each have characteristic wavelength dependences that can, in principle, reveal the composition of the atmosphere. Two opacity sources are of particular interest to this study. In the near-UV, the absorption is dominated by the red wing of the Ly line which is pressure-broadened primarily by collisions with H2 and H, but also with He (Kowalski & Saumon, 2006). The latter is the weaker broadening mechanism but it can become important for large He/H ratios. The other absorption mechanism is the collision-induced absorption (CIA) by H2 molecules (Abel & Frommhold, 2012) which absorbs mainly in the near-IR with a particularly strong band in the bandpass. The very broad roto-translational band of H2 CIA peaks around 5–10m and affects the mid-IR flux. In cool DA and DC white dwarfs, the H2 CIA occurs whether the collisional partner is another H2 molecule, a H atom or a He atom. In He-enriched atmospheres, the lower H2 abundance tends to reduce the CIA, an effect that is over compensated by the higher photospheric density in such models, resulting in very strong H2 CIA for (Bergeron, Saumon & Wesemael, 1995; Bergeron & Leggett, 2002). Our data set spans these two critical spectral regions and offers a valuable opportunity to constrain the He/H ratio in very cool DA and in H-rich DC.
In the previous section, we fitted the data with pure H models by minimizing . By varying the He/H ratio, it may be possible to improve the quality of the fit and determine the He abundance in these atmospheres (Kilic et al., 2009a). We have repeated the fitting procedure for every value of He/H ratio in our model grid and studied the behavior of the minimum as a function of (Figure 8). The general trend is that the is relatively constant for small He/H ratios, which reflects the fact that the model spectra are not sensitive to small amounts of He. For , the rises rapidly to large values. In several stars, there is a minimum around . Our model grid covers values of from to 20 but only the lower range is shown in Figure 8. For large mixing ratios of , the CIA of H2 due to collisions with He becomes extremely strong (Bergeron & Leggett, 2002), causing a severe flux depression in the near-IR that is not seen in our target stars. This drives the to very large values and leads to distorted surfaces and anomalous fitted stellar parameters. This range of mixing ratios is clearly irrelevant to our sample. When H becomes a trace element in the atmosphere (), the H2 CIA is considerably reduced and the values fall steadily to reach a low value for pure He models.
Given our method of sampling the observational uncertainties, we not only obtain distributions for and the gravity, but also of , as each set of simulated data gives its own minimum value of . This allows a determination of the significance of the minima seen in Figure 8 and to estimate the uncertainty on the He/H ratio. The standard deviation of the distribution for each value of is shown as an error bar in Figure 8. We consider that differences in that are less than are not significant and that the corresponding fits are not distinguishable given the observational uncertainties. Specifically, for two He/H ratios and with dispersions and , if
| (3) |
we consider the two values to be equally probable. For example, in the case of WD 0230144 in Figure 8, it is not until that rises far enough above the value of (pure H model) to be distinguishable based on this criterion. Thus, we find an upper limit of to the helium abundance in the atmosphere of this star. Table 4 gives the He/H ratio that corresponds to the lowest , the corresponding values of and (technically the best fitting values) as well as the range of composition allowed by the uncertainties in the data, rounded off to the nearest 0.1 dex.
Most studies of the SEDs of very cool white dwarfs of spectral types DA and DC have assumed either pure H or pure He composition. If we restrict our analysis to the optical and near-IR fluxes, as in many previous studies, we find that one star in our sample (WD 0230144) is fitted equally well by a pure H and a pure He model. The pure He solution is significantly different, however, with lower by 247 K and a gravity that is 0.18 dex lower. For all the other stars, fits with pure H () models always have a lower but for four stars (WD 0357+081, WD 0657+320, WD 1444174 and WD 1820+609), the pure He models fits are equally good given the above criterion (Equation 3). This is consistent with the photometric fits shown in Giammichele, Bergeron & Dufour (2012) for these stars, in particular for WD 1820+609 where their pure H and pure He models appear to fit the fluxes equally well. In this case, as in many others, the presence of a weak H line indicates a star with a H-rich composition, thus lifting the ambiguity in the solution obtained by fitting the photometric fluxes. We note that Giammichele, Bergeron & Dufour (2012) found all eight stars in our sample to have a pure H composition.
On the other hand, our fits of the full complement of photometric measurements clearly show that a pure H composition provides a far better fit than a pure He composition for the eight stars in our sample. Thus we conclude that none have atmospheres of a pure or dominant He composition, including the three stars of spectral type DC. Not surprisingly, we further find that for fits based only on the optical and near-IR photometry (), the sensitivity of the on the He/H ratio is much weaker compared to that shown in Figure 8 and generally weaker constraints on the composition (higher upper limits) are found. This emphasizes the value of a wide wavelength coverage that includes the near-UV an the mid-IR for the analysis of the SED and the determination of the atmospheric composition in particular. A broad wavelength coverage is especially valuable for the DC stars that do not show any Balmer lines or for stars without H spectroscopy.
In general, fits involving more free parameters tend to match data more closely and thus to reduce the . It would not be surprising then that our fitting procedure which, in addition to the usual and , considers as a free parameter would result in all of our stars containing some amount of He. The implication would be that 1) they do indeed have atmospheres of mixed composition, 2) that adding some He compensates for either some inadequacy in the constitutive physics of the models or systematic errors in the photometry (such as the absolute calibration across the SED), or 3) a combination of the above. Notwithstanding these general considerations, including the He/H ratio as a free parameter is not merely a numerical exercise because the model fits are strongly constrained by the wide wavelength coverage of our data. The addition of He to a hydrogen atmosphere affects the modeled SED in specific ways that do not necessarily correct the limitations in the models and the data. It is thus very different from performing least-squares fits of data with polynomials, for example, where higher order polynomials invariably produce fits with lower . Our eight stars show a range of behavior in as a function of composition that builds confidence in the validity of the He/H ratios we derive. For WD 0230144, WD 0357+081 and WD 1444174, is constant or increases steadily as increases (Figure 8). In these three cases, adding He does not improve the fit to the data, the best fits are obtained for a pure H composition and we are able to set upper limits to the He abundance. Three stars ( WD 0657+320, WD 1820+609 and WD 2054050) show a very shallow minimum for that is not significant and we set upper limits on the He/H ratio for these stars. Finally, both stars in the pair WD 0747+073AB show clear minima in . The most extreme case is WD 0747+073B whose is reduced by nearly a factor of 2 when going from a pure H composition to .
4.3 Best fits of the spectral energy distributions
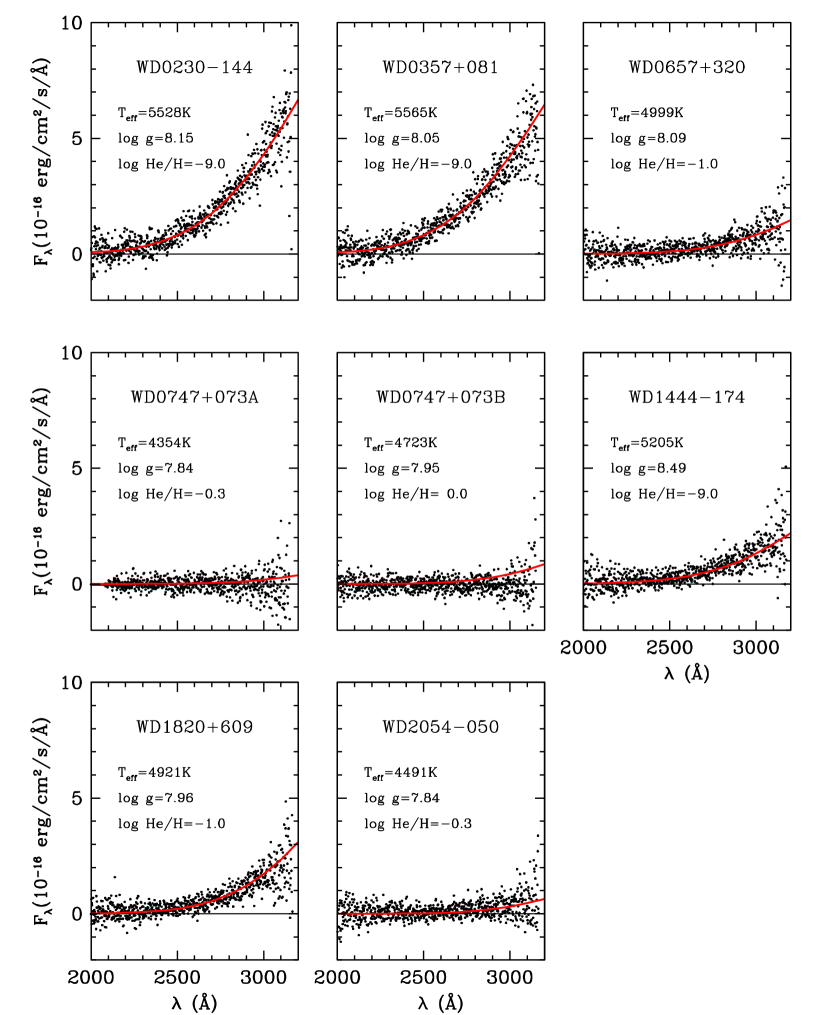
So far we have determined the best values (with uncertainties) of and of the gravity as well as obtained upper limits, and in one case, a limited range of values for the He/H ratio (Table 4). The model SEDs giving the lowest (boldfaced entries in Table 4) are shown for each star in Figure 5. The residuals of each fit are shown scaled to the uncertainty of each photometric measurement. A comparison of those same models with the STIS spectra is shown in Figure 7. We discuss each star individually before discussing trends and drawing conclusions. The relatively recent studies of Kilic et al. (2009a) and Giammichele, Bergeron & Dufour (2012) have analyzed our target stars with the photometric method and models that include the Ly line profiles of Kowalski & Saumon (2006). In the following discussion we compare our results for individual stars with theirs as appropriate.
4.3.1 WD 0230144
At K, this DA is at the upper limit of in our sample and is remarkably well-fitted by a pure H model (). Eleven of the 14 bandpasses are fitted within their error bars. In particular, the STIS fluxes are fitted very well. Our is slightly higher than that determined by Giammichele, Bergeron & Dufour (2012) (5477 K). While a pure H composition provides the best fit of this star, we find that concentrations of up to are allowed by the photometry. At this upper limit of the He abundance the effective temperature would be 5612 K.
4.3.2 WD 0357081
This star is slightly hotter than WD 0230144, with K (Giammichele, Bergeron & Dufour (2012) find a nearly identical 5578 K). The fit is also excellent, with 7 bands fitted within and the worst mismatch is for the STIS3 flux at . Considered together, the STIS fluxes are reproduced very well. The SED of this DA is best reproduced by a pure H model but we find that He abundances of up to are allowed by the uncertainties, which would drive up to 5633 K.
4.3.3 WD 0657320
Formally, the best fit of the SED of this DA is obtained for a He abundance of () but a pure H model gives a fit that is essentially just as good (, see Figure 8). At K, (Giammichele, Bergeron & Dufour (2012) find K), this star is cooler than the previous two and the overall fit is not quite as good. Seven of the fourteen fluxes are fitted within and the outliers are the flux () and the IRAC [3.6] flux (). The STIS fluxes are reproduced by the model to better than . We find an upper limit on the He abundance of .
4.3.4 WD 0747073A
This is the faintest and coolest star in our sample. As discussed in §2.2, we strongly suspect that this star was not properly acquired in the slit of the STIS instrument. Additional evidence comes from our fits of the SED including the upper limits in the STIS fluxes. The best fitting model matches the STIS1 upper limit but overestimates the STIS2 and STIS3 upper limits by factors of 3 and 2.6, respectively. This models (K, , ) predicts STIS2 ands STIS3 fluxes that are about half of those of the best fitting model for WD 2054050 (see below), which should have been easily detected in view of the 11 and 6.3 signals for the latter. Thus, unless the near-UV flux of WD 0747+073A is strongly suppressed by an unidentified absorber, our analysis is consistent with our empirical arguments for having observed blank sky.
Excluding the upper limits for the three STIS bandpasses from the analysis of WD 0747073A, we find that the fit of the and IRAC fluxes with pure H models is distinctly worse than for the three previous stars. Allowing for a mixed composition clearly improves the quality of the fit as it reduces the from 5.4 to 2.8. The best match to the data is found for , giving K. The well-defined minimum in the (Figure 8) leads to a determination of the helium abundance of . Figure 9 shows the best fitting models with pure H composition and with . The pure H model (open circles) underestimates the flux by and overestimates the IRAC [3.6], [4.5], and [5.8] fluxes significantly (up to ). The addition of helium to the model improves the optical region of the fit significantly, as well as the first three IRAC fluxes. It also increases the H2 CIA absorption in the near-IR, improving the match with the flux while becoming too strong in the band, however. Giammichele, Bergeron & Dufour (2012) find no trace of H absorption in the spectrum of this star, which is consistent with both our proposed solution with a mixed composition and their best fit with a low- model of pure H composition. Kilic et al. (2009a) also find a pure H composition for this star on the basis of the and IRAC fluxes. As both Giammichele, Bergeron & Dufour (2012) and Kilic et al. (2009a) include the Ly profiles of Kowalski & Saumon (2006), the principal difference between the models of these two studies and those used here is our updated H2-He CIA opacity (Abel et al., 2012) which may very well explain why we obtain a better fit with a mixed He/H composition.
4.3.5 WD 0747073B
This star is brighter than its companion WD 0747073A in all bands and published analyses consistently find that it is hotter by a few hundred degrees. Like its companion, this star was undetected in the STIS observations. If we include the upper limits on the STIS fluxes in the analysis, we obtain a rather poor fit with for a model with a mixed He/H atmosphere with . As for WD 0747+073A, the STIS upper limits are systematically overestimated by 2.0, 6.4 and 4.3, respectively, and the near-UV fluxes predicted by the best fitting model SED should have been readily detectable. WD 0747+073B present the same situation as its dimmer companion and we discard the upper limits on the STIS fluxes for the same reasons. Fitting the eleven remaining bandpasses, a pure H model reproduces the SED reasonably well, with . The and fluxes are poorly matched however, with the model deviating from the data by and , respectively. Increasing the He abundance improves the fit in nearly every band (Figure 10) and the lowest is obtained for , with a of 4723 K and a lower gravity of . The latter values are close to those reported by Giammichele, Bergeron & Dufour (2012). The relatively high He abundance causes the H2 CIA to be too strong in the band however. The minimum in (Figure 8) gives an allowed range of using the criterion given by Equation 3. If this criterion is relaxed slightly, even a pure H model gives an acceptable fit within the uncertainties (Table 4 and Figure 10). The presence of a significant amount of helium in this star’s atmosphere is consistent with the extremely weak H detection shown in Giammichele, Bergeron & Dufour (2012). Fitting the and IRAC fluxes, Kilic et al. (2009a) found K, and , which is in excellent agreement with our result.
4.3.6 WD 1444174
This is the highest gravity star in our sample () and its SED is very well reproduced by a pure H model except for the filter where the model overestimates the observed flux by a spectacular . The other model fluxes agree with the data to within in nearly all bands (Figure 5), with particularly good matches of the neighboring STIS1 and fluxes. The for this star increases steadily with the He fraction (Figure 8). A pure H composition is thus favored with K. The large mismatch of the flux is rather puzzling. The adopted flux (Table 2) combines two measurements and agrees within with the value used by Giammichele, Bergeron & Dufour (2012). If we exclude the band from the fit, pure H models give essentially the same result. On the other hand, if we exclude the STIS data and fit all the other bands (including ), decreases substantially to 5043 K with pure H models, and the best fit is obtained for at K and a reduced gravity of . The latter values are in good agreement with those of Giammichele, Bergeron & Dufour (2012) for a pure H model. From these experiments, we conclude that the STIS data drive the fit to high . Since there is no reason to suspect that the STIS and fluxes for this star are erroneous, there remains the possibility that the Ly profile is too weak in the very far wing probed by the bandpass. While this is the highest gravity star in our sample, it does not stand out in terms of the physical conditions at the photosphere. The photospheric density of the model is rather typical for these stars and comparable to that of the pure H model that gives a good fit of WD 1820609 (see below). It is difficult to understand how a model that works quite well (see §5) would do poorly in this particular instance. Nonetheless, the overall fit of the SED of WD 1444174 is quite reasonable (Figure 5).
Ignoring the difficulty fitting the flux, we find an upper limit of for this star, with a corresponding K. Fitting the and IRAC fluxes, Kilic et al. (2009a) report a much lower K and that the SED is best matched with a mixed composition of , which is well above our upper limit. The spectrum of WD 1444174 shown in Giammichele, Bergeron & Dufour (2012) shows no trace of H absorption, while their model for the comparable star WD 0552041 (K, , pure H composition) shows a very weak line. The absence of the line in WD 1444174 could be caused by the presence of He which would broaden the line into invisibility. This suggests that the atmosphere of WD 1444174 has a mixed composition closer to our upper limit of He/H than to pure hydrogen. On the other hand, the lack of H is easily accommodated if is lowered as reported in Giammichele, Bergeron & Dufour (2012) and Kilic et al. (2009a).
4.3.7 WD 1820609
A pure H model provides a reasonable fit to the SED of this star, with , but it misses the STIS1 flux (), the STIS3 flux (3.1), and the flux (). While the slope of the model SED is slightly steeper than that of the data in the near-UV, the overall behavior of the STIS data is reproduced very well (Fig. 7). Adding He to the model barely improves the fit. The formally best fit is obtained for (Figure 5, for which the agreement with the data is slightly better in every band. An upper limit of can be placed on this star. Interestingly, its and gravity are barely affected by including the near-UV and the mid-IR data in the analysis or by adding He. Our and gravity for this star (K, ) are essentially identical to those of Giammichele, Bergeron & Dufour (2012) and Kilic et al. (2009a).
4.3.8 WD 2054050
This is the second coolest and the lowest gravity star in our sample with K and – similar to those of WD 0747+073A (Table 4). As we found for WD 1444174, including the near-UV and mid-IR fluxes in the analysis of WD 2054050 significantly increases (+160 K) and the gravity (+0.19 dex) while assuming a pure H composition. This pure H fit is of modest quality, matching 6 of the 14 bands within , but missing the and overestimating all four IRAC fluxes, especially the [3.6] band. However, the IRAC photometry of this star is likely contaminated by a nearby bright star (Kilic et al., 2009a). The STIS fluxes are all reproduced with . A marginally better fit is obtained for (Figure 5) which brings the model into much better agreement with the data in the , and IRAC [3.6] and [4.5] bandpasses, but at the cost of spoiling the match with the STIS1 and STIS2 fluxes by steepening the slope of the model in the near-UV. The H2 CIA absorption becomes too strong at this helium abundance and the flux is clearly too low. While our upper limit on the He abundance is fairly high at , a pure H or H-dominated composition (He/H ) is more likely (with K and ), given the uncertain IRAC fluxes. At this low , the absence of the H line in this DC star is consistent with both a pure H composition (Giammichele, Bergeron & Dufour, 2012) and our upper limit of .
To summarize, we find that we can obtain good to excellent fits of our target stars over their full SEDs, from 0.24 to 9.3m. The extension of the fits to the near-UV with the STIS observations strongly constrain the models. We are able to provide realistic upper limits on the He/H ratio in the atmospheres, which are typically .
The pair of stars WD 0747+074AB stands out from the rest of the sample. Unexpectedly, neither was detected with STIS and our models fit the corresponding flux upper limits poorly. We have presented theoretical and empirical evidence that the non-detection is most likely due to a failure to acquire those two targets in the STIS aperture. An alternate explanation could be that both stars in this pair have peculiar atmospheres with another near-UV absorber in addition to the red wing of Ly. Since component A is a DC and the component B a DA with extremely weak H (Giammichele, Bergeron & Dufour, 2012), there is no direct evidence for the presence of any element other than H and He in their atmospheres. The fact that we obtain good fits of their SEDs when we exclude the STIS upper limits suggests that neither star is particularly unusual. While the lack of STIS data for these two stars is unfortunate, we were able to perform our analysis with the 11 remaining bandpasses and found good evidence that WD 0747+073A has a mixed He/H atmosphere and is thus the most interesting star in our sample.
5 Discussion
Our primary goal was to apply a stringent test to the opacity models for the red wing of the Ly line of Kowalski & Saumon (2006) in very cool hydrogen-rich WDs. HST STIS spectroscopy probes the steeply rising near-UV spectrum that is a combination of the Ly profile and the Wien tail of the SED at these very low . This steep slope provides a sensitive test of the theory. By choosing stars for which the SED is already very well characterized from the optical to the mid-IR and with known distances, we strongly constrained the range of and gravity that could accommodate our new data. For five of the six stars with STIS data, our fits of the entire SED are good to excellent matches of the blue and near-UV spectral range. However, the model has difficulty simultaneously matching STIS fluxes of WD 1444174 and its flux. Overall, this constitute very strong evidence that this absorption mechanism is indeed the “missing blue opacity” of earlier models (Bergeron, Ruiz & Leggett, 1997) and that the model for the broadening – primarily involving collisions with H2 – is on a firm quantitative basis even though there is evidence that a refined theoretical model could be even more successful. Earlier analyses of the SEDs of very cool WDs that use the Kowalski & Saumon (2006) Ly profile (Kowalski & Saumon, 2006; Kilic et al., 2009a, b; Giammichele, Bergeron & Dufour, 2012) further support this conclusion. The validation of this opacity model is important as it directly affects the determination of the ages of globular clusters from their WD sequence (Kowalski, 2007), for example.
The overall quality of the fits of the full SEDs is not uniform and ranges from excellent to satisfactory. While we cannot reliably identify trends from a sample of eight stars, we note that the fits tend to become worse at lower and higher gravity. These are the stars with higher photospheric densities and more extreme physical conditions. This suggests that models of the microscopic physics of dense matter should be further refined. In particular, we found that to match the near-UV fluxes of some stars the presence of helium was necessary but the corresponding increase in the strength of the H2 CIA in the near-IR is larger than what is allowed by the data. This tension between the Ly line wing and the CIA absorption indicates that one or perhaps both mechanisms are responsible for the mismatch. For example, the static broadening model of Kowalski & Saumon (2006) could be improved by considering dynamic collisions (Allard & Kielkopf, 2009) or more accurate potential and dipole surfaces for the H-H2 system during a collision. Another possibility is the corresponding “Ly” absorption from a H2 molecule between its electronic ground state and its first electronic excited state, which is not accounted for in the Kowalski & Saumon (2006) model. This process could become important at low where hydrogen is mostly recombined into H2 molecules and the atomic Ly line would disappear. The calculation of the H2-He CIA has recently been completely revised (Abel & Frommhold, 2012) but a comparable update of H2-H2 CIA in the regime of WD atmospheres is still in progress (M. Abel, pers. comm.). In the relatively dense atmospheres that have He/H , CIA from triple collisions (e.g. H2-H2-He, H2-He-He) may play a role but is completely unexplored in the relevant conditions. These limitations in the current models must introduce systematic biases in the determination of , and the composition that are nearly impossible to quantify, unfortunately.
Most determinations of the parameters of cool white dwarfs with the photometric method employed here are based on optical and near-IR fluxes and achieve typical uncertainties in of K (Kilic et al., 2010a; Giammichele, Bergeron & Dufour, 2012). For example, Giammichele, Bergeron & Dufour (2012) find an average uncertainty of K for the stars in our sample. By extending the measured SEDs of our targets in the near-UV with the HST STIS data and including the mid-IR IRAC fluxes, we very effectively constrain the model fits with a considerably reduced uncertainty averaging K (Table 4). Excluding the STIS fluxes typically doubles the uncertainty. As we discussed earlier, the gravity of these stars is primarily determined by the parallax and our determinations are close to those of previous studies that used the same parallaxes (Table 1). Compared to Giammichele, Bergeron & Dufour (2012), the average gravity of our sample is higher by 0.04 dex but agrees perfectly with that of Kilic et al. (2009a). On the other hand, our uncertainties are identical for each star as they are dominated by the parallax uncertainties. Much more precise determinations of the gravity and of the bolometric luminosity as well will come from the Gaia mission, which will be able to measure the parallaxes of WDs to 1% accuracy (Carrasco et al., 2014). For relatively bright, nearby WDs such as those in our sample, a much higher precision of as is anticipated, or about 0.1% 555http://www.cosmos.esa.int/web/gaia/science-performance, compared to the current 1.3 - 7.1% (Table 1). However, experimentation with our fits reveal that the uncertainty on the gravity becomes dominated by the photometric uncertainties when is reduced by a factor of from the current values (i.e. to %) leading to . More accurate gravities will then require more precise photometry. For the few stars where the and distributions are correlated (unlike WD 1444174 shown in Figure 2) more precise parallaxes also lead to more precise . The ground-based photometry used in this paper is characterized by uncertainties on the order of 0.03 magnitudes, a common standard for most photometric observations. Fortunately, future prospects for routinely improving ground-based photometry are bright. The Large Synoptic Sky Survey (LSST) is designed to cover half the sky from the southern hemisphere in the bands666http://www.lsst.org/lsst/scibook. Its design goals are 1% absolute and 0.5% relative photometry. Of particular interest here is the band which would cover much of Johnson band that had to be abandoned in this analysis as unreliable and the availability of the flux would help better characterize the SEDs in the far-red. The combination of the Gaia and LSST high precision data for nearby, very cool WDs would reduce the uncertainty in by a factor of 2–3 and to dex in . Such data will highlight the limitations of the models and challenge the theoretical description of the microphysics of WD atmospheres.
The atmospheric composition of cool WDs is of central importance in the context of their spectral evolution. White dwarfs that have a hydrogen surface layer at high K can become He-dominated at lower because of convective mixing with the underlying He layer that is at least times more massive (D’Antona & Mazzitelli, 1979; Fontaine & Wesemael, 1997). The depth of the surface hydrogen convection zone increases rapidly at K and again for K to bottom out around 5000 K (see for example Figure 1 of Tremblay & Bergeron (2008)). Evolution models predict that at its deepest extent, the H convective zone amounts to of the mass of a typical WD of (Fontaine, Brassard & Bergeron, 2001). Thus, DA white dwarfs with a hydrogen layer thinner than are expected to become He dominated with He/H before they cool below K. According to this convective mixing mechanism, stars with thicker layers never mix and retain a H-rich atmosphere throughout their low- cooling, turning into H-rich DC stars below K. There is strong empirical evidence supporting this convective mixing process, with an estimated % of DA having hydrogen layers thin enough to mix convectively with helium (Tremblay & Bergeron, 2008; Giammichele, Bergeron & Dufour, 2012).
Most very cool WDs have atmospheres dominated by either H (spectral types DA and DC) or He (spectral types DZ, DQ, DQpec and DC). Kowalski & Saumon (2006) found that very few, if any, very cool WDs (K) of types DC have helium-rich atmospheres. If we exclude the ultracool WDs that are very poorly understood, few studies of very cool DA and DC white dwarfs with the photometric method have considered models of mixed composition. In their analysis of and IRAC photometry of 43 DA and DC WDs (including all of our targets), Kilic et al. (2009a) found 11 stars that were better fitted with mixed atmospheres with ( to 0.3) but did not provide uncertainties on the fitted parameters. This study is the most comparable to ours as it uses a broad coverage of the SED (but no near-UV data) and similar model spectra including the Ly profiles of Kowalski & Saumon (2006). In a subsequent study based on a large sample of new very cool WDs discovered in the SDSS, Kilic et al. (2010a) fitted photometry and H spectroscopy with models that did not include the Ly absorption and without the benefit of parallaxes. They considered mixed He/H composition only for stars that showed large near-IR flux deficits, which typically are caused by strong H2–He CIA. This approach tends to restrict the determination of mixed He/H composition to ultracool WDs, and indeed, they find only one among their subset of DA and DC stars with and 17 others with very high He abundances of – 6.
The determination of the He abundance in a very cool DA or DC star is rather challenging as their SED is rather insensitive to the presence of small amounts of He. For instance, the difference in flux between a pure H model and one with is at most 0.4% at K (with ) and grows to 1.1% at 5000 K. Only for K do the calculated SEDs depart from each other noticeably, by % in the near-IR. Given that typical photometric uncertainties in the optical and near-IR are –5%, it becomes clear that the photometric method of analysis is insensitive to He abundance of He/H , except for the coolest stars. Furthermore, there is evidence that small systematic shifts between the calibrations of the optical and near-IR photometry of cool white dwarfs remain (P. Bergeron, priv. comm.) that could affect determinations of the He/H ratio. Better constraints will require significantly more precise and accurate photometry 777For very cool DA with known parallaxes however, it may be possible to complement the photometric method with an analysis of the weak H to constrain the He abundance, but not for DC stars, of course. as well as improvements in the models. Our method of analysis allows for the first time the determination of upper limits on the abundance of He in stars with H-rich atmospheres and provide error bars for the one star where the atmosphere is of mixed composition. In all but one star, we found that a pure H composition provided a fit that is statistically equivalent to the best fit composition. For these stars the upper limits on the helium abundance ranges from to 0.2. These He/H ratios of order unity are consistent with the overall results of Kilic et al. (2009a). The most interesting star in our sample is the DC WD 0747+073A for which we find that a pure H model is not compatible with the data and we can constrain the helium abundance to . At K, this is the coolest star in our sample and we would expect that the photometric method would be sensitive to the He/H ratio. Thus, our detailed analysis is consistent with earlier studies that found that some very cool WDs of type DC can have mixed He/H atmospheric composition with He/H . This is unlike the ultracool WDs that have ratios estimated to be – (Kilic et al., 2010a) or the DZ stars whose atmospheres are dominated by He with traces of metals and He/H (Dufour et al., 2007). Moderate He/H ratios are unexpected in the context of the convective mixing scenario where the H layer eventually mixes and become dominated by helium (He/H ) or the H layer is so thick that mixing never occurs and a pure H surface composition persists. Perhaps WD 0747+073A is a rare example of a star with an initially He-rich atmosphere that has been moderately enriched in H by accretion from the interstellar medium (Tremblay et al., 2014).
The WD cooling ages of our stars based on the best fit parameters (Table 4) and the evolution sequences of Fontaine, Brassard & Bergeron (2001) (with a H surface layer of ) range from 3.4 to 8.1 Gyr and are generally very close to those of Giammichele, Bergeron & Dufour (2012) and well within the error bars. We find that the formal uncertainty on the age is dominated by the uncertainty in the gravity for all of our stars. Two stars merit further discussion. For WD 1444174, the effects of our larger gravity and larger largely compensate each other for a net decrease in the cooling age of 0.5 Gyr. Only for WD 2054050 is there a noticeable change in age, which increases from 4.3 to 5.9 Gyr which is just within the uncertainties. As much as can be ascertained from this small sample and considering their relatively large uncertainties, the ages of very cool hydrogen-rich disk white dwarfs in the range of – 6000 K are not biased by using and gravities derived from optical and near-IR photometry only.
References
- Abel & Frommhold (2012) Abel, M. & Frommhold, L. 2013, Can. J. Phys., 91, 857
- Abel et al. (2012) Abel, M.A., Frommhold, L., Li, X., Hunt, K.L.C. 2012, J. Chem. Phys., 136, 044319
- Allard & Kielkopf (2009) Allard, N.F. & Kielkopf, J.F. 2009, A&A, 493, 1155
- Bergeron & Leggett (2002) Bergeron, P. & Leggett, S.K. 2002, ApJ, 580, 1070
- Bergeron, Leggett & Ruiz (2001) Bergeron, P., Leggett, S.K. & Ruiz, M.T. 2001, ApJS, 133, 413
- Bergeron, Ruiz & Leggett (1997) Bergeron, P., Ruiz, M.T., & Leggett, S.K. 1997, ApJS, 108, 339
- Bergeron, Saffer & Liebert (1992) Bergeron, P., Saffer, R.A. & Liebert, J. 1992, ApJ, 394, 228
- Bergeron, Saumon & Wesemael (1995) Bergeron, P., Saumon, D. & Wesemael, F. 1995, ApJ, 443, 764
- Bergeron, Wesemael & Fontaine (1991) Bergeron, P., Wesemael, F. & Fontaine, G. 1991, ApJ, 367, 253
- Cohen et al. (2003a) Cohen, M., Megeath, S.T., Hammersley, P.L., Martín-Luis, F. & Stauffer, J. 2003a, AJ, 125, 2645
- Carrasco et al. (2014) Carrasco, J.M., Catalán, S., Jordi, C., Tremblay, P.-E., Napiwotzki, R. Luri, X., Robin, A.C. & Kowalski, P.M. 2014, A&A, 565, 11
- Cohen, Wheaton & Megeath (2003b) Cohen, M., Wheaton, Wm. A. & Megeath, S.T. 2003b, AJ, 126, 1090
- Dahn et al. (1988) Dahn, C.C., Harrington, R.S., Kallarakal, V.V., Guetter, H.H., Luginbuhl, C.B., Riepe, B.Y., Walker, R.L., Pier, J.R. Vrba, F.J., Monet, D.G. & Ables, H.D. 1988, AJ, 95, 237
- Dahn et al. (1982) Dahn, C.C., Harrington, R.S., Riepe, B.Y., Christy, J.W., Guetter, H.H., Kallarakal, V.V., Miranian, M., Walker, R.L., Vrba, F.J., Hewitt, A.V., Durham, W.S. & Ables, H.D. 1982, AJ, 87, 419
- D’Antona & Mazzitelli (1979) D’Antona, F. & Mazzitelli, I., 1979, A&A, 74, 161
- Dufour et al. (2007) Dufour, P., Bergeron, P., Liebert, J., Harris, H.C., Knapp, G.R., Anderson, S.F., Hall, P.B., Strauss, M.A., Collinge, M.J. & Edwards, M.C. 2007, ApJ, 663, 1291
- Durant et al. (2012) Durant, M., Kargaltsev, O., Pavlov, G.G., Kowalski, P. M., Posselt, B., van Kerwijk, M. H., & Kaplan, D. L. 2012, ApJ, 746, 6 Astrophys. Spa. Sci. Lib., 214, 173
- Eggen & Greenstein (1967) Eggen, O.J. & Greenstein, J.L. 1967, ApJ, 150, 927
- Falcon et al. (2013) Falcon, R.E., Rochau, G.A., Bailey, J.E., Carlson, A.L., Gomez, T.A., Montgomery, M.H., Winget, D.E., Chen, E.Y., Gomez, M.R. & Nash, T.F. 2013, High. Ener. Dens. Phys., 9, 82
- Fazio et al. (2004) Fazio, G.G. et al. 2004, ApJS, 154, 10
- Fontaine, Brassard & Bergeron (2001) Fontaine, G., Brassard, P. & Bergeron, P., 2001, PASP, 113, 409
- Fontaine & Wesemael (1997) Fontaine, G. & Wesemael, F., 1997, in Proc. European Workshop on White Dwarfs, Astrophys. Spa. Sci. Lib., Vol. 214, Ed. J. Isern, M. Hernanz, E. Gracia-Berro, p173
- Gates et al. (2004) Gates, E. et al. 2004, ApJ, 612, 129
- Giammichele, Bergeron & Dufour (2012) Giammichele, N., Bergeron, P. & Dufour, P. 2012, ApJS, 199, 29
- Hall et al. (2008) Hall, P. B., Kowalski, P. M., Harris, H. C., Awal, A., Leggett, S. K., Kilic, M., Anderson, S. F. & Gates, E. 2008, AJ, 136, 76
- Hansen et al. (2007) Hansen, B.M.S., Anderson, J., Brewer, J., Dotter, A., Fahlman, G.G., Hurley, J., Kalirai, J., King, I.R., Reitzel, D., Richer, H.B., Rich, R.M., Shara, M.M. & Stetson, P.B. 2007, ApJ, 671, 380
- Hansen et al. (2013) Hansen, B.M.S., Kalirai, J.S., Anderson, J., Dotter, A., Richer, H.B., Rich, R.M., Shara, M.M., Fahlman, G.G., Hurley, J., King, I.R., Reitzel, D., & Stetson, P.B. 2013, Nature, 500, 51
- Hansen et al. (2004) Hansen, B.M.S., Richer, H.B., Fahlman, G.G., Stetson, P.B., Brewer, J., Currie, T., Gibson, B.K., Ibata, R., Rich, R.M. & Shara, M.M. 2004, ApJS, 155, 551
- Harrington et al. (1993) Harrington, R.S., Dahn, C.C., Kallarakal, V.V., Guetter, H.H., Riepe, B.Y., Walker, R.L., Pier, J.R., Vrba, F.J., Luginbuhl, C.B., Harris, H.C. & Ables, H.D. 1993, AJ, 105, 1571
- Harris et al. (2006) Harris, H.C. et al. 2006, AJ, 131, 571
- Harris et al. (2008) Harris, H.C. et al. 2008, ApJ, 679, 697
- Hernandez et al. (2014) Hernandez, S. et al. 2014, “STIS Instrument Handbook”, Version 13.0 (Baltimore: STScI)
- Holberg & Bergeron (2006) Holberg, J.B. & Bergeron, P. 2006, AJ, 132, 1221
- Iglesias et al. (2001) Iglesias, C. A., Forrest, R. J. and Saumon, D. 2002, ApJ, 569, 111
- Jeffery et al. (2011) Jeffery, E.J., von Hippel, T., DeGennaro, S., van Dyk, D.A., Stein, N., & Jefferys, W.H. 2011, ApJ, 730, 35
- Kilic et al. (2006) Kilic, M., et al. 2006, AJ, 131, 582
- Kilic et al. (2008) Kilic, M., Kowalski, P.M., Mullally, F., Reach, W. T. & von Hippel, T. 2008, ApJ, 678, 1298
- Kilic et al. (2009a) Kilic, M., Kowalski, P.M., Reach, W.T. & von Hippel, T. 2009a, ApJ, 696, 2094
- Kilic et al. (2009b) Kilic, M., Kowalski, P.M. & von Hippel, T. 2009b, AJ, 138, 102
- Kilic et al. (2010a) Kilic, M., Leggett, S.K., Tremblay, P.-E., von Hippel, T., Bergeron, P., Harris, H.C., Munn, J.A., Williams, K.A., Gates, E. & Fahiri, J. 2010a, ApJS, 190, 77
- Kilic et al. (2010b) Kilic, M., Munn, J. A., Williams, K. A., Kowalski, P. M., von Hippel, T., Harris, H. C., Jeffery, E. J., DeGennaro, S., Brown, W. R. & McLeod, B. 2010b, ApJ, 715, 21
- Kilic et al. (2012) Kilic, M., Thorstensen, J. R., Kowalski, P. M. & Andrews, J. 2012, MNRAS, 423, L132
- Kowalski (2006a) Kowalski, P.M. 2006, ApJ, 641, 488
- Kowalski (2006b) Kowalski, P.M. 2006, ApJ, 651, 1120
- Kowalski (2007) Kowalski, P.M. 2007, A&A, 474, 491
- Kowalski (2010) Kowalski, P. M. 2010, 17th European White Dwarf Workshop, AIP Conf. Proc., Vol. 1273, K. Werner & T. Raush, Eds., 424
- Kowalski et al. (2007) Kowalski, P.M., Mazevet, S., Saumon, D. & Challacombe, M. 2007, Phys. Rev. B, 76, 075112
- Kowalski & Saumon (2004) Kowalski, P.M. & Saumon, D. 2004, ApJ, 607, 970
- Kowalski & Saumon (2006) Kowalski, P.M. & Saumon, D. 2006, ApJ, 651, L137
- Leggett, Ruiz & Bergeron (1998) Leggett, S.K., Ruiz, M.T. & Bergeron, P. 1998, ApJ, 497, 294
- Liebert et al. (1979) Liebert, J., Dahn, C.C., Gresham, M. & Strittmatter, P.A. 1979, ApJ, 233, 226
- Liebert, Dahn & Monet (1988) Liebert, J., Dahn, C.C., & Monet, D.G. 1998, ApJ, 332, 891
- Liebert, Dahn & Sion (1983) Liebert, J., Dahn, C.C., & Sion, E.M. 1983, in IAU Colloq. 76, The Nearby Stars and The Stellar Luminosity Function, Ed. A.G.D. Phillips,(Dordrecht: Reidel), p.103
- Liebert & Wehrse (1983) Liebert, J. & Wehrse, R. 1983, A&A, 122, 297
- Monet et al. (1992) Monet, D.G., Dahn, C.C., Vrba, F.J., Harris, H.C., Pier, J.R., Luginbuhl, C.B., & Ables, H.D. 1992, AJ, 103, 638
- Perryman et al. (2001) Perryman, M.A.C., de Boer, K.S., Hog, E., Lattanzi, M.G., Lindegren, L., Luri, X., Mignard, F., Pace, O. & de Zeeuw, P.T. 2001, A&A, 369, 339
- Press et al. (1986) Press, W.H., Flannery, B.P., Teukolsky, S.A. & Vetterling, W.T. 1986, Numerical Recipes (Cambridge: Cambridge Univ. Press)
- Rohrmann, Althaus & Kepler (2011) Rohrmann, R.D., Althaus, L.G. & Kepler, S.O. 2011, MNRAS, 411, 781
- Skrutskie et al. (2006) Skrutskie et al. 2006, AJ, 131, 1163
- Tremblay & Bergeron (2007) Tremblay, P.-E. & Bergeron, P. 2007, ApJ, 657, 1013
- Tremblay & Bergeron (2008) Tremblay, P.-E. & Bergeron, P. 2008, ApJ, 672, 1144
- Tremblay et al. (2010) Tremblay, P.-E., Bergeron, P., Kalirai, J.S. & Gianninas, A. 2010, ApJ, 712, 1345
- Tremblay et al. (2014) Tremblay, P.-E., Leggett, S.K., Lodieu, N., Freytag, B., Bergeron, P., Kalirai, J.S. & Ludwig, H.-G. 2014, ApJ, 788, 103
- van Altena, Lee & Hoffleit (1995) van Altena, W.F., Lee, J.T. & Hoffleit, E.D. 1995, The General Catalogue of Trigonometric Parallaxes, 4th Ed. (New Haven, CT: Yale Univers. Obs.)
- van Leeuwen (2007) van Leeuwen, F., 2007, Hipparcos, the New Reduction of the Raw Data, Astrophys. Space Sci. Library, Vol. 350 (Berlin: Springer)
- von Hippel (2005) von Hippel, T. 2005, ApJ, 622, 565
- Wehrse (1977) Wehrse, R. 1977, Mem. Soc. Astron. Italiana, 48, 13
- Winget et al. (1987) Winget, D.E., Hansen, C.J., Liebert, J., Van Horn, H.M., Fontaine, G., Nather, R.E., Kepler, S.O. & Lamb, D.Q. 1987, ApJ, 315, 77
- Wolff, Koester & Liebert (2002) Wolff, B., Koester, D. & Liebert, J. 2002, A&A, 385, 995
- Wood (1992) Wood, M.A. 1992, ApJ, 386, 539
- York et al. (2000) York, D.G. et al. 2000, AJ, 120, 1579


| WD | GJ | Spectral | STIS1 | STIS2 | STIS3 | Ref.bbSources of Parallaxes: 1. van Altena, Lee & Hoffleit (1995), 2. van Leeuwen (2007). | ||
|---|---|---|---|---|---|---|---|---|
| type | (mas) | (mas) | ||||||
| 0230144 | 3162 | DA | 64.00 | 3.90 | 117.0 2.11 | 306.0 3.70 | 512.0 9.59 | 1 |
| 0357+081 | 3259 | DA | 56.10 | 3.70 | 118.0 2.21 | 301.0 3.82 | 482.0 9.80 | 1 |
| 0657+320 | 3420 | DA | 53.50 | 0.90 | 19.5 1.70 | 52.0 2.63 | 101.0 7.28 | 1 |
| 0747+073AccThe upper limits in the STIS fluxes appear to be from observations of blank sky. | 1102B | DC | 54.70 | 0.70 | 1 | |||
| 0747+073BccThe upper limits in the STIS fluxes appear to be from observations of blank sky. | 1102A | DA | 54.70 | 0.70 | 7.9 6.81 | 1 | ||
| 1444174 | 3866 | DC | 69.00 | 4.00 | 32.9 1.73 | 98.4 2.81 | 165.0 7.51 | 1 |
| 1820+609 | 4054 | DA | 78.20 | 4.10 | 38.2 1.66 | 110.0 2.73 | 192.0 7.37 | 1 |
| 2054050 | 812B | DC | 59.53 | 3.10 | 9.5 1.60 | 25.7 2.42 | 42.4 6.76 | 1, 2 |
| WD | GJ | Ref.bbSources of photometry: 1. Dahn et al. (1988), 2. Bergeron, Ruiz & Leggett (1997), 3. Liebert et al. (1979), 4. Monet et al. (1992), 5. Liebert, Dahn & Monet (1988), 6. Bergeron, Leggett & Ruiz (2001), 7. Liebert, Dahn & Sion (1983), 8. Eggen & Greenstein (1967), 9. Dahn et al. (1982), 10. Harrington et al. (1993) | ||||
|---|---|---|---|---|---|---|
| 0230144 | 3162 | 1680.0 46.40 | 1880.0 52.00 | 1670.0 46.00 | 1190.0 32.90 | 1, 2 |
| 0357+081 | 3259 | 1520.0 41.90 | 1670.0 46.10 | 1450.0 40.10 | 1050.0 29.00 | 2, 3 |
| 0657+320 | 3420 | 618.0 18.20 | 885.0 26.10 | 866.0 23.90 | 661.0 18.30 | 2, 4, 10 |
| 0747+073A | 1102B | 356.0 9.82 | 626.0 17.30 | 682.0 18.80 | 587.0 16.20 | 2 |
| 0747+073B | 1102A | 553.0 15.30 | 848.0 23.40 | 866.0 23.90 | 673.0 18.60 | 2 |
| 1444174 | 3866 | 693.0 19.20 | 991.0 27.40 | 932.0 25.80 | 738.0 20.40 | 2, 5 |
| 1820+609 | 4054 | 1450.0 40.00 | 2050.0 56.70 | 2020.0 55.80 | 1590.0 43.80 | 6, 7 |
| 2054050 | 812B | 495.0 13.70 | 840.0 23.20 | 924.0 25.50 | 832.0 23.00 | 6, 8, 9 |
| WD | GJ | [3.6] | [4.5] | [5.8] | [8.0] | |||
|---|---|---|---|---|---|---|---|---|
| 0230144 | 3162 | 491.0 13.60 | 227.0 10.00 | 91.8 5.75 | 16.870 0.527 | 6.9580 0.227 | 2.9430 0.152 | 0.865 0.089 |
| 0357+081 | 3259 | 459.0 16.10 | 210.0 10.90 | 95.1 5.00 | 14.690 0.462 | 6.1380 0.203 | 2.3340 0.147 | 0.698 0.069 |
| 0657+320 | 3420 | 298.0 10.70 | 155.0 7.15 | 57.7 4.36 | 10.150 0.323 | 4.2770 0.145 | 1.8190 0.129 | 0.631 0.083 |
| 0747+073A | 1102B | 298.0 10.20 | 126.0 9.31 | 53.5 5.29 | 9.550 0.304 | 4.0950 0.140 | 1.5410 0.130 | 0.501 0.100 |
| 0747+073B | 1102A | 316.0 11.40 | 149.0 9.19 | 59.4 5.42 | 10.900 0.345 | 4.6120 0.154 | 1.8390 0.155 | 0.517 0.076 |
| 1444174 | 3866 | 322.0 8.59 | 160.0 6.93 | 54.6 5.44 | 10.970 0.350 | 4.6970 0.158 | 2.0440 0.161 | 0.783 0.080 |
| 1820+609 | 4054 | 719.0 21.20 | 344.0 9.50 | 128.0 6.15 | 25.860 0.798 | 10.8900 0.342 | 4.4100 0.183 | 1.331 0.099 |
| 2054050 | 812B | 392.0 29.30 | 172.0 21.20 | 78.8 9.89 | 12.780 0.563 | 5.2130 0.404 | 0.9794 0.758 | 0.384 0.131 |
| WD | bbRange of He abundances that give equally good fits to the data within the uncertainties. See text. | AgeccWhite dwarf cooling age, excluding the prior phases of evolution. | |||
|---|---|---|---|---|---|
| (K) | (cm/s2) | (range) | (Gyr) | ||
| 0230144 | |||||
| 0357+081 | |||||
| 0657+320 | |||||
| 0747+073AddParameters based on fits that exclude the STIS data. See text. | |||||
| to | |||||
| 0747+073BddParameters based on fits that exclude the STIS data. See text. | |||||
| 1444174 | |||||
| 1820+609 | |||||
| 2054050 | |||||