A Divide-and-Conquer Algorithm for Betweenness Centrality ††thanks: This research was supported in part by NSF awards PFI BIC #1430145, SaTC Frontier #1414119, CPS #1239021, CNS #1012798, III #1218437, CAREER #1253393, IIS #1320542 and gifts from Google and Microsoft.
Abstract
Given a graph we define the betweenness centrality of a node in as the fraction of shortest paths between all node pairs in that contain . For this setting we describe Brandes++, a divide-and-conquer algorithm that can efficiently compute the exact values of betweenness scores. Brandes++ uses Brandes– the most widely-used algorithm for betweenness computation – as its subroutine. It achieves the notable faster running times by applying Brandes on significantly smaller networks than the input graph, and many of its computations can be done in parallel. The degree of speedup achieved by Brandes++ depends on the community structure of the input network. Our experiments with real-life networks reveal Brandes++ achieves an average of 10-fold speedup over Brandes, while there are networks where this speedup is 75-fold. We have made our code public to benefit the research community.
1 Introduction
In 1977, Freeman [10] defined the betweenness centrality of a node as the fraction of all pairwise shortest paths that go through . Since then, this measure of centrality has been used in a wide range of applications including social, computer as well as biological networks.
A naïve algorithm can compute the betweenness centrality of a graph of nodes in time. This running time was first improved in 2001 by Brandes [4] who provided an algorithm that, for a graph of nodes and edges, does the same computation in . The key behind this algorithm, which we call Brandes is that it reuses information on shortest path segments that are shared by many nodes.
Over the years, many algorithms have been proposed to improve the running and space complexity of Brandes. Although we discuss these algorithms in the next section, we point out here that most of them either provide approximate computations of betweenness via sampling [2, 6, 11, 23], or propose parallelization of the original computation [3, 18, 27, 9].
The goal of our paper is to exploit the structure of the underlying graph and further improve this running time, while returning the exact values of betweenness scores. We achieve this goal by designing the Brandes++ algorithm, which is a divide-and-conquer algorithm and works as follows: first it partitions the graph into subgraphs and runs some single-source shortest path computations on these subgraphs. Then it deploys a modified version of Brandes on a sketch of the original graph to compute the betweenness of all nodes in the graph. The key behind the speed-up of Brandes++ over Brandes is that all computations are run over graphs that are significantly smaller than the original graph.
There are many real-life settings where there is a set of prominent nodes in the network and only shortest paths connecting these nodes are important to the application. The original Brandes algorithm can be used for this setting as well (see Section 3 for details) and compute exactly the betweenness scores in time . In this current work we first present Brandes++ as an algorithm that takes the target set as an input and computes the betweenness centrality of every node with respect to in Section 5. We then elaborate on how to use the schema of Section 5 to compute betweenness centrality with respect to all node pairs in Section 6.
Our experiments (Section 7) with real-life networks suggest that there are networks for which Brandes++ can yield a 75-fold improvement over Brandes. Our analysis reveals that this improvement depends largely on the structural characteristics of the network and mostly on its community structure.
Some other advantages of Brandes++ are the following: Brandes++ can employ all existing speedups for Brandes. Many steps of our algorithm are easily paralellizable. Finally, we have made our code public to benefit the research community.
2 Overview of Related Work
Perhaps the most widely known algorithm for computing betweenness centrality is due to Ulrik Brandes [4], who also studied extension of his algorithm to groups of nodes in Brandes et al. [5]. The Brandes algorithm has motivated a lot of subsequent work that led to parallel versions of the algorithm [3, 18, 27, 9] as well as classical algorithms that approximate the betweenness centrality of nodes [2, 6, 11] or a very recent one [23]. The difference between approximation algorithms and Brandes++ is that in case of the former a subset of the graph (either pivots, shortest paths, etc. depending on the approach) is taken to estimate the centrality of all nodes in the graph. In contrary, Brandes++ computes the exact value for every node. Further, any parallelism that can be exploited by Brandes can also be exploited by Brandes++.
Despite the huge literature on the topic, there has been only little work on finding an improved centralized exact algorithm for computing betweenness centrality. To the best of our knowledge, only recently Puzis et al. [21] and Sariyüce et al. [25] focus on that. In the former, the authors suggest two heuristics to speedup the computations. These heuristics can be applied independent of each other. The first one, contracts structurally-equivalent nodes (nodes that have identical neighborhoods) into one “supernode”. The second heuristic relies on finding the biconnected components of the graph and contracting them into a new type of “supernodes”. These latter supernodes are then connected in the graph’s biconnected tree. The key observation is that if a shortest path has its endpoints in two different nodes of this tree then all shortest paths between them will traverse the same edges of the tree. Sariyüce et al. [25] rely on these two heuristics and some additional observations to further simplify the computations.
The similarity between our algorithm and the algorithms we described above is in their divide-and-conquer nature. One can see the biconnected components of the graph as the input partition that is provided to Brandes++. However, since our algorithm works with any input partition it is more general and thus more flexible. Indicatively, we give some examples of how Brandes++ outperforms these two heuristics by comparing some of our experimental results to the results reported in [21] and [25]. In the former, we see that the biconnected component heuristic of Puzis et al. achieves a -times speedup on the WikiVote dataset. Our experiments with the same data show that Brandes++ provides a -factor speedup. For the DBLP dataset Puzis et al. achieve a speedup factor between – depending on the sample. We achieve a factor of . The best result on a social-network type graph in [25] is a factor of speedup while we achieve factors on WikiVote and on the EU data.
3 Preliminaries
We start this section by defining betweenness centrality. Then we review some necessary previous results.
Notation. Let be an undirected weighted graph with nodes , edges and non-negative edge weights . We denote and .
Let . The distance between and is the length of the (weighted) shortest path in connecting them, we denote this by . We denote by the number of shortest paths between and . For the value denotes the number of shortest paths connecting and that contain . Observe, that is a symmetric function, thus .
The dependency of and on is the fraction of shortest paths connecting and that go through , thus
Given the above, the betweenness centrality of node can be defined as the sum of its dependencies.
| (3.1) |
Throughout the paper we use the terms betweenness, centrality and betweenness centrality interchangeably.
A naïve algorithm for betweenness centrality. In order to compute the dependencies in Eq. (3.1) we need to compute and for every triple and . Observe that is contained in a shortest path between and if and only if . If this equality holds, then any shortest path from to can be written as the concatenation of a shortest path connecting and and a shortest path from to . Hence, . If is the set of parent nodes of , then it is easy to see that
| (3.2) |
We can compute for a given target and all possible nodes by running a weighted single source shortest paths algorithm (such as the Dijkstra algorithm) with source . While the search tree in Dijkstra is built is computed by formula (3.1). The running time of Dijkstra is per source using a Fibonacci-heap implementation (the fastest known implementation of Dijkstra). Finally, a naïve computation of the dependencies can be done as
Even given if all values are given, this computations requires time equal to the number of dependencies, i.e., .
The Brandes algorithm. Let define the dependency of a node on a single target as the sum of the dependencies containing , thus
| (3.3) |
The key observation of Brandes is that for a fixed target we can compute by traversing the shortest-paths tree found by Dijkstra in the reversed order of distance to using the formula:
| (3.4) |
Using this trick, the dependencies can be computed in time , yielding a total running time of for Brandes.
Betweenness centrality for a given target set. In many applications there is a subset of nodes that is of interest to the user. We call a target node and assume . Observe now, that the naïve algorithm for betweenness centrality can easily be modified to compute the centralities only with respect to . For this we only need to modify equation (3.1) to sum over nodes in the target set only,
| (3.5) |
Observe that for the definitions in equations (3.1) and (3.5) are identical. As it will always be clear from the context whether the centrality of is computed with regard to a target set or the entire , we will omit from the notation and use instead of in this paper. Naturally we only compute for pairs where and . This modified algorithm requires time equal to the number of dependencies, that is .
To adjust the Brandes algorithm to the target set we again need to modify the computations to only consider nodes in . Thus the dependency only takes targets into consideration;
| (3.6) |
The recusive formula in equation (3.4) also only takes target nodes into account;
| (3.7) |
Where is an indicator that is if and zero otherwise. This is used to make sure that we only sum dependencies between pairs of target nodes. Using this trick, the dependencies can be computed in time , yielding a total running time of for Brandes.
4 The skeleton Graph
In this section, we introduce the skeleton of a graph . The purpose of the skeleton is to get a simplified representation of that still contains all information on shortest paths between nodes.
Let be a weighted undirected graph with nodes , edges and edge weights . We also assume that we are given a partition of the nodes into parts: such that and for every .
The skeleton of is defined to be a graph ; its nodes are a subset of . For every edge the function represents a pair of weights called the characteristic tuple associated with . All of , and depend on the partition . Whenever it is clear from the context which partition is used we drop from the notation and use instead of . We now proceed to explain in detail how , and are defined.
Supernodes: Given , we define to be the subgraph of that is spanned by the nodes in , that is . We denote the nodes and edges of by and respectively. We refer to the subgraphs as supernodes. Since is a partition, all nodes in belong to one of the supernodes .
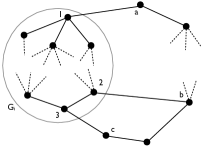

Nodes in the skeleton (): Within every supernode there are some nodes of special significance. These are the nodes that have at least one edge connecting them to a node of another supernode . We call the frontier of . In Figure 1(a) the supernode consists of nodes and edges inside the large circle. The frontier of is . Observe that nodes , and are also frontier nodes in their respective supernodes. The nodes of the skeleton consist of the union of all frontier nodes i.e., .
Edges in the skeleton (): The edges in are defined with help of the frontiers in . First, in order to see the significance of the frontier nodes, pick any two target nodes . Observe, that some of the shortest paths between and may pass through . Any such path has to enter the supernode through one of the frontier nodes and exit through another frontier . It is easy to check, whether there are any shortest paths through and ; given , there is a shortest path between and passing through and if and only if
| (4.8) |
Also the number of paths passing through and is:
| (4.9) |
Recall that the nodes of the skeleton are the union of all frontiers in the supernodes. The edges serve the purpose of representing the possible shortest paths between pairs of frontier nodes, and as a result, the paths between pairs of target nodes in . The key observation to the definition of the skeleton is, that we solely depend on the frontiers and do not need to list all possible (shortest) paths in . We want to emphasize here that in order not to double count, we only consider the paths connecting and that do not contain any other frontier inside the path. Paths containing more than two frontiers will be considered as concatenations of shorter paths during computations on the entire skeleton. The exact details will be clear once we define the edges and some weights assigned to the edges in the following paragraphs.
consists of two types of edges; first, the edges that connect frontiers in different supernodes (such as edges , and in Figure 1(a)). We denote these edges by . Observe that these edges are also in the original graph , namely . The second type are edges between all pairs of frontier nodes within each supernode. To be exact, we add the edges of the clique to the skeleton. Hence, the edges of the skeleton can be defined as the union of and the cliques defined by the supernodes, i.e., .
Characteristic tuples in the skeleton (): We assign a characteristic tuple , consisting of a weight and a multiplicity, to every edge . For edge the weight represents the length of the shortest path between and in the original graph; the multiplicity encodes the number of different shortest paths between these two nodes. That is, if , then , where is the weight of in . If is in for some , then are frontiers in . In this case . The values and are used in Equations (4.8) and (4.9). While these equations allow to compute the distance and multiplicity between target nodes and , both values are independent of the target nodes themselves. In fact, and only depend and are characteristic of their supernode .
We compute and by applying Dijkstra – as described in section 3 – in using the set of frontiers as sources. We want to emphasize here, that the characteristic tuple only represent the shortest paths between and that are entirely within the supernode and do not contain any other frontier node in . This precaution is needed to avoid double counting paths between and that leave and then come back later. To ensure this, we apply a very simple modification to the Dijkstra algorithm; in equation (LABEL:eq:parents) we only sum over the set of parents of a node that are not frontiers themselves, thus
| (4.10) | ||||
We refer to this modified version of Dijkstra’s algorithm that is run on the supernodes as Dijkstra_SK. For recursion (4.9) we also set .
The skeleton: Combining all the above, the skeleton of a graph is defined by the supernodes generated by the partition and can be described formally as
Figure 1(b) shows the skeleton of the graph from Figure 1(a). The nodes in are the frontiers of and the edges are the dark edges in this picture. Edges in are for example , and while edges in are , and .
Properties of the skeleton: We conclude this section by comparing the number of nodes and edges of the input graph and its skeleton . This comparison will facilitate the computation of the running time of the different algorithms in the next section.
Note that has less nodes than : the latter has nodes, while the former has only . Since not all nodes in are frontier nodes, then . For the edges, the original graph has edges, while its skeleton has . The relative size of and depends on the partition and the number of frontier nodes and edges between them it generates.
5 The Brandes++ Algorithm for Target Set
We are now ready to describe Brandes++, which leverages the speedup that can be gained by using the skeleton of a graph. At a high level Brandes++ consists of three main steps, first the skeleton is created, then a multipiclity-weighted version of Brandes’s algorithm is run on the skeleton. In the final step the centrality of all other nodes in is computed.
In this section we present as it is applied to computing the betweenness centrality of nodes with regard to a target set . It is trivial to see that the results of this section could be used to compute betweenness over all node pairs by taking . However, as we will see, the running time for Brandes++, when taking into consideration is dependent on and suboptimal compared to if is too large. In the next Section 6 we explain how to compute centrality over all node pairs, again by leveraging the skeleton. We denote the version of Brandes++ that considers all node pairs by Brandes++All.
The Brandes++ algorithm: The pseudocode of Brandes++ is given in Alg. 1. The input to this algorithm is the weighted undirected graph , the set of targets and partition . The algorithm outputs the exact values of betweenness centrality for every node in . Next we explain the details of each step.
Step 1: The Build_SK algorithm: Build_SK (Alg. 2) takes as input and the partition and outputs the skeleton . First it decides the set of frontiers in the supernodes (line 2). Then the characteristic tuples are computed in every supernode by way of Dijkstra_SK (line 4). Characteristic tuples on edges are by definition.
Running time: The frontier sets of each supernode can be found in time as it requires to check for every node whether they have a neighbor in another supernode. Dijkstra_SK has running time identical to the traditional Dijkstra algorithm, that is .
Target nodes in the skeleton: Note that since we need to know the shortest paths for every target node , we treat the nodes in specially. More specifically, given the input partition , we remove all targets from their respective parts and add them as singletons. Thus, we use the partition . Assuming that the number of target nodes is relatively small compared to the total number of nodes in the network, this does not have a significant effect on the running time of our algorithm.
Observe that the characteristic tuples of different supernodes are independent of each other allowing for a parallel execution of Dijkstra_SK.
Step 2: The Brandes_SK algorithm: The output of Brandes_SK are the exact betweenness centrality values for all nodes in , that is all frontiers in .
Remember from Section 3 that for every target node Brandes consists of two main steps; (1) running a single-source shortest paths algorithm from to compute the distances and number of shortest paths . (2) traversing the BFS tree of Dijkstra in reverse order of discovery to compute the dependencies based on Equation (3.7). The only difference between Brandes_SK and Brandes is that we take the distances and multiplicities on the edges of the skeleton into consideration. This means that Equation (5.11) is used instead of (3.2).
| (5.11) |
Here is the set of parent nodes of in . Observe that in Equation (5.11) is the multiplicity of shortest paths between and both in as well as in . That is why we do not use subscripts (such as ) in the above formula.
In the second step the dependencies of nodes in are computed by applying Equation (5.12) – which is the counterpart of Eq. (3.7) that takes multiplicities into account – to the reverse order traversal of the BFS tree.
| (5.12) |
Running time: Brandes and Brandes_SK have the same computational complexity but are applied to different graphs ( and respectively). Hence we get that Brandes_SK on the skeleton runs in time. If we express the same running time in terms of the frontier nodes we get
Step 3: The Centrality algorithm: In the last step of Brandes++, the centrality values of all remaining nodes in are computed. Let us focus on supernode ; for any node and there exists a frontier such that there exists a shortest path from to containing . Using Equation (5.12), we can compute the dependency as follows:
| (5.13) |
Then, the centrality of is .
To determine whether is contained in a path from to we need to remember the information for and every frontier . This value is actually computed during the Build_SK phase of Brandes++. Hence with additional use of space but without increasing the running time of the algorithm we can make use of it. At the same time with the multiplicity is also computed.
Space complexity: The Centrality algorithm takes two values – and – for every pair and . This results in storing a total of values for the skeleton.
Running time: Since we do not need to allocate any additional time for computing and computing Equation (5.13) takes time for every . Hence, summing over all supernodes we get that the running time of Centrality is .
Running time of Brandes++: The total time that Brandes++ takes is the combination of time required for steps 1,2 and 3. The asymptotic running time is a function of the number of nodes and edges in each supernode, the number of frontier nodes per supernode and the size of the skeleton. To give some intuition, assume that all supernodes have approximately nodes with at most half of the nodes being frontiers in each supernode. Further, assume that . Substituting these values into steps 1–3, we get that for a partition of size Brandes++ is order of -times faster than Brandes. While these assumptions are not necessarily true, they give some insight on how Brandes++ works. For (thus when there is no partition) the running times of Brandes++ and Brandes are identical while for larger values of the computational speedup is much more significant.
6 Brandes++All for All Pairs of Nodes
The concept of the skeleton graph is also suitable to compute betweenness centrality over all pairs of nodes in . In this section we present this version of Brandes++, which we denote by Brandes++All.
The Brandes++All algorithm: The high level structure of Brandes++All, shown in Algorithm 3, is very similar to Algorithm 1 presented in Section 5.
Brandes++All takes as input the graph and the partition . We create the supernodes the same way as before with help of the Build_SK algorithm (Line 3). We set the centrality for every node initially to . The idea is to iterate over all pairs of supernodes and and compute the centrality of nodes when we only consider shortest paths that have a node in as their source and a node in as their destination. We compute the centrality of as the sum
Since is a partition of and we iterate over all pairs (including the case ), this way we consider all shortest paths in . We now discuss the steps in Algorithm 3 in detail.
Step 1, the Build_SK algorithm: In this first step we compute the skeleton the same way as before. Note that there is no designated target set, hence will consist exactly of the nodes and edges defined by the partition .
Step 2, the Brandes_SK algorithm: The version of Brandes_SK that we use here has one additional step to the algorithm described in Section 5. It takes as input not only but also the set of source nodes and destination nodes . First it will change by adding every node in and as singleton supernodes to the graph, the resulting skeleton is denoted by . Then the old version of is run on this new skeleton that is dependent on and . Note that when , then is exactly the algorithm described in the previous section with . If , then the indicator function in Equation (3.7) is if and zero otherwise.
Step 3, the Centrality algorithm: This algorithm is identical to Centrality described in the previous section.
Running time of Brandes++All: The main difference in the running time between Brandes++ and Brandes++All is that in the latter Brandes_SK is called times as opposed to once. But, since it is run on the same size skeleton this only yields a -factor increase in this part of the algorithm. Observe that the running times of Build_SK and Centrality did not change in this version of Brandes++. For Build_SK this is trivial to see. Let be any node in and let be the supernode that contains . To see the claim for Centrality, recall that to compute for some source , destination and node , we need to do a computation for all frontier tuples in (if ). Thus, the number of required computations is the same as in Section 5, not forgetting that this number is a function of the size of the target set which in this instance is .
7 Experiments
In this section, we validate the performance of Brandes++ for a given target set , with experiments using data from a diverse set of applications.
Experimental setup: For all our experiments we follow the same methodology; given the partition , we run Steps 1–3 of Brandes++ (Alg. 1) using as input. Then, we report the running time of Brandes++ using this partition. The local computations on the supernodes (lines 2 and 4 of Alg. 2) can be done in parallel across the ’s. Hence, the running time we report is the sum of: (i) the running time of Build_SK on the largest supernode running Brandes_SK on the skeleton and computing the centrality of all remaining nodes in .
Implementation: In all our experiments we compare the running times of Brandes++ to Brandes [4] on weighted undirected graphs. While there are several high-quality implementations of Brandes available, we use here our own implementation of Brandes and, of course, Brandes++. All the results reported here correspond to our Python implementations of both algorithms. The reason for this is, that we want to ensure a fair comparison between the algorithms, where the algorithmic aspects of the running times are compared as opposed to differences due to more efficient memory handling, properties of the used language, etc. As the Brandes_SK algorithm run on the skeleton is almost identical to Brandes (see Section 5), in our implementation we use the exact same codes for Brandes as Brandes_SK, except for appropriate changes that take into account edge multiplicities. We also make our code available222available at: http://cs-people.bu.edu/edori/code.html.
Hardware: All experiments were conducted on a machine with Intel X5650 2.67GHz CPU and 12GB of memory.
Datasets: We use the following datasets:
WikiVote dataset [16]: The nodes in this graph correspond to users and the edges to users’ votes in the election to being promoted to certain levels of Wikipedia adminship. We use the graph as undirected, assuming that edges simply refer to the user’s knowing each other. The resulting graph has nodes and K edges.
AS dataset: [12] The AS graph corresponds to a communication network of who-talks-to whom from BGP logs. We used the directed Cyclops AS graph from Dec. 2010 [12]. The nodes represent Autonomous Systems (AS), while the edges represent the existence of communication relationship between two ASes and, as before, we assume the connections being undirected. The graph contains nodes and K edges, and has a power law degree distribution.
EU dataset [17]: This graph represents email data from a European research institute. Nodes of the graph correspond to the senders and recipients of emails, and the edges to the emails themselves. Two nodes in the graph are connected with an undirected edge if they have ever exchanged an email. The graph has K nodes and K edges.
DBLP dataset [28]: The DBLP graph contains the co- authorship network in the computer science community. Nodes correspond to authors and edges capture co-authorships. There are K nodes and M edges.
For all our real datasets, we pick nodes (uniformly at random) to form the target set .
Graph-partitioning: The speedup ratio of Brandes++ over Brandes is determined by the structure of the skeleton() that is induced by the input graph partition.
In practice, graphs that benefit most of Brandes++ are those that have small -cuts, such as those that have distinct community structure. On the other hand, graphs with large cuts, such as power-law graphs do not benefit that much from applying the partitioning of Brandes++.
For our experiments we partition the input graph into subgraphs using well-established graph-partitioning algorithms, which aim to either find densely-connected subgraphs or sparse cuts. Algorithms with the former objective fall under modularity clustering [7, 19, 22, 24] while the latter are normalized cut algorithms [1, 8, 13, 14, 15, 20, 26]. We choose the following three popular algorithms from these groups: Mod, Gc and Metis.
Mod: Mod is a hierarchical agglomerative algorithm that uses the modularity optimization function as a criterion for forming clusters. Due to the nature of the objective function, the algorithm decides the number of output clusters automatically and the number of clusters need not be provided as part of the input. Mod is described in Clauset et al [7] and its implementation is available at: http://cs.unm.edu/~aaron/research/fastmodularity.htm
Gc: Gc (graclus) is a normalized-cut partitioning algorithm that was first introduced by Dhillon et al. [8]. An implementation of Gc, that uses a kernel -means heuristic for producing a partition, is available at: cs.utexas.edu/users/dml/Software/graclus.html. Gc takes as input , an upper bound on the number of clusters of the output partition. For the rest of the discussion we will use Gc- to denote the Gc clustering into at most clusters.
Metis: This algorithm [15] is perhaps the most widely used normalized-cut partitioning algorithm. It does hierarchical graph bi-section with the objective to find a balanced partition that minimizes the total edge cut between the different parts of the partition. An implementation of the algorithm is available at: glaros.dtc.umn.edu/gkhome/views/metis. Similar to Gc, Metis takes an upper bound on the number of clusters as part of the input. Again, we use the notation Metis- to denote the Metis clustering into at most clusters.
We report the running times of the three clustering algorithms in Table 7. Note that for both Gc and Metis their running times depend on the input number of clusters – the larger the value of the larger the running time. The table summarizes the largest running time for each dataset (see Table 7 for the value of for each dataset). Note that the running times of the clustering algorithms cannot be compared to the running time of Brandes++ for two reasons; these algorithms are implemented using a different (and more efficient) programming language than Python and are highly optimized for speed, while our implementation of Brandes++ is not. We report Table 7 to compare the various clustering heuristics against each other.
Running time (in seconds) of the clustering algorithms (reported for the largest number of clusters per algorithm) and of Brandes (last column). Mod Gc Metis Brandes WikiVote AS EU 2088 DBLP
Results: The properties of the partitions produced for our datasets by the different clustering algorithms, as well as the corresponding running times of Brandes++ for each partition are shown in Table 7. In case of Gc and Metis we experimented with several (about ) values of . We report for three different values of (one small, one medium and one large) for each dataset. The values were chosen in such a way, that the -clustering with the best results in Brandes++ is among those reported. As a reference point, we report in Table 7 the running times of the original Brandes algorithm on our datasets.
Properties of the partitions (: number of frontier nodes in skeleton, : number of edges in skeleton, : number of supernodes, LCS: number of original nodes in the largest cluster) produced by different clustering algorithms and running time of Brandes++ on the different datasets. WikiVote dataset Mod Gc- Gc- Gc- Metis- Metis- Metis- LCS Brandes++ running time in seconds AS dataset Mod Gc- Gc- Gc- Metis- Metis- Metis- LCS Brandes++ running time in seconds EU dataset Mod Gc- Gc- Gc- Metis- Metis- Metis- LCS Brandes++ running time in seconds 8291.3 DBLP dataset Mod Gc- Gc- Gc- Metis- Metis- Metis- LCS Brandes++ running time in seconds
In Table 7 and refer to the number of nodes and edges in the skeleton. Remember, that the set of nodes in the skeleton is the union of the frontier nodes in each supernode. Hence, is equal to the total number of frontier nodes induced by . Across datasets we can see quite similar values, depending on the number of clusters used. Mod seems to yield the lowest values of and . The third and fourth rows in the table contain the number of clusters (the size of the partition) for each algorithm and the total number of nodes (from the input graph) in the largest cluster of each partition.
The ultimate measure of performance is the running time of Brandes++ in the last row of the table. We compare the running times of Brandes++ to the running time of Brandes in Table 7 – last column. On the WikiVote data Brandes needs 5647 seconds while the corresponding time for Brandes++ can be as small as 72 seconds! Note that the best running time for this dataset is achieved using the Metis- partition. Suggesting that the underlying ”true” structure of the dataset consists of approximately communities of Wikipedia users. High speedup ratios are also achieved on EU and DBLP. For those Brandes takes 14325 and 28057 seconds respectively, while the running time of Brandes++ can be 189 and 3600 seconds respectively. This is an 8-fold speedup on DBLP and 75-fold on EU.
If we compare the running time of Brandes++ applied to the different partitions, we see that the algorithm with input by Metis is consistently faster than the same-sized partitions of Gc. Further, on EU and DBLP Brandes++ is the fastest with the Mod partition. Note the size of for each of these datasets. In case of EU Mod yields a skeleton where is only of the original number of nodes and is of the edges. The corresponding rations on DBLP are and . This is not surprising, as both datasets are known for their distinctive community structure, which is what Mod optimizes for. For AS, Brandes++ exhibits again smaller running time than Brandes, yet the improvement is not as impressive. Our conjecture is that this dataset does not have an inherent clustering structure and therefore Brandes++ cannot benefit from the partitioning of the data.
Note that the running times we report here refer only to the execution time of Brandes++ and do not include the actual time required for doing the clustering – the running times for clustering are reported in in Table 7. However, since the preprocessing has to be done only once and the space increase is only a constant factor, Brandes++ is clearly of huge benefit.
References
- [1] R. Andersen. A local algorithm for finding dense subgraphs. ACM Transactions on Algorithms, 2010.
- [2] D. A. Bader, S. Kintali, K. Madduri, and M. Mihail. Approximating betweenness centrality. In WAW, 2007.
- [3] D. A. Bader and K. Madduri. Parallel algorithms for evaluating centrality indices in real-world networks. In ICPP, 2006.
- [4] U. Brandes. A faster algorithm for betweenness centrality. Journal of Mathematical Sociology, 2001.
- [5] U. Brandes. On variants of shortest-path betweenness centrality and their generic computation. Social Networks, 2008.
- [6] U. Brandes and C. Pich. Centrality estimation in large networks. International Journal of Bifurcation and Chaos, 2007.
- [7] A. Clauset, M. E. J. Newman, and C. Moore. Finding community structure in very large networks. Physical Review E, 2004.
- [8] I. S. Dhillon, Y. Guan, and B. Kulis. Weighted graph cuts without eigenvectors: A multilevel approach. IEEE Trans. Pattern Anal. Mach. Intell, 2007.
- [9] N. Edmonds, T. Hoefler, and A. Lumsdaine. A space-efficient parallel algorithm for computing betweenness centrality in distributed memory. In HiPC, 2010.
- [10] L. C. Freeman. A Set of Measures of Centrality Based on Betweenness. Sociometry, 1977.
- [11] R. Geisberger, P. Sanders, and D. Schultes. Better approximation of betweenness centrality. In ALENEX, 2008.
- [12] P. Gill, M. Schapira, and S. Goldberg. Let the market drive deployment: a strategy for transitioning to bgp security. In SIGCOMM, 2011.
- [13] B. Hendrickson and R. Leland. A multilevel algorithm for partitioning graphs. Supercomputing, 1995.
- [14] R. Kannan, S. Vempala, and A. Vetta. On clusterings: Good, bad and spectral. J. ACM, 2004.
- [15] G. Karypis and V. Kumar. Multilevel k-way partitioning scheme for irregular graphs. J. Parallel Distrib. Comput., 1998.
- [16] J. Leskovec, D. Huttenlocher, and J. Kleinberg. Predicting positive and negative links in online social networks. In WWW, 2010.
- [17] J. Leskovec, J. Kleinberg, and C. Faloutsos. Graph evolution: Densification and shrinking diameters. ACM Trans. Knowl. Discov. Data, 2007.
- [18] K. Madduri, D. Ediger, K. Jiang, D. A. Bader, and D. G. Chavarría-Miranda. A faster parallel algorithm and efficient multithreaded implementations for evaluating betweenness centrality on massive datasets. In IPDPS, 2009.
- [19] M. E. J. Newman and M. Girvan. Finding and evaluating community structure in networks. Physical Review, E 69, 2004.
- [20] A. Y. Ng, M. I. Jordan, and Y. Weiss. On spectral clustering: Analysis and an algorithm. In NIPS, 2001.
- [21] R. Puzis, P. Zilberman, Y. Elovici, S. Dolev, and U. Brandes. Heuristics for speeding up betweenness centrality computation. In SocialCom/PASSAT, 2012.
- [22] F. Radicchi, C. Castellano, F. Cecconi, V. Loreto, and D. Parisi. Defining and identifying communities in networks. Proceedings of the National Academy of Sciences, 2004.
- [23] M. Riondato and E. M. Kornaropoulos. Fast approximation of betweenness centrality through sampling. WSDM ’14, pages 413–422, 2014.
- [24] R. Rotta and A. Noack. Multilevel local search algorithms for modularity clustering. J. Exp. Algorithmics, 2011.
- [25] A. E. Sariyüce, E. Saule, K. Kaya, and Ü. V. Çatalyürek. Shattering and compressing networks for betweenness centrality. In SDM, 2013.
- [26] S. E. Schaeffer. Survey: Graph clustering. Comput. Sci. Rev., 2007.
- [27] G. Tan, D. Tu, and N. Sun. A parallel algorithm for computing betweenness centrality. In ICPP, 2009.
- [28] J. Yang and J. Leskovec. Defining and evaluating network communities based on ground-truth. In ICDM, 2012.