Photometric study of the star with changing Blazhko effect: TV Bootis
Abstract
This study investigates periodic modulation of the light curve of the RRc star TV Boo and its physical parameters based on photometric data. This phenomenon, known as Blazhko effect, is quite rare among RRc stars. Frequency analysis based on the data gathered at Masaryk University Observatory (MUO) and also using SuperWASP data revealed symmetrically structured peaks around the main pulsation frequency and its harmonics, which indicate two modulation components of the Blazhko period. The main modulation periodicity was found to be d. This is one of the shortest known Blazhko periods among RRc stars. The second modulation period ( d) causes changes of the Blazhko effect itself. Some indices show that TV Boo could be affected by long-term changes in the order of years. Basic physical parameters were estimated via a MUO light curve solution using Fourier parameters. TV Boo seems to be a low-metalicity star with .
keywords:
stars: horizontal branch – stars: individual (TV Bootis)1 Introduction
Light curve modulation together with cyclic period changing is quite common among pulsation variables. In the case of RR Lyrae type stars such behaviour has been known for more than one century and it is called the Blazhko effect after S. N. Blazhko, who firstly noticed phase modulation in RW Dra (Blazhko, 1907). The amplitude modulation was discovered several years later by Shapley (1916) in the prototype RR Lyr itself. Nowadays more than 40 % of all RRab stars seem to show this effect (Kolenberg et al., 2010; Jurcsik et al., 2006), but only about 5 % of RRc type (Moskalik & Poretti, 2002).
Although many theories have been suggested to explain the observed properties of modulated stars, the origin of the Blazhko effect is still not well understood. A brief overview of these theories can be found in Smith (1995), Kovács (2009) and Kolenberg (2011). In the era of the Kepler space telescope the 9:2 resonance between the fundamental radial mode and the 9th overtone seems to be responsible for the Blazhko effect (Buchler & Kolláth, 2011).
The Blazhko effect manifests itself as sidelobe frequencies around the main pulsation frequency and its harmonics in the frequency spectra. Also the modulation frequency itself and its harmonics are natural manifestations of the modulation (e.g. Benkő et al. (2011), Szeidl& Jurcsik (2009)). Frequencies are usually equally spaced and form doublets, triplets or higher multiplets.
The variability of TV Boo (, , J2000) was first reported in Gutnick & Prager (1926).GCVS (Samus et al., 2012) gives the period d and spectral type A7–F2. Metallicity () listed in Feast et al. (2008) makes TV Boo one of the stars with the lowest metallicity among RR Lyrae type stars.
The Blazhko effect in TV Boo has been known since 1965, when Detre (1965) found a Blazhko period of 33.5 d. Almost ten years later Firmanyuk (1974) reported the Blazhko effect with a period of d. More recently, using data of the Northern Sky Variability Survey (NSVS, Wozniak et al. (2004)), Wils et al. (2006) found the Blazhko period to be 10 d.
2 Observation and data reduction
TV Bootis was observed on 23 nights during three seasons from 2009 to 2011 (for the complete observation log see tab. 1) with the 60cm Newtonian telescope of Masaryk University Observatory (MUO) in Brno, Czech Republic. This telescope is equipped with a ST-8 CCD with a KAF-1600 chip (FOV ). Observations were carried out in filters. In each of these passbands more than 2000 data points were collected.
| Season | Time-span | Number of nights | Number of hours | Number of data points | ||
|---|---|---|---|---|---|---|
| 2009 | 8 | 50.9 | 1125 | 1173 | 1228 | |
| 2010 | 3 | 9.5 | - | 307 | 356 | |
| 2011 | 12 | 53.4 | 956 | 1180 | 1190 | |
| Total | 23 | 113.8 | 2081 | 2660 | 2774 | |
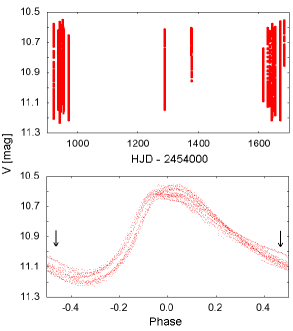
The data reduction and differential photometry were performed using the C-Munipack package111http://c-munipack.sourceforge.net/. TYC 3038-955-1 and TYC 3038-1064-1 were used as comparison and check stars respectively. Although both stars are significantly redder than TV Boo itself (which could slightly affect the light curve and mainly color indices), these stars were chosen because of the lack of other suitable stars in the vicinity of TV Boo. Standard deviations in the difference between the comparison and check stars were better than 0.01 mag in all pasbands. All the points were transformed to the standard magnitudes using standard stars in Landolt fields (Landolt, 1992). MUO data are in fig. 1. The first two lines of these data are listed in tab. 2, the whole dataset is available as supporting information with the online version of this paper.
We also analysed SuperWASP data. These data are of better quality for frequency analysis than MUO data because of the number of points (8914 points in 205 nights) and their time-span (1138 d).
| JDhel | [mag] |
|---|---|
| 2454921.515 | 11.201 |
| 2454921.516 | 11.204 |
| … | … |
3 Frequency analysis
| MUO | SuperWASP | |||||
|---|---|---|---|---|---|---|
| Id | Frequency | S/N | Frequency | S/N | ||
| c/d | mag | c/d | mag | |||
| 3.1993740(8) | 0.2620(3) | 163.9 | 3.1993646(4) | 0.2497(3) | 326.0 | |
| 3.302036(6) | 0.0342(6) | 21.5 | 3.302066(3) | 0.0318(3) | 42.0 | |
| 3.09671(2) | 0.0109(4) | 6.8 | 3.09667(1) | 0.0093(3) | 11.9 | |
| 3.244555(3) | 0.0066(6) | 4.1 | 3.24598(2) | 0.0060(3) | 7.9 | |
| 3.15276(2) | 0.0070(3) | 9.1 | ||||
| 6.398748(4) | 0.0730(5) | 49.1 | 6.398738(2) | 0.0729(3) | 156.6 | |
| 6.50141(2) | 0.0133(5) | 9.0 | 6.50143(2) | 0.0092(3) | 19.9 | |
| 6.29609(3) | 0.0072(5) | 4.8 | 6.29603(2) | 0.0069(3) | 14.8 | |
| 6.44534(3) | 0.0040(4) | 8.7 | ||||
| 6.35212(4) | 0.0026(3) | 5.6 | ||||
| 9.59812(1) | 0.0187(4) | 14.8 | 9.598107(6) | 0.0185(3) | 43.6 | |
| 9.70078(3) | 0.0102(4) | 5.7 | 9.70080(1) | 0.0077(3) | 18.2 | |
| 9.49540(3) | 0.0034(3) | 8.0 | ||||
| 9.64471(5) | 0.0024(3) | 5.6 | ||||
| 12.79750(2) | 0.0088(4) | 9.1 | 12.79748(1) | 0.0107(3) | 29.3 | |
| 12.90016(4) | 0.0051(4) | 5.2 | 12.90020(3) | 0.0032(3) | 8.7 | |
| 12.69480(6) | 0.0021(3) | 5.7 | ||||
| 15.99687(2) | 0.0090(4) | 11.7 | 15.99685(1) | 0.0079(3) | 22.5 | |
| 16.09950(6) | 0.0019(3) | 5.6 | ||||
| 16.04341(7) | 0.0016(3) | 4.6 | ||||
| 19.19624(4) | 0.0052(4) | 7.7 | 19.19621(2) | 0.0050(3) | 15.4 | |
| 22.39562(5) | 0.0037(4) | 6.4 | 22.39558(3) | 0.0032(3) | 11.2 | |
| 25.59499(5) | 0.0018(4) | 4.6 | 25.59495(6) | 0.0019(3) | 6.9 | |
Frequency analysis was performed using the MUO data set as well as data from the SuperWASP (Butters et al., 2010) and NSVS (Wozniak et al., 2004) surveys. As the main tool for frequency analysis Period 04 (Lenz & Breger, 2004) was used. For basic pulsation period determination PerSea software (made by G. Maciejewski on the basis of Schwarzenberg-Czerny (1996) method) and a Matlab script based on nonlinear least square method were used. Within their margins of error both methods gave the same results, so the maxima timings can be expressed as:
| (1) |
Analysis based on the MUO dataset gave almost the same results as were obtained with the SuperWASP data. Detected frequencies in all studied datasets are listed in tab. 3. Semi-amplitudes, S/N ratios222We mention only peaks with , because this is a generally accepted limit to distinguish between frequency peaks due to pulsation and noise (Breger et al., 1993). for individual frequencies and their standard deviations from the results obtained from Monte Carlo simulations are also given in this table. Results for NSVS data are not listed, because only three frequencies (, and ) were detected in this dataset.
Frequency analysis showed two modulation components located symmetrically around the main pulsation frequency and its harmonics up to the third order in the case of SuperWASP data and only one component related to the second modulation frequency ( c/d) was revealed in MUO data set. We detected 8 harmonics of the main pulsation frequency in all studied datasets.
The positions of sidelobe peaks with higher amplitudes correspond to cycles/day, which results in a 9.7374 d modulation period (Blazhko period). Except for the sidelobe frequencies, other equally spaced peaks were detected in SuperWASP data around the main frequency with values c/d and c/d. The difference between these frequencies and the main pulsation frequency is c/d, which indicates second modulation period of length d. This additional period is usualy explained as a changing Blazhko effect, which is also known in other stars, e.g. XZ Cyg (LaCluyzé et al., 2004), RV UMa (Hurta et al., 2008) or LS Her (Wils et al., 2008). A similar frequency structure with separate modulation peak series was also revealed in the case of CZ Lac (Sódor et al., 2011) and V445 Lyr (Guggenberger et al., 2012). All named stars (except LS Her) are of the RRab type. TV Boo is therefore the first known RRc type star with such a frequency structure333In the case of LS Her interesting frequency structure with an equidistant group of three frequencies on both sides of the main pulsation frequency was detected (Wils et al., 2008).
According to the frequency analysis the maxima timings for the Blazko effect can be expressed as
| (2) |
Phased MUO and SuperWasp light curves look very similar in shape and amplitude. Therefore, we tried to combine these datasets into one to evaluate the result. Phased light curves were fitted with the linear combination of sines to get a mean light curve and finally to obtain the shift in magnitudes between these two data sets444Zero points and amplitudes of the light changes were 11.123 mag 0.534 mag in the case of SuperWASP data and 10.917 mag and 0.567 mag for MUO data, respectively. The shift was therefore 0.206 mag.. Frequency analysis of such dataset revealed five frequency peaks related to the second modulation frequency, which were not detected in both datasets when studied separately. SuperWasp data cover a much broader wavelength range than the Johnson V passband. In addition the shape of SuperWasp and MUO light curve can be slightly different, therefore such combination is not rigorous.
One of the recent highlights of RR Lyrae research is the discovery of period-doubling (Szabó et al., 2010) and high-order resonances (Kolláth et al., 2011) as possible causes of the Blazhko effect. No signs of such behaviour were unveiled in the frequency spectra of TV Boo. This could either be caused by insufficient quality of the data for this purpose or first overtone Blazhko pulsators do not show such behaviour.
Another puzzle seen in many RRc stars (and Cepheids) observed with high-precision photometry is the presence of an additional frequency with a strangely repeating frequency ratio of 1.58–1.63 from star to star (see e.g. Moskalik et al. (2012)). Again, no frequency peaks with the given ratio or even close to this ratio were identified in studied datasets down to the level of residuals. In addition, the detection of such a frequency was complicated by the fact that in the area defined by the ratio fell aliases of the main pulsation frequency and also aliases related to modulation frequencies. In any case, based on our analysis, we could not confirm or disprove the presence of the frequency in the range of 1.58–1.63 . The fact, that such a feature could not be confirmed might indicate that the feature is absent in the case of TV Boo.
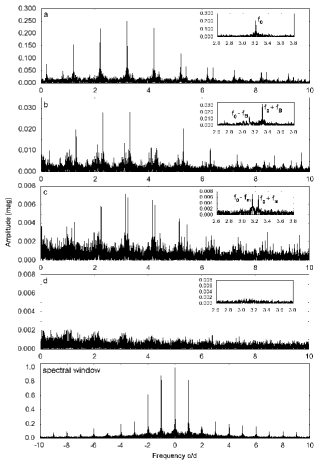
Frequency spectra together with the spectral window resulting from the SuperWASP dataset are shown in fig. 2. The first two panels show Fourier spectra with the main pulsation frequency (a) and spectrum after removal of this frequency and its harmonics (b). There are easily noticeable daily aliases of the highest peaks in these two panels. The final residual spectrum, after prewhitening with all basic and modulation frequencies, is given in panel (d). The height (about 3 mmag) of the residual spectrum is probably caused by small night-to-night shifts in the data as well as by unequally spaced observations. There is no significant peak in the residual plot.
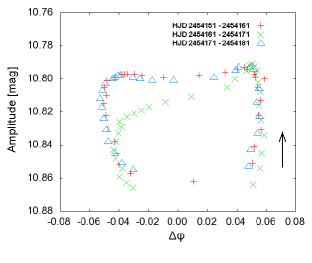
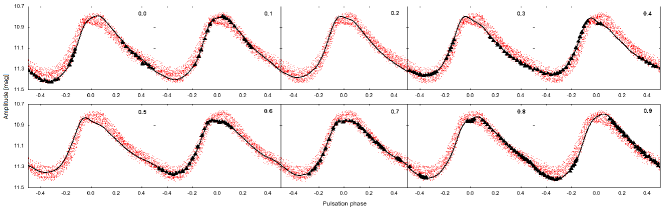
Fig. 5 shows what the light curve looked like during one Blazhko cycle between HJD 2454151 and 2454161. Each Blazhko cycle affects the light curve shape uniquely in a given Blazhko phase, which is the manifestation of a changing Blazhko effect. Notice the change of light curve shape around maxima during the Blazhko cycle.
4 Remarks on the period change during Blazhko cycle and possible long term features
Blazhko RRc stars primarily show frequency modulation with only small amplitude modulation. In TV Boo the amplitude of the light curve modulation is only about mag and the maximum and minimum of light changes are affected to a similar extent and the fuzziness of the light curve is uniform in all its parts (check fig. 1).
TV Boo, as a frequency modulated star with only small amplitude modulation, shows changes in pulsation period during the Blazhko cycle. Changes in phase and amplitude of maximum light during three unique Blazhko cycles between HJD 2454151 and 2454181 can be seen in fig. 3. Points in this plot represent maxima of our light curve model. Points from the first and third Blazhko cycles create curves of almost the same shape, but the curve based on points coming from the cycle between them differs. The phase-amplitude diagram will be similar for a few following Blazhko cycles before it will change considerably. Bear in mind that the shape of the light curve is slowly changing in time, so the phase-amplitude diagram will look completely different after many Blazhko cycles.
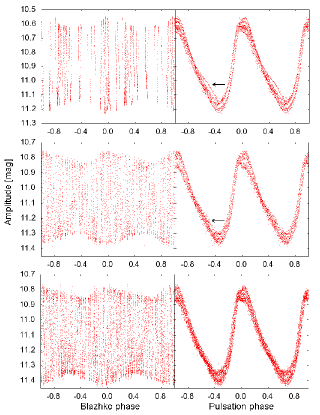
The amplitude of the period changes determined from maxima timings is about , in the terms of time it is about 58 minutes. This value is strongly affected by the change of the light curve shape around maxima. A more realistic estimation of the magnitude of the phase modulation can be obtained by measuring the phase shift in the ascending branch. We measured the phase shift in fixed magnitude 11.1 (approximately half of the light curve amplitude) and we obtained the strength of period change during Blazhko cycle beginning at HJD 2454151 shown in fig. 5 , which gives a little less than 21 minutes. This value is also slightly cycle-to-cycle dependent, but only on the order of .
Descending branches of the light curves are deformed with humps in some minima of the Blazhko cycles, but they are not present in each Blazhko cycle. In the MUO data the hump was not detected in the season 2009, but it is clearly visible in the data gathered in 2010 and 2011. Similarly, in the SuperWASP data from the season 2007 this behaviour was not unveiled, but there is a weak sign of the hump in the 2004 season (see fig. 4, middle panel). In the same figure it is apparent that the Blazhko light curve is strongly asymmetric with its minimum around the Blazhko phase 0.7. This feature could be a demonstration of long-term changes known in few other examples, e.g. in RR Lyrae itself with long changes lasting 4 years (Detre & Szeidl, 1973). A first order estimation of such a period could then be about 6 years. However this claim is based on the assumption that MUO and SuperWASP light curves are of the same shape and amplitudes. Of course, absence of the hump can be caused by the properties of the data itself - lack of data for such Blazhko phases in studied datasets or the overlapping of data by other data.
5 Physical parameters
In the 1990’s some empirical relations between so-called Fourier coefficients and basic physical parameters of RR Lyraes were found, namely there are calibrations for metallicity, temperature, absolute magnitude etc. (Kovács, 1998; Jurcsik, 1998). The method is based on the decomposition of a phased band light curve into its sum of sines or cosines. This can be done for stable RR Lyraes and even for Blazhko stars, but good coverage of the folded light curve is needed. After decomposition Fourier parameters and can be determined as follows:
| (3) |
| (4) |
| (5) |
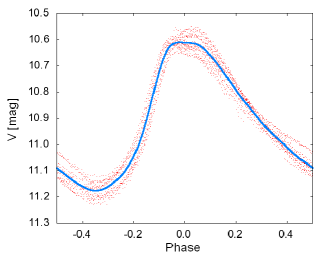
The phased MUO light curve was modelled with the sum of sine with 9 components (fig. 6). The order of fit was chosen by visual inspection. The first few obtained Fourier parameters are given in tab. 4.
The following calibrations for RRc stars listed in Simon & Clement (1993); Morgan et al. (2007); Kovács (1998) were used:
| (6) |
| (7) |
| (8) |
| (9) |
| (10) |
where are coefficients based on cosine-term decomposition and sine-term decomposition coefficients respectively. The relations between sine and cosine coefficients are . The zero point in eq. 7 was decreased according to Cacciari et al. (2005) by 0.2 as opposed to the equation in Kovács (1998).
| mag | mag | mag | mag | rad | rad | rad |
|---|---|---|---|---|---|---|
| 10.917 | 0.283 | 0.078 | 0.043 | 2.698 | 5.545 | 1.996 |
| [K] | |
|---|---|
| [mag] | |
| \textfrakM [\textfrakM | |
| [pc] |
Physical parameters resulting from eq. 6–10 using the MUO light curve fit noted in tab. 4, are listed in tab. 5. Metallicity in eq. 6 is given in the Zinn & West (1984) scale. The solution, and mainly parameter , is very sensitive to the coverage of the light curve. If we remove three nights when the hump was observed, the decreases its value by about 0.04, which leads to a change in of about . Our light curve is not ideally covered in all possible Blazhko phases, so we suspect metallicity to be even slightly higher (in the order of hundreths) than the obtained value .
This value differs by an order of a few tenths from the published values: (Butler et al., 1982), (Suntzeff et al., 1994), (Fernley et al., 1998). These values came from the approach (Preston, 1959). In the case of the Blazhko star TV Boo, we need to measure in various Blazhko phases to obtain a meaningful value of . The problem of previous studies is that was not determined at minimum light, as it is required. Furthermore it was determined only in in a few very close pulsation phases.
Published values of vary between (Preston, 1959) and (Butler, 1975). Transforming them via eq. 3 in Suntzeff et al. (1994) we obtained a range of metallicities from (Preston, 1959) to (Butler, 1975). Solving these ten light curves assuming one unique Blazhko cycle as shown in fig. 5, we obtained metallicities between and , so the determination of metallicity strongly depends on the Blazhko phase.
Peña et al. (2009) observed TV Bootis and determined basic physical parameters in the same way as we did. They proposed the metallicity to be . Unfortunately, their measurements cover only one pulsation cycle.
The errors of physical parameters were calculated according to errors of calibrations given in papers they are taken from. All parameters (except metallicity) of TV Bootis in tab. 5 are almost the same as found in literature, especially with those listed in Peña et al. (2009). The value of the radius of star is only rough estimation determined by solving Stefan-Bolzmann equation for a black body.
The estimated mass of TV Boo is quite high compared to RRab type stars, but it is just in the middle of
mass interval for RRc stars noted in Simon & Clement (1993). The distance was determined using the distant
modulus with extinction 0.024 mag in the band555taken from
http://ned.ipac.caltech.edu/forms/calculator.html.
This value is in agreement with 1149 pc noted in Liu & Janes (1990).
6 Conclusions
The Blazhko star TV Bootis was analysed using data gathered at MUO in 23 nights together with data from the SuperWASP survey. The data cover few years and contain a wide range of Blazhko phases. Therefore, we were able to determine new pulsation properties with the best precision ever and also we were able to obtain meaningful values of physical parameters.
Frequency analysis revealed symmetric structures located in the vicinity of the basic pulsation frequency and its harmonics with two modulation peaks. The star with the basic pulsation period a little bit shorter than 8 hours shows light curve modulation with a period of 9.7374 d. This is one of the shortest Blazhko period known for RR Lyrae type stars. Frequency analysis also unveiled another modulation period with a value of 21.5 d, which causes changes in Blazhko effect itself. In addition to this period, there are some indications for longer light curve changes in the order of years. This behavior should be confirmed or disproved by further observations. No signs of the period doubling phenomenon or a strange frequency in the range 1.58–1.63 , revealed in some RRc stars, were detected.
We found TV Bootis to be a low-metallicity star with . This value is slightly higher than metallicities found in literature (from -2.5 to -2.04). These values come from only few measurements based mainly on spectroscopic observations with short timespan, carried out in one unique Blazhko phase. The lack of observations in different Blazhko phases and low number of observations is a crucial deficiency in many studies of Blazhko stars. The discrepancies in metallicities could be resolved by a new spectroscopic measurements made in many Blazhko phases with sufficient timespan.
References
- Benkő et al. (2011) Benkő, J. M., Szabó, R., & Paparó, M. 2011, MNRAS, 417, 974
- Blazhko (1907) Blazhko S.N., 1907, AN, 175, 325
- Breger et al. (1993) Breger M. et al., 1993, A&A, 271, 482
- Buchler & Kolláth (2011) Buchler J.R., Kolláth Z., 2011, ApJ, 731, 24
- Butler (1975) Butler D., 1975, ApJ, 200, 68
- Butler et al. (1982) Butler D. et al., 1982, AJ, 87, 640
- Butters et al. (2010) Butters O.W. et al., 2010, A&A, 520, 10
- Cacciari et al. (2005) Cacciari C. et al. 2005, AJ, 129, 267
- Detre (1965) Detre L., 1965, Astron. Abh. Leipzig, p. 621
- Detre & Szeidl (1973) Detre L., Szeidl N., 1973, Inf. Bull. Var. Stars, 764, 1
- Firmanyuk (1974) Firmanyuk B.N., 1974, ATsir, 863, 7
- Feast et al. (2008) Feast M.W. et al., 2008, MNRAS, 386, 2115
- Fernley et al. (1998) Fernley J. et al., 1998, MNRAS, 293, 61
- Guggenberger et al. (2012) Guggenberger, E., Kolenberg, K., Nemec, J. M., et al. 2012, MNRAS, 424, 649
- Gutnick & Prager (1926) Gutnick P., Prager R. 1926, AN, 228, 353
- Hurta et al. (2008) Hurta Zs. et al., 2008, AJ, 135, 957
- Jurcsik (1998) Jurcsik J., 1998, A&A, 333, 571
- Jurcsik et al. (2006) Jurcsik J. et al., 2006, AJ, 132, 61
- Kolenberg et al. (2010) Kolenberg K. et al., 2010, ApJ, 713L, 198
- Kolenberg (2011) Kolenberg K., 2011, rrls.conf..100K
- Kolláth et al. (2011) Kolláth, Z., Molnár, L., Szabó, R. 2011, MNRAS, 414, 1111
- Kovács (1998) Kovács G., 1998, MmSAI, 49, 69
- Kovács (2009) Kovács, G. 2009, AIPC, 1170, 261
- LaCluyzé et al. (2004) LaCluyzé A. et al., 2004, AJ, 127, 1653
- Landolt (1992) Landolt A.U., 1992, AJ, 104, 340
- Lenz & Breger (2004) Lenz P., Breger M., 2004, Comm. Ast., 146, 53
- Liu & Janes (1990) Liu T., Janes K.A., 1990, AJ, 354, 273
- Morgan et al. (2007) Morgan S.M. et al. 2007, MNRAS, 374, 1421
- Moskalik & Poretti (2002) Moskalik P., Poretti E., 2002, ASPC, 259, 392
- Moskalik et al. (2012) Moskalik, P. et al. 2012, arXiv:1208.4251
- Peña et al. (2009) Peña J.H. et al. 2009, Rev.Mex.As.As., 45, 191
- Preston (1959) Preston, G.W., 1959, ApJ, 130, 507
- Samus et al. (2012) Samus N.N. et al., 2012, CDS, B/gcvs (ver. Feb. 2012)
- Schwarzenberg-Czerny (1996) Schwarzenberg-Czerny, 1996, ApJ, 460, L107
- Shapley (1916) Shapley, H. 1916, ApJ 43, 217
- Simon & Clement (1993) Simon, N.R., Clement, C. M. 1993, ApJ, 410, 526
- Sódor et al. (2011) Sódor, Á., Jurcsik, J., Szeidl, B., et al. 2011, MNRAS, 411, 1585
- Smith (1995) Smith H.A., 1995, RR Lyrae Stars, (Cambridge Univ. Press)
- Suntzeff et al. (1994) Suntzeff N.B. et al. 1994, ApJS, 93, 271
- Szabó et al. (2010) Szabó, R. et al. 2010, MNRAS, 409, 1244
- Szeidl& Jurcsik (2009) Szeidl, B., Jurcsik, J. 2009, CoAst., 160, 17
- Wils et al. (2006) Wils P. et al., 2006, MNRAS, 368, 1757
- Wils et al. (2008) Wils P. et al., 2008, MNRAS, 387, 783
- Wozniak et al. (2004) Wozniak P.R. et al., 2004, AJ, 127, 2436
- Zinn & West (1984) Zinn, R., West, M.J. 1984, ApJS, 55, 45
Acknowledgments
We would like to thank Zdeněk Mikulášek, S. N. de Villiers and our referee for useful comments and suggestions. We acknowledge the WASP consortium which comprises of the University of Cambridge, Keele University, University of Leicester, The Open University, The Queen s University Belfast, St. Andrews University and the Isaac Newton Group. Funding for WASP comes from the consortium universities and from the UK s Science and Technology Facilities Council. This work was supported by GACR project GD205/08/H005, MU MUNI/A/0968/2009 and GAP 209/12/0217.