The planetary nebula IPHASXJ211420.0+434136 (Ou5): insights into common-envelope dynamical and chemical evolution
Abstract
While analysing the images of the IPHAS H survey, we noticed that the central star of the candidate planetary nebula IPHASXJ211420.0+434136 (also named Ou5) was clearly variable. This is generally considered as an indication of binarity. To confirm it, we performed a photometric monitoring of the central star, and obtained images and spectra of the nebula.
The nebular spectrum confirms that IPHASXJ211420.0+434136 is a planetary nebula of moderately high excitation. It has a remarkable morphology with two nested pairs of bipolar lobes, and other unusual features. The light curve of the central star reveals that it is an eclipsing binary system with an orbital period of 8.74 hours. It also displays a strong irradiation effect with an amplitude of 1.5 mag.
The presence of multiple bipolar outflows adds constraints to the formation of these nebulae, suggesting the occurrence of discrete ejection events during, or immediately before, the common-envelope phase.
IPHASXJ211420.0+434136 also adds evidence to the hypothesis that a significant fraction of planetary nebulae with close binary central stars have a peculiar nebular chemistry and a relatively low nebular mass. This may point to low-mass, low-metallicity progenitors, with additional effects related to the binary evolution. We also suggest that these objects may be relevant to understand the abundance discrepancy problem in planetary nebulae.
keywords:
planetary nebulae: individual: IPHASXJ211420.0+434136 (Ou5, PN G086.9–03.4) – binaries: close – stars: winds, outflows – ISM: jets and outflows – ISM: abundances1 Introduction
Interactions in binary stars are the favoured mechanism to explain the departure from spherical symmetry observed in a large number of planetary nebulae (PNe, see e.g. Morris, 1987; Soker, 1997; Nordhaus & Blackman, 2006). However, it has been traditionally difficult to observationally prove this idea, because PN central stars are generally faint in the optical, and often hidden by the emission/absorption of the surrounding gas/dust. In addition, it is not easy to disentangle the luminosity contribution of low-mass companions (see e.g. Zuckerman, Becklin & McLean, 1991; De Marco et al., 2013) or interpret radial velocity measurements (De Marco et al., 2007). Furthermore, detection of wide binaries requires high-precision spectroscopy over a long period (Van Wickel et al., 2014).
Only in the last few years, starting with the work of Miszalski et al. (2009a), the number of PN binary central stars with known orbital periods has significantly increased to about forty objects from the initial dozen found by Bond (2000). However, it is important to continue in the effort, both to increase the statistics, from which general properties can be derived, and to provide detailed studies of individual objects, in order to determine which are the relevant physical processes at work.
IPHASXJ211420.0+434136 is a candidate planetary nebula identified in the INT/WFC Photometric H Survey of the northern Galactic plane (IPHAS, Drew et al., 2005). The nebula was independently found by Nicolas Outters: following the notation used for the other objects discovered by this French amateur astronomer (Acker et al., 2012; Acker & Le Dû, 2014), the nebula should also be named Ou5. The object attracted our attention because its central star is relatively bright at red wavelengths and presents clear signs of variability in the three epochs at which IPHAS observed it. These characteristics are suggestive of the presence of a binary central star, where the variability reflects the orbital motion of irradiated (Corradi et al., 2011; Miszalski et al., 2011), gravitationally distorted (Santander-García et al., 2013), or eclipsing (Miszalski et al., 2008) stars, or a combination of them (Jones et al., 2014). We have therefore gathered photometric and spectroscopic observations of IPHASXJ211420.0+434136 that are presented in the following sections.
2 Observations
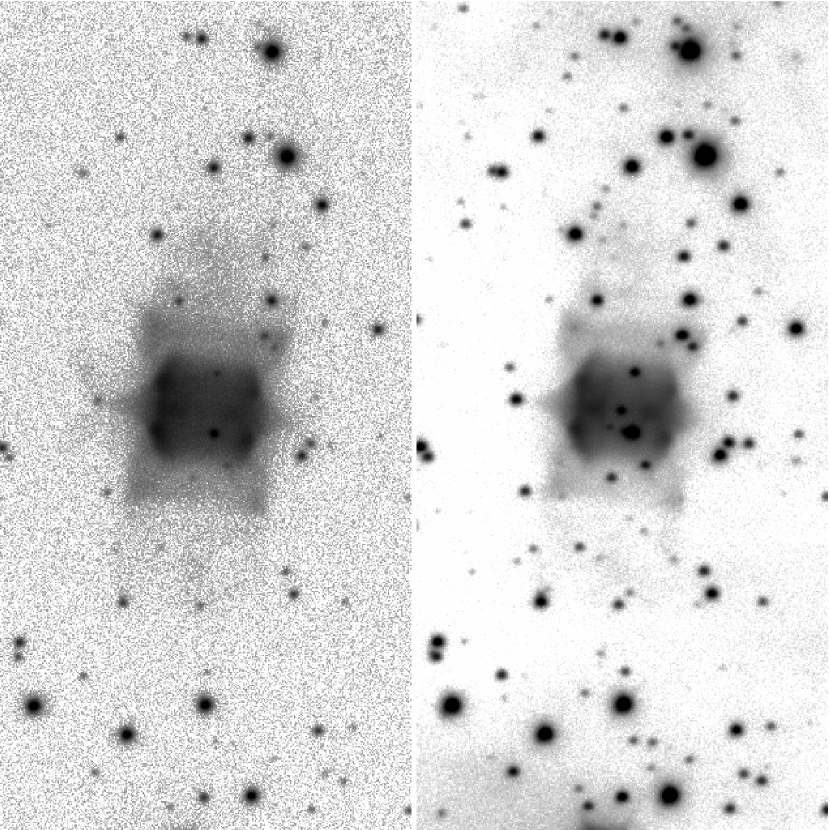
IPHASXJ211420.0+434136 is located in Cygnus, in a region rich in extended nebulosities two degrees east of the North America nebula. The nebula is easily visible in the 2 min H+[N ii] exposures of the IPHAS survey obtained with the 2.5m Isaac Newton Telescope (INT). Deeper images of IPHASXJ211420.0+434136 were obtained on November 7, 2013 at the 2.6m Nordic Optical Telescope (NOT) and the ALFOSC instrument. The filter central wavelength and full width at half maximum (FWHM) were 6577/180 Å (H+[N ii]) and 5007/30 Å ([O iii]). Exposure time was 30 min in H+[N ii], and 15 min in [O iii]. The spatial scale of the ALFOSC instrument is pix-1, and seeing was FWHM for the image, and for [O iii].
During the the same night, a 15 min spectrum of the source was obtained at the 10.4m Gran Telescopio Canarias (GTC) telescope. The OSIRIS instrument was used in its longslit mode. Grism R1000B and a slit width of provides a spectral dispersion of 2.1 Å per (binned 2) pixel, a resolution of 7 Å, and a spectral coverage from 3700 to 7800 Å. The spatial scale is per binned pixel. The slit was oriented at position angle 311∘ and crossed the central star. A 15 min red spectrum, covering from 5100 to 9200 Å, was obtained with the same instrumentation on November 15 using grism R1000R and positioning the slit at P.A. 281.5∘. Spectral dispersion and resolution were 2.6 Å pix-1 and 8 Å, respectively. Flux calibration was performed by observing the spectrophotometric standard stars GD48 and GD191–B2B (Oke, 1990).
Time-resolved photometry of the central star of IPHASXJ211420.0+434136 in the SDSS –band was performed during the nights of October 31, and November 14, 23, 24, and 25, 2013, with the 0.8m IAC80 telescope and its CAMELOT camera. The pixel size is 0′′.30 and the seeing varied from 1′′.0 to 1′′.6. The source was followed during about four hours every night. In order to complete the light curve and precisely determine its periodicity, additional photometry was obtained at other telescopes. IPHASXJ211420.0+434136 was observed during a total of nine hours on November 8 and 17 with the 0.6m Zeiss 600 telescope at Tartu Observatory using an Andor Ikon-L back-illuminated camera and a Bessel I–band filter from Optec. Here the pixel size is 0′′.38 and seeing varied from 1′′.5 to 2′′.5. The central star of IPHASXJ211420.0+434136 was also observed at the INT on the night of November 28 using its WFC camera (0′′.33 per pixel), and with the 4.2m WHT telescope and ACAM on December 16, both with a SDSS filter. Exposure times varied from 40 sec to 10 min depending on the telescope and the brightness of the central star. Magnitudes obtained with the different telescopes were matched to the IPHAS photometry (Barentsen et al., 2014) using field stars.
The basic reduction of all data was carried out with standard routines in IRAF V2.16111IRAF is distributed by the National Optical Astronomy Observatory, which is operated by the Association of Universities for Research in Astronomy (AURA) under cooperative agreement with the National Science Foundation..
3 Analysis
3.1 The nebula
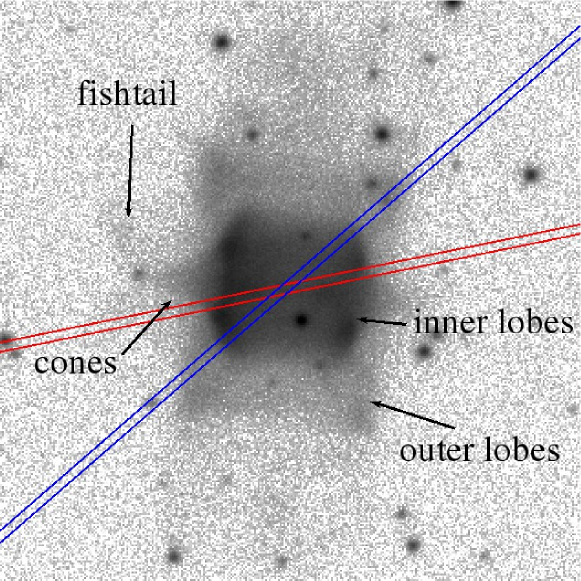
The NOT images of IPHASXJ211420.0+434136 are shown in Fig. 1. The nebula has a remarkable morphology that is similar in the [O iii] and H+[N ii] light. It is composed of an inner body with a mild bipolar morphology and an overall barrel shape of 14′′ side. We name it “inner lobes”. Unusual cone-shaped features protrude from the waist of the central body along the east-west direction. In addition, a second pair of fainter, truncated lobes extends along the north-south direction: we call them “outer lobes”. Along this direction very faint emission extends to as far as 30′′ from the centre on both sides. In the [O iii] image, at the end of the eastern cone-shaped protrusion, there is evidence of very faint emission with a fishtail shape. This might be similar to the structure observed in NGC 6369 (Schwarz, Corradi & Melnick, 1992), or the base of a third pair of larger and fainter lobes. All these features are labelled in Fig. 2. Altogether, IPHASXJ211420.0+434136 seems to be composed of two pairs of nested bipolar lobes (and perhaps a third one), seen edge-on, opened at their poles, with a mild “equatorial” waist, and all sharing the same symmetry axis.
Emission-line fluxes for the nebula were measured in the GTC spectra. A precise background subtraction is somewhat limited by the overlapping and inhomogenous emission of the extended nebulosities inside which IPHASXJ211420.0+434136 is projected on the sky. Looking at the emission line profiles along the slit (before and after background subtraction), it appears that the most affected line is the [O ii]3728 doublet. As this line also falls in a spectral region where the instrument sensitivity quickly drops, its highly uncertain flux measurement is not considered in the following analysis. Other lines affected by the background emission, although to a lesser extent, are the H i Balmer lines, [S ii] and [N ii]. Tab. 1 presents line fluxes measured by integrating the nebular emission covered by the spectrograph slits avoiding the inner 4 arcsec from the central star. All line fluxes are normalised to H=100 (for the red spectrum, first lines were normalised to H, and then H was normalised to H using the blue spectrum). The fact that the blue and red GTC spectra do not cover the same portion of the nebula might explain some differences in the fluxes of overlapping lines. The quoted errors on the observed fluxes include both the uncertainty in the flux of each line (Poissonian, detector and background noise) and in the determination of the instrumental sensitivity function, but do not include systematic errors introduced by the subtraction of the background.

| Ident. | Flux | |||
|---|---|---|---|---|
| Blue (P.A.=311∘) | Red (P.A.=281.5∘) | |||
| Obs. | Der. | Obs. | Der. | |
| [Ne iii]3869 | 36.50 (11) | 66.37 (19) | ||
| H i 3889 | 8.94 (14) | 16.06 (21) | ||
| [Ne iii]+H | 21.26 ( 7) | 36.49 (16) | ||
| H 4102 | 19.53 ( 6) | 30.92 (13) | ||
| C ii 4267⋆ | 2.36 (50) | 3.38 (51) | ||
| H 4340 | 36.14 ( 6) | 49.34 (10) | ||
| [O iii] 4363 | 5.62 (10) | 7.56 (13) | ||
| He i 4471 | 3.82 (15) | 4.81 (18) | ||
| 4645 blend | 9.28 (20) | 10.53 (22) | ||
| He ii 4686 | 63.52 ( 6) | 70.34 ( 6) | ||
| [Ar iv] 4711 | 3.74 (15) | 4.07 (18) | ||
| [Ar iv] 4740 | 2.08 (30) | 2.23 (33) | ||
| H 4861 | 100.00 ( 6) | 100.03 ( 6) | ||
| [O iii] 4959 | 188.80 ( 3) | 178.75 ( 3) | ||
| [O iii] 5007 | 575.28 ( 3) | 530.36 ( 4) | ||
| He ii 5411 | 7.30 (10) | 5.46 (13) | 6.03(6) | 4.51 (10) |
| He i 5876 | 31.92 ( 6) | 19.29 (14) | 30.34(4) | 18.33 (14) |
| [N ii] 6548 | 10.86 (10) | 5.06 (23) | 7.32(6) | 3.42 (21) |
| H 6563 | 655.71 ( 3) | 303.99 (20) | 655.65(3) | 304.00 (20) |
| [N ii] 6583 | 39.61 ( 6) | 18.23 (21) | 31.67(4) | 14.58 (21) |
| He i 6678 | 11.92 ( 6) | 5.31 (22) | 12.89(4) | 5.74 (22) |
| [S ii] 6716 | 11.90 ( 6) | 5.23 (22) | 8.04(6) | 3.53 (22) |
| [S ii] 6731 | 9.39 (10) | 4.11 (24) | 6.17(6) | 2.70 (23) |
| He i 7065 | 5.25 (32) | 2.07 (40) | 3.61(6) | 1.42 (25) |
| [Ar iii] 7136 | 33.78 ( 6) | 13.04 (26) | 27.83(4) | 10.75 (25) |
| [Ar iv]+He ii | 2.75(6) | 1.05 (26) | ||
| [O ii] 7320 | 9.32 (14) | 3.42 (30) | 9.15(7) | 3.36 (27) |
| [O ii] 7330 | 6.14 (14) | 2.25 (30) | 6.43(7) | 2.35 (27) |
| He ii 7592 | 2.54(6) | 0.87 (29) | ||
| [Ar iii] 7751 | 7.26(6) | 2.38 (30) | ||
| He ii 8237 | 6.28(6) | 1.85 (33) | ||
| H i 9015 | 6.73(9) | 1.72 (37) | ||
| [S iii] 9069 | 63.97(9) | 16.20 (37) | ||
⋆ Additional uncertainty as deblending from a faint nearby line was required.
The strong [O iii] and He ii lines in the GTC spectra confirm that IPHASXJ211420.0+434136 is indeed a planetary nebula of moderately high excitation. Its standard PN name is therefore PN G086.9–03.4. The nebular reddening was computed in the usual way from the hydrogen Balmer decrement using the H, H, H, and H lines. A weighted average value of (H)=0.950.25 is obtained using the reddening law of Fitzpatrick (2004) and 3.1, and adopting the electron density and temperature as determined below from the [S ii] and [O iii] lines, respectively. This corresponds to =2.00.6 mag. This (H) value was adopted to deredden the fluxes in Tab. 1: the quoted errors on the dereddened line fluxes include the uncertainty on the (H) value. Physical and chemical conditions in the gas were then computed with the same methodology as in Corradi et al. (2011), using the python-based PyNeb package (Luridiana, Morissett & Shaw, 2014). They are listed in Tab. 2. An electron density =12540 cm-3 is obtained from the [S ii] 6731/6717 line ratio. An electron temperature =13050850 K is determined from the [O iii] (5007+4959)/4363 ratio. The lack of measurement of the electron temperature for low-ionization stages, as well as substantial errors in the flux of several important emission lines, prevent a complete chemical analysis of the nebula, that is deferred to a future work. However, very interesting trends emerge from the analysis of the present spectra. The significant error in the helium abundance in Tab. 2 reflects the dispersion in the He i ionic abundances estimated from different lines. In particular, the ionic abundance estimated for the adopted from the (fainter) He i 4471 and 7065 lines is significantly smaller than the values obtained from the (stronger) He i 5876 and 6678 lines. This discrepancy might be relevant to understand the physical conditions in the nebula, as discussed in Sect. 4.2. For oxygen, nitrogen, and sulphur, the quoted errors mainly reflect possible different choices for the electron temperature of the low-excitation ions, taken either as computed from the [O iii] lines (see above), or adopting =10000 K using the recipes in Kingsburg & Barlow (1994) and Magrini et al. (2003). Note also that the O+ abundance, and hence the N+/O+ ratio, are determined using the [O ii] 7320,7330 doublet, that is quite sensitive to the adopted . Also, it tends to overestimate the O+ abundance compared to the [O ii] 3729,3729 doublet (see e.g. Milingo et al. 2010). It is therefore possible that the total oxygen abundance is lower than quoted in the table, and that (N/O) is higher.
In the blue spectrum, the C ii recombination line at 4267 Å line and a blend of lines around 4650 Å are detected (Fig. 3). Most likely they originate in the nebula, as their emission is clearly spatially extended and do not obviously appear in the nebula–subtracted spectrum of the central star (see Sect. 3.2). The 4650 blend is probably composed of O, N, and C recombination lines, but spectral resolution is too low to attempt a detailed identification. The strength of these recombination lines is unusual for such a low density nebula. For the above range of considered for low-ionization atoms, the flux of C ii4267 listed in Table 1 (but note the 50% error, due to its faintness plus the need to deblend from an even fainter redder line) would imply a remarkably high carbon abundance (Tab. 2). This is another potentially important datum (see Sect. 4.2).
| Physical conditions: | |
|---|---|
| ([S ii]) | 12540 cm-3 |
| ([O iii]) | 13050850 K |
| Abundances: | |
| He/H | 0.180.04 |
| (O/H)+12 | 8.250.15 |
| (S/H)+12 | 6.250.10 |
| (C++/H)+12† | 9.5 |
| (N+/O+) | 1.30.2 |
† From the uncertain measurement of the
C ii 4267 recombination line, see text
The nebula is a radio source detected by the NRAO VLA Sky Survey (Condon et al., 1998) with an integrated flux of 3.60.5 mJy at 1.4 GHz. It was not resolved by the radio beam, implying a size smaller than 74′′46′′. An average extinction can be estimated comparing the radio and H fluxes (cf. Pottasch, 1983, eq. IV-26). The observed integrated H flux of the nebula was estimated from the IPHAS images, using the DR2 photometric calibration (Barentsen et al., 2014). It is computed to be F(H)=8.5 10-13 erg cm-2 s-1, after removing the estimated contribution of the [N ii] doublet to the IPHAS images. Assuming that the radio emission is optically thin and that all the extinction is external to the object, we obtain (H)=1.230.30. This value is in fair agreement with the value deduced above from the Balmer decrement.
The GTC spectra lack the resolution needed to accurately measure the systemic velocity of the nebula. Nevertheless, using bright nebular lines relatively close to night-sky lines, we can conclude that there is no indication that IPHASXJ211420.0+434136 strongly deviates from the radial velocities expected for the Galactic rotation curve in the direction of the source.
3.2 The central star(s)
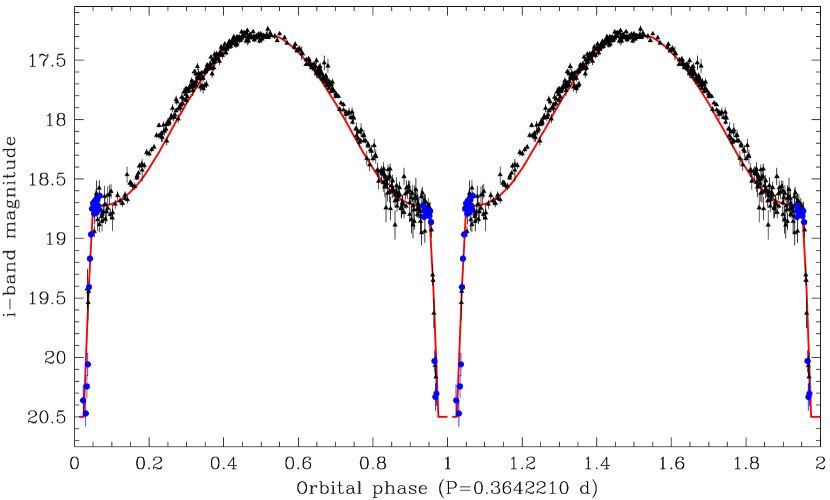
According to the IAU-approved IPHAS nomenclature, the central star should be named IPHASJ211420.03+434136.0. Its light curve in the SDSS –band from our own photometric monitoring, folded on the period of 8 hours and 44 minutes determined below, is shown in Fig. 4.
The light curve was determined as follows from observations obtained in several nights and different telescopes (see Sect. 2). Note that its determination is complicated by the presence of nearby stars, and in particular of a relatively bright one located 3′′.5 south of IPHASJ211420.03+434136.0. To avoid its contamination, all measurements obtained with a seeing worse than 1′′.7 were rejected. Data obtained with the smaller telescopes during eclipses were also not considered, because of their insufficient S/N ratio. The first photometric series, obtained at the IAC80 telescope on October 31, showed an eclipse with a duration of 50 min. On the following night, the light curve displayed a maximum. No observations in the same night contained two consecutive eclipses, and the length of the longest monitoring period with a recorded eclipse pointed to an orbital period in excess of four hours. Both a sine fit and an analysis-of-variance (AOV, Schwarzenberg-Czerny, 1996) periodogram of all the photometric observations (with the eclipses masked out) suggested a period of 8.74 hours. The fact that the first two observed eclipses (October 31 and November 23) were separated by an integer multiple of 8.74-h cycles, confirmed that this periodicity was the orbital period of the binary system. In order to compute an accurate linear ephemeris we measured the times of all available light-curve minima and eclipses (orbital phase 0), and maxima (orbital phase 0.5) by Gaussian fitting. Details are given in Table 3. The resulting ephemeris is:
where is the time of inferior conjunction of the companion star (i.e. the centre of the eclipse). The figures quoted in parentheses are the formal statistical errors (given in units of the last decimal place) of the linear fit to the timings shown in Table 3.
| Cycle () | |
| () | |
| 6597.51(1) | 0 |
| 6598.4113(6) | 2.5 |
| 6614.249(2) | 46 |
| 6620.445(2) | 63 |
| 6621.3569(7) | 65.5 |
| 6622.449(2) | 68.5 |
| 6643.3922(1) | 126 |
The light curve shows a deep eclipse (1.6 mag) at the minimum of an ample sinusoidal modulation (1.5 mag, among the largest found in PN central stars). The sampling during the eclipse is incomplete because, on the night when the 4.2m WHT was used, we switched to spectroscopic mode just after the end of the eclipse ingress in an attempt to obtain a 20–min spectrum of the non-irradiated side of the companion star. The signal on the spectrum was too faint to be useful, also because of the high background produced by the full moon in a night in which dust pollution was present in the atmosphere. However, the two photometric points closer to phase 1 suggest that the eclipse bottom was reached at an i-band magnitude between 20.4 and 20.5. The light curve of IPHASJ211420.03+434136.0 is similar to that of Hen 2-11 (Jones et al., 2014), but with a shorter period and a more pronounced luminosity variation. As in the latter, the interpretation is that an irradiated companion produces the sinusoidal part of the curve during its orbital motion (see e.g. Corradi et al., 2011), and a (total) eclipse of the hot post-AGB star occurs at inferior conjunction, when the companion faces us its non–irradiated hemisphere. If so, data imply that, at these red wavelengths, the luminosity ratio between the post-AGB star and the irradiated side of the companion is around one fourth at light curve maximum. On the contrary, at the minimum of the sinusoidal modulation (inferior conjunction), the post-AGB star would dominate the emission over the non-irradiated side of the companion by a factor of three. The luminosity of the irradiated side of the companion would be some fifteen times larger than the non-irradiated hemisphere: this implies that even at small orbital phases (0.1) the irradiated hemisphere dominates over the non-irradiated one, and therefore the latter can be properly studied only during the main eclipses. The shallow eclipse at light curve maximum indicates that only a small fraction of the projected surface of the companion is eclipsed by the compact post-AGB star.
Further insights can be gained by modelling the light curve using the nightfall222http://www.hs.uni-hamburg.de/DE/Ins/Per/Wichmann/Nightfall.html code. All parameters were varied over a wide range of physical solutions, with the best-fitting model being selected as the one with the lowest 2 fit to data. Given the large irradiation effect in the system, detailed reflection was employed in the modelling (with 3 iterations) in order to properly treat the irradiation of the secondary by the primary. A model atmosphere was used for the lower temperature (secondary) component with solar metallicity and g4.5 (Kurucz, 1993), and a blackbody for the primary. An illustrative model light curve is shown in Fig. 4 as a red solid line. The corresponding binary parameters (where index 1 refer to the post–AGB star, and 2 to the companion) are: T1=85 000 K, R1=0.11 R⊙, T2=4 000 K, R2=0.65 R⊙, =0.7, and i=90°. In general, a reasonable fit to the data is obtained, but the following cautionary points should be noted. First, there is a small but systematic deviation around quadratures, where we observe some excess light compared to the model. This might be related to the complex heating/diffusion process in such a highly irradiated star, that might not be fully treated by nightfall. Second, the fit of the eclipse is not entirely satisfactory, as the ingress and egress are “slower”, and the depth possibly larger, than indicated by the observations. If one tries to fit a shallower eclipse, then the model temperature of both stars significantly increases, and the mass ratio raises above unity towards unlikely large values. Therefore the binary parameters, and in particular the mass ratio, are loosely constrained by the present data, only limited to –band light curve. It is clear that additional observations, including photometry at other wavelengths, spectroscopy, and radial velocity studies, are needed to produce a robust model, and properly constrain the binary parameters.
The high orbital inclination from the fit, that is required in order to have eclipses, is consistent with the apparent morphology of the nebula if the axes of the orbit and the nebula coincide, as it has been found in other PNe with close binary central stars (e.g. Jones et al., 2012; Tyndall et al., 2012; Huckvale et al., 2013, and references therein).
According to the ephemeris above, the blue GTC spectrum of IPHASXJ211420.0+434136 was taken at orbital phase between 0.06 and 0.09, i.e. right after the end of the eclipse of the hot post-AGB star. On the contrary, the red GTC spectrum was taken at phase between 0.87 and 0.90, i.e. symmetrically to the blue spectrum and right before the eclipse. At these phases, no radial velocity shifts due to the orbital motion can be detected at the low resolution of our GTC spectra. In these orbital configurations, following the discussion above the emission from the stellar system would be mainly due to the hot post-AGB star, with a smaller contribution of the companion. The observed stellar spectrum, after nebular subtraction, is relatively flat and basically featureless. No absorption lines of H i, He i or He ii from the ionizing post-AGB star are detected, but they are strongly affected by the subtraction of the corresponding nebular emission lines at the limited spectral resolution of the present observations. The typical emission lines from the irradiated hemisphere of the companion such as the 4650 Å blend (see e.g. Corradi et al., 2011) are not seen either. And, finally, no obvious stellar feature from the cooler side of the companion is detected. New observations, at higher spectral resolution and at various orbital phases, are needed to directly investigate the central stars.
3.3 Distance, mass, and spectral energy distribution
The available data only allow a rough distance determination for IPHASXJ211420.0+434136. A first estimate can be done using the relation between the H surface brightness and radius of the nebula by Frew & Parker (2006). A distance of 51 kpc is found by adopting the relation suitable for PNe with close binary central stars. A similar result, 5.6 kpc, is obtained using the Shklovsky/Daub statistical method as calibrated by Stanghellini, Shaw & Villaver (2008).
An alternative distance estimate can be obtained from the spectral type of the companion, if we assume the (uncertain) stellar temperature derived from modelling the light curve. This would indicate a late–K spectral type for the secondary (Boyajan et al., 2013). From the light curve, we find that the apparent luminosity of the night-side hemisphere of the companion is i=20.4 mag, or i=19.1 after dereddening. Using the intrinsic colours and absolute magnitude of K dwarfs from Bilir et al. (2009), we obtain a distance of 2.5 kpc.
For a distance 5 kpc, and adopting a standard value of 0.4 for the filling factor, the ionized mass of the nebula is then estimated to be 10-1 M⊙.
Fig. 5 shows the Spectral Energy Distribution (SED) of the object. The IPHAS and UKIDDS-K data (0.6 to 2.1 m) correspond to the central star(s) whereas all other IR data (WISE W2, W3, W4, and the AKARI 90 m flux) correspond to the extended nebula. Note that 2MASS J, H and Ks, and WISE W1 fluxes are not included in the figure because they mostly originate from the field star 3′′.5 SW of IPHASJ211420.03+434136.0. The 1.4 GHz radio flux from Condon et al. (1998) is also plotted. The SED in the IR region is very broad, indicating a range of dust temperatures, and it shows a maximum around 70 m; both are normal characteristics of PNe (c.f. Anderson et al., 2010). Indeed, the WISE W2–W4 and W3–W4 colours are typical of PNe, and very dissimilar to those of young stellar objects and symbiotic stars, confirming the nature of IPHASXJ211420.0+434136 as a PN. The temperature of the coldest detected dust grains can be estimated from the 22 and 90 m fluxes and is around 80 K (solid line in the figure). The measured total flux, integrating below the SED from 0.6 to 90 m, is 5.5 10-11 erg cm-2 s-1 and it increases to 1.3 10-10 erg cm-2 s-1 if the expected fluxes from a 80 K blackbody longward of 90 m are included. For a distance of 5 kpc, the latter value would imply a total luminosity L100 L⊙, the limit coming from the fact that a substantial population of colder dust grains, with a large FIR-submm contribution to the SED, are generally expected in PNe.

4 Discussion
The short orbital period of IPHASJ211420.03+434136.0 indicates that, during the red-giant phase of the star that has produced the PN, the system went through a common-envelope (CE) phase that resulted in the shrinkage of the orbit to the current size (Paczynski, 1976; Iben & Livio, 1993). The CE phase is generally thought to end with a stellar merger or the complete ejection of the stellar envelope, but the process and its timescales are utterly unknown (Ivanova et al., 2013).
Post-CE PNe are key objects to better understand CE evolution. In particular, the two most relevant aspects of the present observations are: i) the nebular morphology, which provides information about the history and geometry of the CE ejection process, and ii) the nebular chemistry, which in principle allows discussion of the whole evolution of the systems, because it depends on the original chemical content of the stellar progenitors, on the chemical enrichment during stellar evolution, and on the effects of the binary interactions.
4.1 CE ejection
Concerning morphology, the message given by IPHASXJ211420.0+434136 is a clear one: its multiple pairs of lobes seem to indicate that the (common?) envelope was ejected in at least two distinct episodes. Similar cases are M 2-19 and Abell 41 (Miszalski et al., 2009b) – although for the latter no kinematical identification of distinct outflows has been obtained (Jones et al., 2010) – and perhaps ETHOS1 (Miszalski et al., 2011). In other post-CE PNe there is evidence of pre-CE mass loss, mainly in the form of light jets likely ejected by accreting companions, the Necklace nebula being the most convincing case (Corradi et al., 2011; Miszalski, Boffin & Corradi, 2013; Tocknell, De Marco & Wardle, 2014). But these jets are secondary morphological components as most of the mass is in the inner bodies of the nebulae. On the contrary, in IPHASXJ211420.0+434136 two apparently distinct, major bipolar outflows are found. If this is confirmed by the kinematical analysis of the nebula, that is needed to determine the ages of each bipolar outflow, IPHASXJ211420.0+434136 would add puzzling information about the mass loss processes during CE evolution, opening the possibility that the CE is ejected in distinct episodes. Alternatively, the outer pair of lobes could have been produced before the CE phase, for instance as an ablation flow left behind by a jet that has now vanished. Indeed, the truncated outer lobes of IPHASXJ211420.0+434136 are similar to those observed in several pre-PNe, whose formation is often ascribed to the action of jets (Balick et al., 2014). Another possibility is that the two pairs of lobes are practically coeval, as in the case of the symbiotic nebula Hen 2–104 (Corradi et al., 2001), a result that is however difficult to explain theoretically. The additional possibility that the apparent double pair of lobes in IPHASXJ211420.0+434136 are just the result of an excitation gradient, as suggested in the case of M 2–9 (Smith, Balick & Gehrz, 2005), is instead less likely. In any case, the mild bipolar morphology of IPHASXJ211420.0+434136 and similar post-CE PNe can be produced by fast winds (either isotropic or collimated) impinging on flattened mass distributions with modest equatorial–to–polar density contrasts (Icke, Preston & Balick, 1989). Such a geometry is expected in the CE ejection process (Sandquist et al., 1998), or can be easily produced right before it during a period of stable Roche-lobe mass transfer onto the companion, or by gravitational focussing of the AGB progenitor when the binary system was much wider (Mastrodemos & Morris, 1999).
4.2 Hints on the chemistry of post–CE nebulae
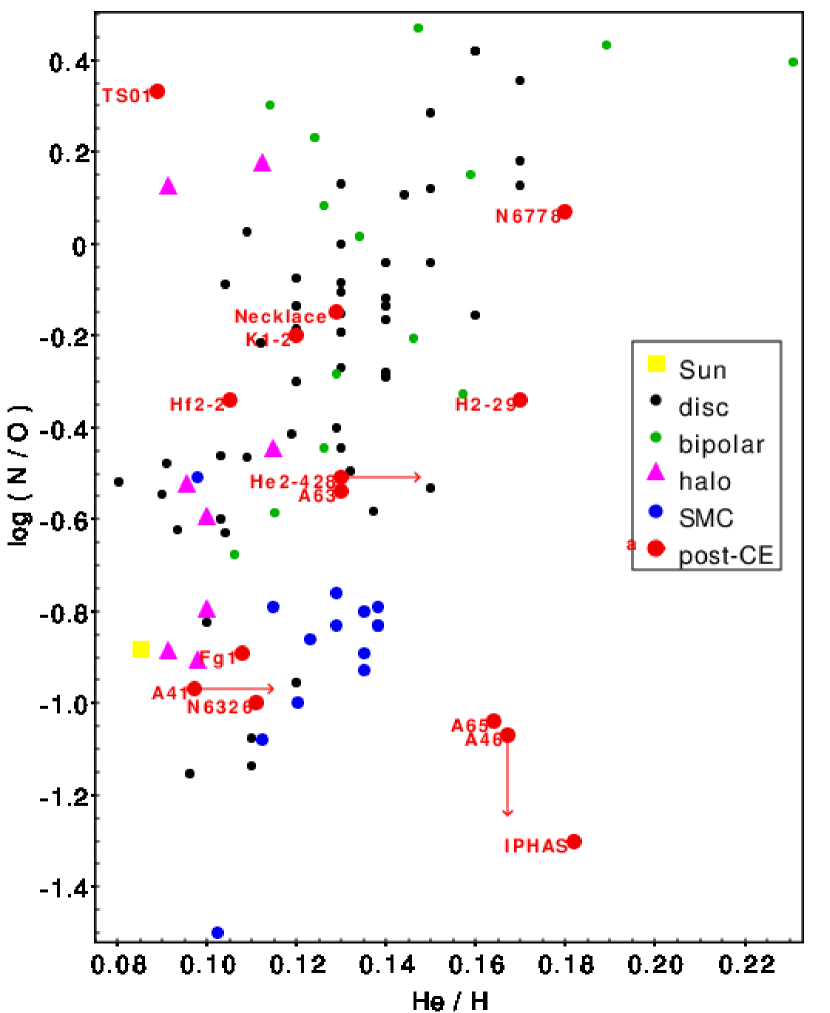
Standard analysis of the GTC spectra seems to indicate that IPHASXJ211420.0+434136 has peculiarly low sulphur and nitrogen abundances, but a high helium (and perhaps carbon) content. In general, information about the chemical abundances of post–CE PNe is sparse, and in several cases quite uncertain because many of these nebulae have a low surface brightness. Fig. 6 shows the relation of two abundance ratios that do not suffer from large uncertainties as other elemental abundances: N/O, commonly assumed to be equal to the observed N+/O+, vs. He/H. They are indicated for a sample of fourteen post-CE PNe taken from the articles of Kingsburg & Barlow (1994); Pollacco & Bell (1997); Exter, Pollacco & Bell (2003); Liu et al. (2006); Rodríguez, Corradi, & Mampaso (2001); Perinotto, Morbidelli & Scatarzi (2004); Górny et al. (2009); Stasińska et al. (2010); Milingo et al. (2010); Corradi et al. (2011); and this study for IPHASXJ211420.0+434136. These post–CE nebulae are indicated in the figure by full (red) circles. Their abundances are compared to representative samples of PNe, as indicated in the legenda of the figure: “classical bipolars”333See Corradi & Schwarz (1995) for their definition. from Perinotto & Corradi (1998); Galactic disc PNe from the works of Henry et al. (2010) and Milingo et al. (2010); Galactic halo PNe from Howard, Henry & McCartney (1997); and SMC PNe from Shaw et al. (2010).
The figure suggests that a considerable fraction of post–CE PNe have distinctive properties compared to the bulk of Galactic PNe. TS 01 is a Galactic halo PN with a double–degenerate binary central star which holds the record of being the most oxygen–deficient PN (Stasińska et al., 2010), where part of its depletion being likely related to the binary evolution. About half of the other thirteen post–CE nebulae have low N/O ratios444This also applies to the other post-CE PNe M 2–19 and M 3–19, which are not included in the figure because their He/H abundance is uncertain (Cuisinier et al., 2000). compared to the bulk of Galactic disc PNe and, in spite of the fact that many of them have a highly collimated morphology, lower than classical bipolars. A prime example is M 2–19 that has a bipolar PN and a post-CE central star (Miszalski et al., 2008). On the contrary, their He/H abundance is in the range of average PNe, and in some of them is remarkably high, He/H0.16. The increase in N/O that accompanies the He/H overabundances in classical bipolars is therefore not observed in most post-CE PNe. Their lowest N/O ratios are only comparable to that of the SMC PNe. In this respect, the low sulphur content of IPHASXJ211420.0+434136 is also found in several other post-CE PNe (Kingsburg & Barlow, 1994; Pollacco & Bell, 1997; Rodríguez, Corradi, & Mampaso, 2001; Exter, Pollacco & Bell, 2003), and again is within the range displayed by the low-metallicity SMC and Galactic halo PNe.
Carbon deserves an additional comment. Even if obtained from an uncertain flux measurement, the large C++ abundance of IPHASXJ211420.0+434136 calls the attention because similar results were obtained for the other binary PNe A 46 and A 63 (Pollacco & Bell, 1997), and Hf 2–2 (Liu et al., 2006). If the abundance from the C ii 4267 recombination line is compared to the one computed from the [O iii] collisionally excited lines, we derive C++/O++=35, which transforms into a C/O ratio between 23 and 32 using the icf values by Delgado–Inglada, Morisset & Stasińska (2014). Such a ratio is larger by almost one order of magnitude than expected in any carbon-rich (single) AGB precursor. However, it is well known that in photoionized nebulae optical recombination lines (ORLs) provide abundance values that are systematically larger than those obtained using collisionally excited lines (CELs). The so-called abundance discrepancy factor (adf) is usually between 1.5 and 3 (see e.g. García–Rojas & Esteban, 2007; Liu, 2012), but in PNe it has a significant tail extending to much larger values. In particular, it is striking that the Galactic PN with the largest known adf, around 70, is the aforementioned post–CE PN Hf 2–2 (Liu et al., 2006). In that nebula, recombination lines, including those of H and He, mainly come from a cold (1000 K), high metallicity nebular component whose mass in metals, in that specific object, is comparable to that of the hotter gas where CELs are produced.
The case of Hf 2–2 suggests that a similar physical situation (and comparably large adf values) might also apply to IPHASXJ211420.0+434136 and the other post–CE nebulae that display anomalously high C++ abundances from the C ii 4267 line. Existing spectra do not allow to thoroughly test this hypothesis, as no O recombination lines can be safely identified and used555The 4645 Å blend (Fig. 3) is likely to be a mixture of O, N, and perhaps C lines, and significant NLTE effects could occur.. However, in the case of IPHASXJ211420.0+434136 (but not A 46 and A 63, Pollacco & Bell, 1997), in addition to its large C++ abundance, the discrepancy between the He+ ionic abundances from different lines obtained adopting ([O iii]) would also support the existence of a cold ionized nebular component. Indeed, if the He i 5875/4471 and He i 6678/4471 line ratios are inserted in the diagnostic diagram of Figure 4 of Liu et al. (2006), 103 is estimated for the He i emitting region (but note that the measurement of the flux of He i 4471 has a non-negligible error). If such a double nebular component is present in IPHASXJ211420.0+434136 as well, the determination of the reddening and of all elemental abundances would be severely affected. The sub-solar abundances computed from CELs for IPHASXJ211420.0+434136 may then be a spurious result, as it was shown for oxygen in Hf 2–2 (Liu et al., 2006).
Summarising, even if existing data are of limited quality, there is tempting indication that a significant fraction of post–CE PNe have a peculiar chemistry. They might point to low-metallicity progenitors, perhaps with some additional peculiarities (such as a sometimes remarkably high He content) related to the binary evolution. However, the well-studied case of Hf 2–2 (Liu et al., 2006), and the preliminary analysis of IPHASXJ211420.0+434136 and a couple of other PNe, suggests that a correct chemical analysis requires a thorough investigation of abundances from ORLs and a deep look at the abundance discrepancy problem in these objects.
4.3 Nebular mass
A related, relevant property might be the very small ionized mass – between 10-3 and 10-1 M⊙ – estimated in the post-CE nebulae A 63 and A 46 (Bell, Pollacco & Hilditch, 1994), Hf 2–2 (Liu et al., 2006), and IPHASXJ211420.0+434136 (all them, with the apparently large C++ abundances discussed above). This is also supported by the systematically lower luminosity of post–CE nebulae in the surface brightness-radius relation of Frew (2008), compared to the whole sample of Galactic PNe. This would imply that the stellar envelope in the CE phase is very small, either because of a low initial stellar mass, or because much of the envelope was lost or transferred to the companion before the CE event, during a long-lasting, stable mass-transfer phase. The latter hypothesis seems to apply to another post–CE PN, the Necklace nebula, whose stellar progenitor is supposed to be a carbon AGB star (therefore relatively massive, 2 M⊙, Corradi et al. 2011; Miszalski, Boffin & Corradi 2013), but the ionized mass of the nebula is estimated to be only 0.1 M⊙, and there is evidence of conspicuous pre-CE mass transfer onto the companion. A small nebular mass may also facilitate the detection of (also small) high metallicity components that are often invoked to be at the origin of the abundance discrepancy.
5 Summary and perspectives
We have presented nebular spectroscopy and the light curve of the new post-CE PN IPHASXJ211420.0+434136.
The nebula has a remarkable morphology, suggesting the occurrence of multiple ejection events in the CE phase. As mentioned above, the key to recover the mass loss history constraining the CE (and pre-CE) evolution, is to study the nebular dynamics via spatially resolved high-resolution spectroscopy.
The chemical abundances of IPHASXJ211420.0+434136 and other similar PNe are also very interesting. Together with the evidence for low ionized masses, the observed abundances seem to point to low-mass progenitors for a significant fraction of post–CE nebulae. In addition, we suggest that several post-CE PNe may have large adf values, as shown for Hf 2–2 by Liu et al. (2006). One possible explanation is that accretion onto a companion lightens the common envelope, producing a low mass PN where the ORL emitting regions are more readily revealed.
The potential of these results calls for additional work, both observational and theoretical. Detailed modelling of the emission nebulae is needed to determine the gas mass involved at any stage around the CE phase. This methodology has not been applied systematically to this kind of PNe. To reach this goal, model-independent distance determinations (as provided for instance by extinction distances, or obtained from modelling of the stellar atmospheres) are also required. The chemistry of IPHASXJ211420.0+434136 and other post-CE PNe also needs to be better determined, with deep spectroscopic observations and detailed photoionization modelling. The increasing evidence of a peculiar nebular chemistry and the possible link with the abundance discrepancy problem make this research line particularly attractive.
Finally, the eclipsing nature of IPHASJ211420.03+434136.0 makes it a favourable target to determine the stellar parameters via spectroscopy at specific orbital phases, and in particular the stellar masses via radial velocity studies. With the global information of the binary system, one could then try to reconstruct its entire evolution.
Acknowledgments
Based on observations obtained with: the 10.4m Gran Telescopio Canarias (GTC), the 4.2m WHT and the 2.5m INT telescopes of the Isaac Newton Group of Telescopes, the 2.6m Nordic Optical Telescope operated by NOTSA, and the 0.8m IAC80 telescope, operating on the islands of La Palma and Tenerife at the Spanish Observatories of the Roque de Los Muchachos and Teide of the Instituto de Astrofísica de Canarias. Also based on observations with the 0.6m telescope at Tartu Observatory (Estonia). Some of the data were obtained with ALFOSC, which is provided by the Instituto de Astrofísica de Andalucía under a joint agreement with the University of Copenhagen and NOTSA. We are grateful to the time allocation committee (CAT) for awarding us Director Discretionary Time at the WHT on December 16, 2013.
We thank Pedro A. González Morales, Cristina Zurita and Olga Zamora for taking some of the photometric observations. We also thank Geert Barentsen, Janet Drew, and Mike Barlow for their help in determining the IPHAS photometry of the nebula. Finally, we thank the referee, Orsola De Marco, for her suggestions to improve the content of the article.
RLMC and AM acknowledge funding from the Spanish AYA2012-35330 grant. PRG is supported by a Ramón y Cajal fellowship (RYC–2010–05762), and acknowledges support provided by the Spanish AYA2012–38700 grant. TE and TL acknowledge support by a targeted financing project SF00600399S08 of the Estonian Ministry of Education and Research.
References
- Acker & Le Dû (2014) Acker A., Le Dû P., 2014, L’Astronomie, n. 68, p. 40
- Acker et al. (1992) Acker A., Marcout J., Ochsenbein F., Stenholm B., Tylenda R., Schohn C., 1992, The Strasbourg-ESO Catalogue of Galactic Planetary Nebulae. Parts I, II
- Acker et al. (2012) Acker A., Boffin H.M.J., Outters N., Miszalski B., Sabin L., Le Du P., Alves F., 2012, Rev. Mexicana Astron. Astrof. 48, 223
- Anderson et al. (2010) Anderson L.D., Zavagno A., Barlow M.J., García-Lario P., Noriega-Crespo A., 2012, A&A, 537, A1
- Balick et al. (2014) Balick B. et al. 2014, ApJ, in preparation
- Barentsen et al. (2014) Barentsen, G. et al., 2014, MNRAS, in preparation
- Bell, Pollacco & Hilditch (1994) Bell S.A., Pollacco D.L., Hilditch R.W., 1994, MNRAS, 270, 449
- Bilir et al. (2009) Bilir S., Karaali S.Ak., Coskunoglu K.B., Yaz E., Cabrera–Lavers A., 2009, MNRAS, 396, 1589
- Bond (2000) Bond H.E, 2000, in Asymmetrical Planetary Nebulae III: from origins to microstructures”, ASP Conf. Ser., Vol. 199, p. 115
- Boyajan et al. (2013) Boyajian T.S. et al., 2013, ApJ, 771, 40
- Condon et al. (1998) Condon J.J., Cotton W.D., Greisen E.W., Yin Q.F., Perley R.A., Taylor G.B., Broderick, J.J., 1998, AJ, 115, 1693
- Corradi & Schwarz (1995) Corradi R.L.M., Schwarz H.E., 1995, A&A, 293, 871
- Corradi et al. (2001) Corradi R.L.M., Livio M., Balick B., Munari U., Schwarz H.E., 2001, ApJ, 553, 211
- Corradi et al. (2011) Corradi R.L.M. et al., 2011, MNRAS, 410, 1349
- Cuisinier et al. (2000) Cuisinier F., Maciel W.J., Köppen J., Acker A., Stenholm B., 2000, A&A, 353, 543
- Delgado–Inglada, Morisset & Stasińska (2014) Delgado–Inglada G., Morisset C., Stasińska G., 2014, MNRAS, submitted
- De Marco et al. (2007) De Marco O., Wortel S., Bond H.E., Harmer D., 2007, in “Asymmetrical Planetary Nebulae IV”, published online at http://www.iac.es/proyect/apn4, #75
- De Marco et al. (2013) De Marco O., Passy J.-C., Frew D.J., Moe M., Jacoby G.H., 2013, MNRAS, 428, 2118
- Drew et al. (2005) Drew J. et al., 2005, MNRAS, 362, 753
- Exter, Pollacco & Bell (2003) Exter K.M., Pollacco D.L., Bell S.A., 2003, MNRAS, 341,1349
- Fitzpatrick (2004) Fitzpatrick E. L., 2004, in ASP Conf. Ser., Vol. 309, Astrophysics of Dust, A.N. Witt, G.C. Clayton & B.T. Draine eds., p. 33
- Frew (2008) Frew D.J., 2008, PhD Thesis, Macquarie University, Sydney, Australia
- Frew & Parker (2006) Frew D.J., Parker Q.A., 2006, in IAU Symp. 234, Planetary Nebulae in our Galaxy and Beyond, M.J. Barlow & R.H. Mendez eds., p. 49
- García–Rojas & Esteban (2007) García–Rojas J., Esteban C., 2007, ApJ, 670, 457
- Górny et al. (2009) Górny S.K., Chiappini C., Stasińska G., Cuisinier F., 2009, A&A, 500, 1089
- Henry et al. (2010) Henry R.C.B., Kwitter K.B., Jaskot A.E., Balick B., Morrison M.A., Milingo J.B., 2010, ApJ, 724, 748
- Howard, Henry & McCartney (1997) Howard J.W., Henry R.C.B., McCartney S., 1997, MNRAS, 284, 465
- Huckvale et al. (2013) Huckvale L. et al., 2013, MNRAS, 434, 1505
- Iben & Livio (1993) Iben I.Jr., Livio M., 1993, PASP, 105, 1373
- Icke, Preston & Balick (1989) Icke V., Preston H.L., Balick B., 1989, AJ, 97, 462
- Ivanova et al. (2013) Ivanova N., et al., 2013, A&ARv, 21, 59
- Jones et al. (2010) Jones D. et al., 2010, MNRAS, 408, 2312
- Jones et al. (2012) Jones D., Mitchell D.L., Lloyd M., Pollacco D., O’Brien T.J., Meaburn J., Vaytet N.M.H., 2012, MNRAS, 420, 2271
- Jones et al. (2014) Jones D., Boffin H.M.J., Miszalski B., Wesson R., Corradi R.L.M., Tyndall A.A., 2014, A&A, 562, A89
- Kingsburg & Barlow (1994) Kingsburgh R.L., Barlow M.J., 1994 MNRAS, 271, 257
- Kurucz (1993) Kurucz R.L., 1993, VizieR Online Data Catalog, 6039, 0
- Liu (2012) Liu X.W., 2012, in IAU Symp. 283, Planetary Nebulae: An Eye to the Future, Manchado, A. Stanghellini, L. & Schönberner, D. eds., p. 131
- Liu et al. (2006) Liu X.W., Barlow M.J., Zhang Y., Bastin R.J., Storey P.J., 2006, MNRAS, 368, 1959
- Luridiana, Morissett & Shaw (2014) Luridiana V., Morissett C., Shaw R.A., 2014, A&A, in preparation
- Magrini et al. (2003) Magrini L., Perinotto M., Corradi R.L.M., Mampaso A., 2003, A&A, 400, 511
- Mastrodemos & Morris (1999) Mastrodemos N., Morris M., 1999, ApJ, 523, 357
- Milingo et al. (2010) Milingo J.B., Kwitter K.B., Henry R.C.B., Souza S.P., 2010, ApJ, 711, 619
- Miszalski et al. (2008) Miszalski B., Acker A., Moffat A.F.J., Parker Q.A., Udalski A., 2008, A&A, 488, L79
- Miszalski et al. (2009a) Miszalski B., Acker A., Moffat A.F.J., Parker Q.A., Udalski A., 2009a, A&A, 496, 813
- Miszalski et al. (2009b) Miszalski B., Acker A., Parker Q.A., Moffat A.F.J., 2009b, A&A, 505, 249
- Miszalski et al. (2011) Miszalski B., Corradi R.L.M., Boffin H.M.J., Jones D., Sabin L., Santander-García M., Rodríguez-Gil P., Rubio-Díez M.M., 2011, MNRAS, 413, 1264
- Miszalski, Boffin & Corradi (2013) Miszalski B., Boffin H.M.J., Corradi R.L.M., 2013, MNRAS, 428, L39
- Morris (1987) Morris M., 1987, PASP, 99, 1115
- Nordhaus & Blackman (2006) Nordhaus J., Blackman E.G., 2006, MNRAS, 370, 2004
- Oke (1990) Oke J. B., 1990, AJ, 99, 1621
- Paczynski (1976) Paczynski B., 1976, in IAU Symp. No. 73, Structure and Evolution of Close Binary Systems, P. Eggleton, S. Mitton & J. Whelan eds., p.75
- Perinotto & Corradi (1998) Perinotto M., Corradi R.L.M., 1998, A&A, 332, 721
- Perinotto, Morbidelli & Scatarzi (2004) Perinotto M., Morbidelli L., Scatarzi A., 2004, MNRAS, 349, 793
- Pollacco & Bell (1997) Pollacco D.L., Bell S.A., 1997, MNRAS, 284, 32
- Pottasch (1983) Pottasch S., 1984, In Planetary Nebulae, ISBN 90-277-1672-2, Astrophysics & Space Science Library, vol. 107
- Rodríguez, Corradi, & Mampaso (2001) Rodríguez M., Corradi R.L.M., Mampaso A., 2001, A&A, 377, 1042
- Sandquist et al. (1998) Sandquist E.L., Taam R.E., Chen X., Bodenheimer P., Burkert A., 1998, ApJ, 500, 909
- Santander-García et al. (2013) Santander-García M., et al., 2014, A&A, in preparation
- Schwarz, Corradi & Melnick (1992) Schwarz H.E., Corradi R.L.M., Melnick J., 1992, A&AS, 96, 23
- Schwarzenberg-Czerny (1996) Schwarzenberg–Czerny A., 1996, ApJ, 460, L107
- Shaw et al. (2010) Shaw R.A. et al., 2010, ApJ, 717, 562
- Smith, Balick & Gehrz (2005) Smith N., Balick B., Gehrz R.D., 2005, AJ, 130, 853
- Soker (1997) Soker N., 1997, ApJS, 112, 487
- Stanghellini, Shaw & Villaver (2008) Stanghellini L., Shaw R.A., Villaver E., 2008, ApJ, 689, 194
- Stanghellini et al. (2009) Stanghellini L., Lee T.–H., Shaw R.A., Balick B., Villaver E., 2009, ApJ, 702, 733
- Stasińska et al. (2010) Stasińska G. et al., 2010, A&A, 511, A44
- Tyndall et al. (2012) Tyndall A.A., Jones D., Lloyd M., O’Brien T.J., Pollacco D., 2012, MNRAS, 422, 1804
- Tocknell, De Marco & Wardle (2014) Tocknell J., De Marco O., Wardle M., 2014, MNRAS, 439, 2014
- Vassiliadis & Wood (1994) Vassiliadis E., Wood P.R, 1994, ApJS, 92, 125
- Van Wickel et al. (2014) Van Wickel H., Jorissen A., Exter K., Raskin G., Prins S., Perez-Padilla J, Merges F., Pessemier W., 2014, A&A, preprint (arXiv:1403.2605)
- Zuckerman, Becklin & McLean (1991) Zuckerman B., Becklin E.E., McLean, I.S., 1991, ASP Conf. Ser., Vol. 14, p. 161