Observed Consequences of Presupernova Instability in Very Massive Stars
Abstract
This chapter concentrates on the deaths of very massive stars, the events leading up to their deaths, and how mass loss affects the resulting death. The previous three chapters emphasized the theory of wind mass loss, eruptions, and core collapse physics, but here we emphasize mainly the observational properties of the resulting death throes. Mass loss through winds, eruptions, and interacting binaries largely determines the wide variety of different types of supernovae that are observed, as well as the circumstellar environments into which the supernova blast waves expand. Connecting these observed properties of the explosions to the initial masses of their progenitor stars is, however, an enduring challenge and is especially difficult for very massive stars. Superluminous supernovae, pair instability supernovae, gamma ray bursts, and “failed” supernovae are all end fates that have been proposed for very massive stars, but the range of initial masses or other conditions leading to each of these (if they actually occur) are still very certain. Extrapolating to infer the role of very massive stars in the early universe is essentially unencumbered by observational constraints and still quite dicey.
1 Introduction
As discussed in previous chapters (Vink, Owocki), two critical aspects in the evolution of very massive stars (VMSs) are that their high luminosities cause strong mass loss in radiation-driven winds, and that high luminosities can also cause severe instabilities in the stellar envelope and interior as the star approaches the Eddington limit. These features become increasingly important as the initial stellar mass increases, but especially so as the star evolves off the main sequence and approaches its death. Moreover, the two are interconnected, since mass loss will increase the star’s luminosity/mass ratio, possibly leading to more intense instabilities over time.
It should not be surprising, then, that VMSs show clear empirical evidence of this instability, and this chapter discusses various observational clues that we have. This is a particularly relevant topic, as time-domain astronomy is becoming an increasingly active field of observational research. Throughout, the reader should remember that we are focussed on observed phenomena, and that working backward to diagnose possible underlying physical causes is not always straightforward. Hence, this interpretation is where most of the current speculation and debate rests among researchers working in the field. Stellar evolution models make predictions for the appearance of single massive stars late in their lives, but the influence of binary interaction may be extremely important or even dominant (Langer 2012), and the assumptions about mass-loss that go into the single-star models are not very reliable (Smith 2014). In particular, the eruptive instabilities discussed in this chapter are not included in single-star evolution models, and as such, these models provide us with little perspective for understanding the very latest unstable phases of VMSs or their final fates. The loosely bound envelopes that result from a star being close to the Eddington limit may be an important factor in directly causing outbursts, but having a barely bound envelope may also make it easier for other mechanisms to be influential, such as energy injection from non-steady nuclear burning, precursor core explosions, or binary interactions (see e.g., Smith & Arnett 2014 for a broader discussion of this point).
In the sections to follow, we discuss the observed class of eruptive luminous blue variables (LBVs) that have been linked to the late evolutionary phases of VMSs, various types of very luminous supernovae (SNe) or other explosions that may come from VMSs, and direct detections of luminous progenitors of SNe (including a few actual detections of pre-SN eruptions) that provide a link between VMSs and their SNe.
2 LBVs and their Giant Eruptions
Perhaps the most recognizable manifestation of the instability that arises in the post-main-sequence evolution of VMSs is the class of objects known as luminous blue variables (LBVs). These were recognized early-on as the brightest blue irregular variables in nearby galaxies like M31, M33, and NGC 2403 (Hubble & Sandage 1953; Tammann & Sandage 1968), and these classic examples were referred to as the “Hubble-Sandage variables”. Later, Conti (1984) recognized that many different classes of hot, irregular variable stars in the Milky Way and Magellanic clouds were probably related to these Hubble-Sandage variables, and probably occupy similar evolutionary stages in the lives of massive stars, so he suggested that they be grouped together and coined the term “LBV” to describe them collectively. The LBVs actually form a rather diverse class, consisting of a wide range of irregular variable phenomena associated with evolved massive stars (see reviews by Humphreys & Davidson 1994; van Genderen 2001; Smith et al. 2004, 2011a; Van Dyk & Matheson 2012; Clark et al. 2005).
2.1 Basic observed properties of LBVs
In addition to their high luminosities, some of the key observed characteristics of LBVs are as follows (although beware that not all LBVs exhibit all these properties):
-
•
S Doradus eruptions. Named after the prototype in the LMC, S Dor eruptions are seen as a brightening that occurs at visual wavelengths resulting from a change in apparent temperature of the star’s photosphere; this causes the peak of the energy distribution to shift from the UV to visual wavelengths at approximately constant bolometric luminosity. The increase in visual brightness (i.e. 1–2 mag, typically for more luminous stars) corresponds roughly to the bolometric correction for the star, so that hotter stars exhibit larger amplitudes in their S Dor events. LBVs have different temperatures in their quiescent state, and this quiescent temperature increases with increasing luminosity. The visual maximum of S Dor eruptions, on the other hand, usually occurs at a temperature around 7500 K regrdless of luminosity, causing the star to resemble a late F-type supergiant with zero bolometric correction (see Figure 1). While these events are defined to occur at constant bolometric luminosity (Humphreys & Davidson 1994), in fact quantitative studies of classic examples like AG Car do reveal some small varition in through the S Dor cycle (Groh et al. 2009). Similarly, the traditional explanation for the origin of the temperature change was that the star increases its mass-loss rate, driving the wind to very high optical depth and the creation of a pseudo photosphere (Humphreys & Davidson 1994; Davidson 1987). Quantitative spectroscopy reveals, however, that the measured mass-loss rates do not increase enough to cause a pseudo photosphere in classic S Dor variables like AG Car (de Koter et al. 1996), and that the increasing photospheric radius is therefore more akin to a true expansion of the star’s photosphere (i.e., a pulsation). Possible causes of this inflation of the star’s outer layers is discussed elsewhere in this book (see Owocki’s chapter). LBVs that experience these excursions are generally thought to be very massive stars, but their mass range is known to extend down to around 25 (Smith et al. 2004).

Figure 1: The upper HR Diagram of LBVs and some LBV candidates (from Smith, Vink, & de Koter 2004). The most massive LBVs and LBV candidates like Car and the Pistol star are off the top of this diagram. The diagonal strip where LBVs reside at quiescence is the S Dor instability strip discussed in the text. Note that LBVs are recognized by their characteristic photometric variability down to luminosities where the S Dor instability strip meets the eruptive temperature. -
•
Quiescent LBVs reside on the S Dor instability strip. As noted in the previous point, LBVs all show roughly the same apparent temperature in their cool/bright state during an outburst, but they have different apparent temperatures in their hot/quiescent states. These hot temperatures are not random. In quiescence, most LBVs reside on the so-called “S Dor instability strip” in the HR Diagram (Wolf 1989). This is a diagonal strip, with increasing temperature at higher luminosity (see Figure 1). Notable examples that do not reside on this strip are the most luminous LBVs, like Car and the Pistol star, so the S Dor instability strip may not continue to the most massive and most luminous stars, for reasons that may be related to the strong winds in these VMSs (see Vink chapter). Many of the stars at the more luminous end of the S Dor instability strip are categorized as Ofpe/WN9 or WNH stars in their hot/quiescent phases, with AG Car and R127 being the classic examples where these stars are then observed to change their spectral type and suffer bona-fide LBV outbursts. There are also many Ofpe/WN9 stars in the same part of the HR Diagram that have not exhibited the characteristic photometric variability of LBVs in their recent history, but which have circumstellar shells that may point to previous episodes of eruptive mass loss (see below). Such objects with spectroscopic similarity to quiescent LBVs, but without detection of their photometric variability, are sometimes called “LBV candidates”.
-
•
Giant eruptions. The most dramatic variability attributed to LBVs is the so-called “giant eruptions”, in which stars are observed to increase their radiative luminosity for months to years, accompanied by severe mass loss (e.g., Humphreys et al. 1999; Smith et al. 2011a). The star survives the disruptive event. The best studied example is the Galactic object Carinae, providing us with its historically observed light curve (Smith & Frew 2011), as well as its complex ejecta that contain 10-20 and 1050 ergs of kinetic energy (Smith et al. 2003; Smith 2006). Besides the less well-documented case of P Cygni’s 1600 AD eruption, our only other examples of LBV-like giant eruptions are in other nearby galaxies. A number of these have been identified, with peak luminosities similar to Car or less (Van Dyk & Matheson 2012; Smith et al. 2011a). Typical expansion speeds in the ejecta are 100 - 1000 km s-1 (Smith et al. 2011a). These events are discussed more below.
-
•
Strong emission-line spectra. Most, but not all, LBVs exhibit strong emission lines (especially Balmer lines) in their visual-wavelength spectra. This is a consequence of their very strong and dense stellar winds (see Vink chapter), combined with their high UV luminosity and moderately high temperature. The wind mass-loss rates implied by quantitative models of the spectra range from 10-5 to 10-3 yr-1; this is enough to play an important role in the evolution of the star (see Smith 2014), and eruptions enhance the mass loss even more. The emission lines in LBVs are, typically, much stronger than the emission lines seen in main-sequence O-type stars of comparable luminosity, and all of the more luminous LBVs have strong emission lines. Other stars that exhibit similar spectra but are not necessarily LBVs include WNH stars, Ofpe/WN9 stars, and B[e] supergiants, some of which occupy similar parts of the HR Diagram.
-
•
Circumstellar shells. Many LBVs are surrounded by spatially resolved circumstellar shells. These fossil shells provide evidence of a previous eruption. Consequently, some stars that resemble LBVs spectroscopically and have massive circumstellar shells, but have not (yet) been observed to exhibit photometric variability characteristic of LBVs, are often called LBV candidates. Many authors prefer to group LBVs and LBV candidates together (the logic being that a volcano is still a volcano even when it is dormant). LBV circumstellar shells are extremely important, as they provide the only reliable way to estimate the amount of mass ejected in an LBV giant eruption. The most common technique for measuring the mass is by calculating a dust mass from thermal-IR radiation, and then converting this to a total gas mass with an assumed gas:dust mass ratio (usually taken as 100:1, although this value is uncertain111If this value is wrong, it is probably a conservative underestimate. This is because a gas:dust mass ratio of 100:1 assumes that all refractory elements at are in grains, whereas in reality, the dust formation may be less efficient or UV and shocks may destroy some dust, leaving some of these elements in the gas phase (and thus raising the total mass). In general, nebular gas masses inferred from thermal-IR dust emission should be considered lower limits, especially at .). To calculate a dust mass from the IR luminosity, one must estimate the dust temperature from the spectral energy distribution (SED), and then adopt some wavelength-dependent grain opacities in order to calculate the emitting mass. The technique can be quite sensitive to multiple temperature components, and far-IR data have been shown to be very important because most of the mass can be hidden in the coolest dust, which is often not detectable at wavelengths shorter than 20 m. One can also measure the gas mass directly by various methods, usually adopting a density diagnostic like line ratios of [Fe ii] or [S ii] and multiplying by the volume and filling factor, or calculating a model for the density needed to produce the observed ionization structure using codes such as CLOUDY (Ferland et al. 1998). The major source of uncertainty here is the assumed ionization fraction. Masses of LBV nebulae occupy a very large range from 20 at the upper end down to 0.1 (Smith & Owocki 2006), although even smaller masses become difficult to detect around bright central stars.
-
•
Wind speeds and nebular expansion speeds. LBV winds and nebulae typically have expansion speeds of 50-500 km s-1, due to the fact that the escape speed of the evolved blue supergiant is lower than for the more compact radii of O-type stars and WR stars that have faster speeds of order 1000 km s-1. In many cases, the shell nebulae are expanding with an even slower speed than the underlying wind, but this is not always the case. The slower nebular speeds may suggest that the nebulae were ejected in a state when the star was close to the Eddington limit (lower effective gravity) or that the LBV eruption ejecta have decelerated after colliding with slow CSM or high-pressure ISM.
-
•
N-rich ejecta. Lastly, LBVs typically exhibit strong enhancements in their N abundance, measured in the circumstellar nebulae or in the wind spectrum. The most common measurement involves the analysis of visual-wavelength spectra, using nebular [S ii] lines to derive an electron density, using the [N ii] (6583+6548)/5755 ratio to derive an electron temperature, and then using the observed intensity of the [N ii] lines compared to H lines for a relative N+/H ratio, and then doing a similar analysis of O and C lines in order to estimate N/O and N/C ratios. One must make assumptions about the ionization levels of N and other elements, but if UV spectra are available, one can constrain the strength of a wide range of ionization levels of each atom. In the case of Carinae, for example, strong lines of N i, ii, iii, iv, and v are detected, but O lines of all ionization levels are extremely faint (Davidson et al. 1986). The observed levels of N enrichment in LBVs suggest that the outer layers of the stars include large quantities of material processed through the CNO cycle and mixed to the surface, requiring that LBVs are post-main-sequence stars.
2.2 The Evolutionary State of LBVs
While evidence for N enrichment and C+O depletion suggest that LBVs are massive post-main-sequence stars, their exact evolutionary status within that complex and possibly non-monotonic evolution has been controversial - moreso in recent years.
The traditional view of LBVs, which emerged in the 1980s and 1990s, is that they correspond to a very brief transitional phase of massive star evolution, as the star moves from core H burning when it is seen as a main sequence O-type star, to core He burning when it is seen as a Wolf-Rayet (WR) star. A typical monotonic evolutionary scheme for a VMS is as follows:
100 : O star Of/WNH LBV WN WC SN Ibc
In this scenario, the strong mass-loss experienced by LBVs is important for removing what is left of the star’s H envelope after the main sequence, leaving a hydrogen-poor WR star following the end of the LBV phase. The motivation for thinking that this is a very brief phase comes from the fact that LBVs are extremely rare, even for very massive stars: taking the relative numbers of LBVs and O-type stars at high luminosity, combined with the expected H-burning lifetime of massive O-type stars, would imply a duration for the LBV phase of only a few 104 yr or less. This view fits in nicely with a scenario where the observed population of massive stars is dominated by single-star evolution.
However, a number of problems and inconsistencies have arisen with this standard view of LBVs. For one thing, the very short transitional lifetime depends on the assumption that the observed LBVs are representative of the whole transitional phase. In fact, there is a much larger number of blue supergiant stars that are not bona fide LBVs seen in eruption, but which are probably related — these are the LBV candidates discussed earlier. Examining populations in nearby galaxies, for example, Massey et al. (2007) find that there are more than an order of magnitude more LBV candidates than there are LBVs confirmed by their photometric variability. (For example, there are several hundred LBV candidates in M31 and M33, compared to the 8 LBVs known by their photometric variability.) If the LBV candidates are included with LBVs, then the average lifetime of the LBV phase must rise from a few 104 yr to several 105 yr. Now we have a problem, because this is a significant fraction of the whole He burning lifetime, making it impossible for LBVs to be fleeting transitional objects. There is not enough time in core-He burning to link them to both WR stars and LBVs. Should we include the LBV candidates and related stars? Are they dormant LBVs? If indeed LBVs go through dormant phases when they are not showing their instability (or when they have temporarily recovered from the instability after strong mass loss), then it would be a mistake not to include the duty cycle of instability in the statistics of LBVs. Massey (2006) has pointed to the case of P Cygni as a salient example: its 1600 A.D. giant LBV eruption was observed and so we consider it an architypal LBV, but it has shown no eruptive LBV-like behavior since then. If the observational record had started in 1700, then we would have no idea that P Cygni was an LBV and we would be wrong. So how many of the other LBV candidates are dormant LBVs? The massive circumstellar shells seen around many LBV candidates imply that they have suffered LBV giant eruptions in the previous 103 yr or so.
Another major issue is that we have growing evidence that LBVs or something like them (massive stars with high mass loss, N enrichment, H rich, slow 100 km s-1 winds, massive shells) are exploding as core-collapse SNe while still in an LBV-like phase (see below). This could not be true if LBVs are only in a brief transition to the WR phase, which should last another 0.5-1 Myr before core collapse to yield a SN Ibc. Pre-supernova eruptive stars that resemble LBVs are discussed in more detail in following sections.
Last, the estimates for lifetimes in various evolutionary phases in the typical monotonic single-star scenario (see above) ignore empirical evidence that binary evolution dominates the evolution of a large fraction of massive stars. Many massive O-type stars (roughly 1/2 to 2/3) are in binary systems whose orbital separation is small enough that they should interact and exchange mass during their lifetime (Kobulnicky & Fryer 2007; Kiminki & Kobulnicky 2012; Kiminki et al. 2012; Chini et al. 2012; Sana et al. 2012). These binary systems must make a substantial contribution to the observed populations of evolved massive stars and SNe, so to find agreement between predictions of single-star evolutionary models and observed populations indicates that something is wrong with the models. Unfortunately, solutions to these problems are not yet readily apparent; some current effort is focussed here, and these topics are still a matter of debate among massive star researchers.
2.3 A special case: Eta Carinae
The enigmatic massive star Carinae is perhaps the most famous and recognizable example of an evolved and unstable VMS. It is sometimes regarded as the prototype of eruptive LBVs, but at the same time it has a long list of peculiarites that make it seem unique and very atypical of LBVs. In any case, it is by far the best studied LBV, and (for better or worse) it has served as a benchmark for understanding LBVs and the physics of their eruptions.
Several circumstances conspire to make Car such a fountain of information. It is nearby (about 2.3 kpc; Smith 2006) and bright with low interstellar extinction, so one is rarely photon-starved when observing this object at any wavelength. It is one of the most luminous and massive stars known, with rough values of and a present-day mass for the primary around 100 (its ZAMS mass is uncertain, but was probably a lot more than this). Its giant eruption in the 19th century was observed at visual wavelengths so that we have a detailed light curve of the event (Smith & Frew 2011), and Car is now surrounded by the spectacular expanding Homunculus nebula that provides us with a fossil record of that mass loss. This nebula allows us to estimate the mass and kinetic energy of the event, which are 15 and 1050 erg, and we can measure the geometry of the mass ejection because the Homunculus is still young and in free expansion (Smith et al. 2003; Smith 2006).
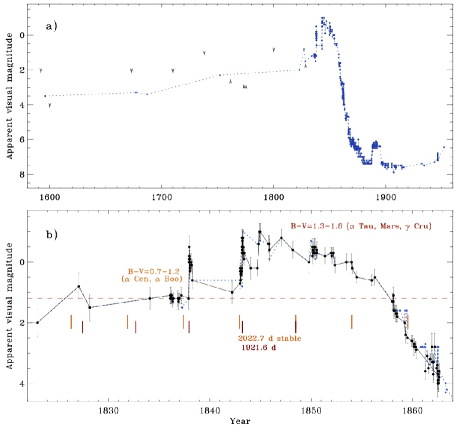
Davidson & Humphreys (1997) provided a comprehensive review of the star and its nearby ejecta in the mid-1990s, but there have been many important advances in the subsequent 16 years. It has since been well established that Car is actually in a binary system with a period of 5.5 yr and (Damineli et al. 1997), which drastically alters most of our ideas about this object. Accordingly, much of the research in the past decade has been devoted to understanding the temporal variability in this colliding-wind binary system (see Madura et al. 2012, and references therein). Detailed studies of the Homunculus have constrained its 3D geometry and expansion speed to high precision (Smith 2006), and IR wavelengths established that the nebula contains almost an order of magnitude more mass than was previously thought (Smith et al. 2003; Morris et al. 1999; Gomez et al. 2010). The larger mass and kinetic energy force a fundamental shift in our undertanding of the physics of the Great Eruption (see below). Observations with HST have dissected the detailed ionization structure of the nebula and measured its expansion proper motion (e.g., Gull et al. 2005, Morse et al. 2001). Spectra have revealed that the Great Eruption also propelled extremely fast ejecta and a blast wave outside the Homunculus, moving at speeds of 5000 km s-1 or more (Smith 2008). We have an improved record of the 19th century light curve from additional released historical documents (Smith & Frew 2011; Figure 2), and perhaps most exciting, we have now detected light echoes from the 19th century eruption, allowing us to obtain spectra of the outburst itself after a delay of 160 years (Rest et al. 2012).
Altogether, the outstanding observational record of Car suggests a picture wherein a VMS suffered an extremely violent, 1050 erg explosive event comparable to a weak supernova, which ejected much of the star’s envelope - but the star apparently survived this event. This gives us a solid example of the extreme events that can result from the instability in a VMS, but the underlying physics is still not certain. Interactions with a close companion star are critical for understanding its present-day variability; the binary probably played a critical role in the behavior of the 19th century Great Eruption as well, although the details are still unclear.
While Car is the best observed LBV, it may not be very representative of the LBV phenomenon in general. In what ways is Car so unusual among LBVs? Its 19th century Great Eruption reached a similar peak absolute magnitude (14 mag) to those of other so-called “SN impostor” events in nearby galaxies (see Smith et al. 2011a), but unlike most extragalactic examples, its eruption persisted for a decade or more, whereas most extragalactic examples of similar luminosity last only 100 days or less. Among well-studied LBVs in the Galaxy and Magellanic Clouds, only Car is known to be in a wide colliding-wind binary system that shows very pronounced, slow periodic modulation across many wavelengths (HD 5980 in the SMC is in a binary, but with a much shorter period). Its 500 km s-1 and 10-3 yr-1 wind is unusually fast and dense compared to most LBVs, which are generally an order of magnitude less dense. Its Homunculus nebula is the youngest LBV nebula, and together with P Cygni these are the only sources for which we have both an observed eruption event and the nebula it created. Thus, it remains unclear if Car represents a very brief (and therefore rarely observed) violent eruption phase that most VMSs pass through at some time in their evolution, or if it really is so unsual because of its very high mass and binary system parameters.
In any case, the physical parameters of Car’s eruption are truly extreme, and they push physical models to limits that are sometimes hard to meet. The 19th century event has long been the protoype for a super-Eddington wind event, but detailed investigation of the physics involved shows that this is quite difficult to achieve (see Owocki’s chapter in this volume). At the same time, we now have mounting observational evidence of an explosive nature to the Great Eruption: (1) A very high ratio of kinetic energy to integrated radiated energy, exceeding unity; (2) Brief spikes in the light curve that occur at times of periastron; (3) evidence for a small mass of very fast moving (5000 km s-1) ejecta and a blast wave outside the Homunculus, which requires a shock-powered component to the eruption, and (4) behavior of the spectra seen in light echoes, which do not evolve as expected from an opaque wind. These hints suggest that some of the phenomena we associate with LBVs (and their extragalactic analogs) are driven by explosive physics (i.e. hydrodynamic events in the envelope) rather than (or in addition to) winds driven from the surface by high luminosity. This is discussed in more detail in the following subsection.
2.4 Giant Eruptions: Diversity, Explosions, and Winds
Giant eruptions are simultaneously the most poorly understood, most puzzling, and probably the physically most important of the observed phenomena associated with LBVs. They are potentially the most important aspect for massive stars because of the very large amounts of mass (as much as 10-20 ) that are ejected in a short amount of time, and consequently, because of their dramatic influence on immediate pre-SN evolution (next section). Although the giant eruptions themselves are rarely observed because they are infrequent and considerably fainter than SNe, a large number of LBVs and spectroscopically similar stars in the Milky Way and Magellanic Clouds are surrounded by massive shell nebulae, indicating previous eruptions with a range of ejecta masses from 1-20 (Clark et al. 2005; Smith & Owocki 2006; Wachter et al. 2010; Gvaramadze et al. 2010). Thus, eruptive LBV mass loss is inferred to be an important effect in late evolution of massive stars, and perhaps especially so in VMSs.
Originally the class of LBV giant eruptions was quite exclusive, with only four approved members: Car’s 1840s eruption, P Cygni’s 1600 AD eruption, SN 1954J (V12 in NGC 2403), and SN 1961V (see Humphreys, Davidson, & Smith 1999). Due the the advent of dedicated searches for extragalactic SNe from the late 1990s onward, the class of giant eruptions has grown to include a few dozen members (see recent summaries by Smith et al. 2011a; Van Dyk & Matheson 2012). Because of their serendipitous discovery in SN searches, they are also referred to as “SN impostors”. Other names include “Type V” supernovae (from F. Zwicky), “ Car analogs”, and various permutations of “intermediate luminosity transients”.
Although the total number of SN impostors is still quite small (dozens) compared to SNe (thousands), the actual rates of these events could potentially be comparable to or even exceed those of core-collapse SNe. The difference is due to the fact that by definition, SN impostors are considerably fainter than true SNe, and are therefore much harder to detect. Since they are 100 times less luminous than a typical Type Ia SN, their potential discovery space is limited to only 1/1000 of the volume in which SNe can be discovered with the same telescope. Their discovery is made even more difficult because of the fact that their contrast compared to the underlying host galaxy light is lower, and because in some cases they have considerably longer timescales and much smaller amplitudes of variability than SNe. Unfortunately, there has not yet been any detailed study of the rates of SN impostors corrected for the inherent detection bias in SN searches. We are limited to small numbers, but one can infer that the rates of LBV eruptions and core-collapse SNe are comparable based on a local guesstimate: in our nearby region of the Milky Way there have been 2 giant LBV eruptions (P Cyg & Car) and 3 SNe (Tycho, Kepler, and Cas A; and only 1 of these was a core-collapse SN) in the past 400 yr.
The increased number of SN impostors in the past decade has led to recognition of wide diversity among the group, and correspondingly, increased ambiguity about their true physical nature. It is quite possible that many objects that have been called “SN impostors” are not LBVs, but something else. The SN impostors have peak absolute magnitudes around 14 mag, but there is actually a fairly wide spread in peak luminosity, ranging from 15 mag down to around 10 mag. At higher luminosity, transients are assumed to be supernovae, and at lower luminosity we call them something else (novae, stellar mergers, S Dor eruptions, etc.) — but these dividing lines are somewhat arbitrary. Most of their spectra are similar, the most salient characteristic being bright, narrow H emission lines (so they are all “Type IIn”) atop either a smooth blue continuum or a cooler absorption-line spectrum. Since the outbursts all look very similar, many different types of objects might be getting grouped together by observers. When more detailed pre-eruption information about the progenitor stars is available, however, we find a range of cases. Some are indeed very luminous, blue, variable stars; but some are not so luminous (105 ), and are sometimes found among somewhat older stellar populations than one expects for a VMS (Prieto et al. 2008a, 2008b; Thompson et al. 2009). Some well-studied extragalactic SN impostors that are clearly massive stars suffering LBV-like giant eruptions are SN 1997bs, SN 2009ip, UGC 2773-OT, SN 1954J, V1 in NGC 2366, SN 2000ch; some well-studied objects that appear to be lower-mass stars (around 6-10 ) are SN 2008S, NGC 300-OT, V838 Mon, and SN 2010U. There are many cases in between where the interpretation of observational data is less straightforward or where the data are less complete. In any case, it is interesting that even lower mass stars (8–15 ) may be suffering violent eruptive instabilities similar to those seen in the most massive stars. If the physical cause of the outbursts is at all related, it may point to a deep-seated core instability associated with nuclear burning or some binary collision/merger scenario, rather than an envelope instability associated with the quiescent star being near the Eddington limit.
Physically, the difference between a “SN impostor”/giant eruption and a true (but underluminous) SN is that the star does not survive the latter type of event. Observationally, it is not always so easy to distinguish between the two. Even if the star survives, it may form dust that obscures the star at visual wavelengths, while IR observations may not be available to detect it. On the other hand, even if the star dies, there may appear to be a “surviving” source at the correct position if it is a host cluster, a companion star, an unrelated star superposed at the same position, or ongoing CSM interaction from the young SN remnant. It is often difficult to find decisive evidence in the faint, noisy, unresolved smudges one is forced to interpret when dealing with extragalactic examples. Consider the extremely well-observed case of SN 1961V. This object was one of the original “Type V” SNe and a prototype of the class of LBV giant eruptions (Humphreys et al. 1999). However, two recent studies have concluded that it was most likely a true core-collapse Type IIn SN, and for two different reasons: Smith et al. (2011a) point out that all of the observed properties of the rather luminous outburst are fully consistent with the class of Type IIn SNe, which did not exist in 1961 and was not understood until recently. If SN 1961V were discovered today, we would undoubtedly call it a true SN IIn since its high peak luminosity (18 mag) and other observed properties clearly make it an outlier among the SN impostors. On the other hand, Kochanek et al. (2011) analyzed IR images of the site of SN 1961V and did not find an IR source consistent with a surviving luminous star that is enshrouded by dust, like Car. Both studies conclude that since the source is now at 6 mag fainter than the luminous blue progenitor star, it probably exploded as a core-collapse event. Although there is an H emission line source at the correct position (Van Dyk et al. 2002), this could be due to ongoing CSM/shock interaction, since no continuum emission is detected. It is hard to prove definitively that the star is dead, however (for an alternative view, see Van Dyk & Matheson 2012). This question is very important, though, because the progenitor of SN 1961V was undoubtedly a very luminous star with a likely initial mass well exceeding 100 . If it was a true core-collapse SN, it would prove that some very massive stars do explode and make successful SNe.
What is the driving mechanism of LBV giant eruptions? What is their source of luminosity and kinetic energy? Even questions as simple and fundamental as these have yet to find answers. Two broad classes of models have developed: super-Eddington winds, and explosive mass loss. Both may operate at some level in various objects.
Traditionally, LBV giant eruptions have been discussed as super-Eddington winds driven by a sudden and unexplained increase in the star’s bolometric luminosity (Humphreys & Davidson 1994; Shaviv 2000; Owocki et al. 2004; Smith & Owocki 2006), but there is growing evidence that some of them are non-terminal hydrodynamic ejections (see Smith 2008, 2013). Part of the motivation for this is based on detailed study of Carinae, which as noted above, has shown several signs that the 1840s eruption had a shock-driven component to it. One normally expects sudden, hydrodynamic events to be brief (i.e., a dynamical time), which may seem incongruous with the 10 yr long Great Eruption of Car. However, as in some very long-lasting core-collapse SNe, it is possible to power the observed luminosity of the decade-long Great Eruption with a shock wave plowing through dense circumstellar gas (Smith 2013). In this model, the duration of the transient brightening event is determined by how long it takes for the shock to overrun the CSM (this, in turn, depends on the relative speeds of the shock and CSM, and the radial extent of the CSM). Since shock/CSM interaction is such an efficient way to convert explosion kinetic energy into radiated luminosity, it is likely that many of the SN impostors with narrow emission lines are in fact powered by this method. The catch is that even this method requires something to create the dense CSM into which the shock expands. This may be where super-Eddington winds play an important role. The physical benefit of this model is that the demands on the super-Eddington wind are relaxed to a point that is more easily achievable; instead of driving 10 in a few years (as for Car), the wind can provide roughly half the mass spread over several decades or a century. The required mass-loss rates are then of order 0.01-0.1 yr-1, which is more reasonable and physically plausible than a few to several yr-1. Also, the wind can be slow (as we might expect for super-Eddington winds; Owocki et al. 2004), whereas the kinetic energy in observed fast LBV ejecta can come from the explosion.
In any case, the reason for the onset of the LBV eruption remains an unanswered question. In the super-Eddington wind model, even if the wind can be driven at the rates required, we have no underlying physical explanation for why the star’s bolometric luminosity suddenly increases by factors of 5-10 or more. In the explosion model, the reason for an explosive event preceding core collapse is not known, and the cause of explosive mass loss at even earlier epochs is very unclear. It could either be caused by some instability in late nuclear burning stages (see e.g., Smith & Arnett 2014), or perhaps by some violent binary interaction like a collision or merger (Smith 2011; Smith & Arnett 2014; Podsiadlowski et al. 2010). Soker and collaborators have discussed an accretion model to power the luminosity in events like Car’s Great Eruption, but these assume that an eruption occurs to provide the mass that is then accreted by a companion, and so there is no explanation for what triggers the mass loss from the primary in the first place. In any case, research on these eruptions is actively ongoing; it is a major unsolved problem in astrophysics, and in the study of VMSs in particular.
3 Very Luminous Supernovae
3.1 Background
The recognition of a new regime of SN explosions has just occurred in the last few years — this includes SNe that are observed to be substantially more luminous than a standard bright Type Ia SN (the brightest among “normal” SNe). Although this is still a young field, the implications for and connections to the evolution and fate of VMSs is exciting. Here we discuss these luminous SNe as well as gamma ray bursts (GRBs), and their connection to the lives and deaths of the most massive stars.
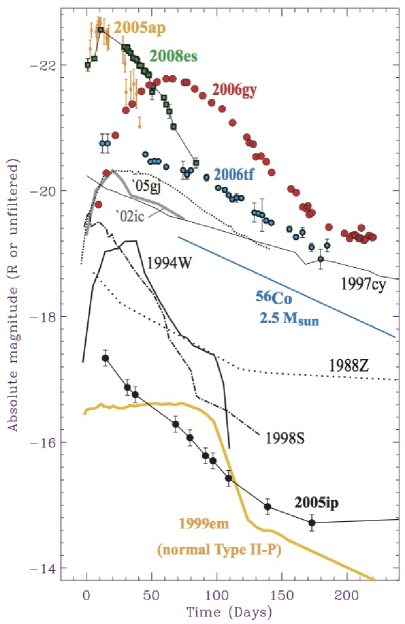
This field of research on the most luminous SNe took on a new dimension with the discovery of SN 2006gy (Smith et al. 2007; Ofek et al. 2007), which was the first of the so-called “super-luminous SNe” (SLSNe). The surprising thing about this object was that with its high peak luminosity (21.5 mag) and long duration (70 days to rise to peak followed by a slow decline), the integrated luminous energy was a few times 1051 erg, more than any previous SN. A number of other SLSNe have been discovered since then (see below). Why were these SLSNe not recognized previously? There may be multiple reasons, but clearly one reason is that earlier systematic SN searches were geared mainly toward maximizing the number of Type Ia SN discoveries in order to use them for cosmology. This meant that these searches, which usually imaged one galaxy per pointing due to the relatively small field of view, mainly targeted large galaxies to maximize the chances of discovering SNe Ia each night. Since it appears that SLSNe actually seem to prefer dwarf galaxy hosts (either because of lower metallicity, or because dwarf galaxies have higher specific star-formation rates), these searches may have been biased against discovering SLSNe. More recent SN searches have used larger fields of view and therefore search large areas of the sky, rather than targeting individual large galaxies; this is probably the dominant factor that led to the increased discovery rate of SLSNe (see Quimby et al. 2011). Additionally, even if SLSNe were discovered in these earlier targeted searches, prescious followup resources for spectroscopy on large telescopes are limited, and so SNe that were not Type Ia were given lower priority.
3.2 Sources of unusually high luminosity
So what can make SLSNe 10–100 times more luminous than normal SNe? There are essentially two ways to get a very luminous explosion. One is by having a relatively large mass of 56Ni that can power the SN with radioactive decay; a higher luminosity generally requires a larger mass of synthesized 56Ni. While a typical bright Type Ia SN might have 0.5-1 of 56Ni, a super-luminous SN must have 1-10 of 56Ni to power the observed luminosities. Currently, the only proposed explosion mechanism that can do this is a pair instability SN (see Chapter 7 by Woosley & Heger). It is interesting to note that most normal SNe are powered by radioactive decay – were it not for the synthesis of 56Ni in these explosions, we wouldn’t ever see most SNe.
The synthesized mass of 56Ni needed to supply the luminosity of a PISN through radioactivity is estimated from observations the same way as for normal SNe:
| (1) |
(Sutherland & Wheeler 1984) where is the bolometric luminosity at time after explosion (usually measured at later times when the SN is clearly on the radioactive decay tail). Important uncertainties here are that must be the bolometric luminosity, which is not always easily obtained without good multiwavelength data (otherwise this provides only a lower limit to the 56Ni mass), and the time of explosion must be known (this is often poorly constrained observationally, since most SNe have been discovered near maximum luminosity). An additional cause of ambiguity is that in very luminous SNe, it is often difficult to determine if the source of luminosity is indeed radioactivity, since other mechanisms (see below) may be at work.
The other way to generate an extraordinarily high luminosity is to convert kinetic energy into heat, and to radiate away this energy before the ejecta can expand and cool adiabatically. This mechanism fails for many normal SNe, since the explosion of any progenitor star with a compact radius (a white dwarf, compact He star, blue supergiant) must expand to many times its initial radius before the photosphere is large enough to provide a luminous display. These SNe are powered primarily by radioactivity, as noted above. Red supergiants, on the other hand, have larger initial radii, and so their peak luminosity is powered to a much greater extent by radiation from shock-deposited thermal energy. However, even the bloated radii of red supergiants (a few AU) are far smaller than a SN photosphere at peak (1015 AU), and so the most common Type II-P SNe from standard red supergiants never achieve an extraordinarily high luminosity. Most of the thermal energy initially deposited in the envelope is converted to kinetic energy through adiabatic expansion. This inefficiency (and relatively low 56Ni yields of only 0.1 ) is why the total radiated energy of a normal SN II-P (typically 1049 erg) is only about 1% of the kinetic energy in the SN ejecta.222Of course, most of the energy from a core collapse SN escapes in the form of neutrinos (1053 erg).
Smith & McCray (2007) pointed out that this shock-deposition mechanism could achieve the extremely high luminosities of SLSNe like SN 2006gy if the initial “stellar radius” was of order 100 AU, where this radius is not really the hydrostatic photospheric radius of the star, but is instead the radius of an opaque CSM shell ejected by the star before the SN. The key in CSM interaction is that something else (namely, pre-SN mass loss) has already done the work against gravity to put a large mass of dense and slow-moving material out at large radii (1015 cm) away from the star. When the SN blast wave crashes into this material, already located at a large radius, the fast SN ejecta are decelerated and so the material is heated far from the star, where it can radiate away its thermal energy before it expands by a substantial factor. By this mechanism, large fractions (50% or more) of the total ejecta kinetic energy can be converted to thermal energy that is radiated away. In a hydrogen-rich medium, the photosphere tends to an apparent temperature around 6000-7000 K, and so a large fraction of the radiated luminosity escapes as visual-wavelength photons. Since this mechanism of optically thick CSM interaction is very efficient at converting ejecta kinetic energy into radiation, this process can yield a SLSN without an extraordinarily high explosion energy or an exotic explosion mechanism. What makes this scenario extraordinary (and a challenge to understand) is the requirement of ejecting 10 in just the few years before core collapse. This is discussed more below.
A variant of this conversion of kinetic energy into light is powering a SLSN with the birth of a magentar (Woosley 2010; Kasen & Bildsten 2010). In this scenario, a normal core-collapse SN explodes the star and sends its envelope (10s of ) expanding away from the star. For the SN itself, there is initially nothing unusual compared to normal SNe. But in this case a magnetar is born instead of a normal neutron star or black hole. The rapid spin-down of the magnetar subsequently injects 1051 ergs of energy into the SN ejecta (which have now expanded to a large radius of 100 AU). Similar to the opaque CSM interaction model mentioned previously, this mechanism reheats the ejected material at a large radius, so that it can radiate away the energy before the heat is lost to adiabatic expansion, providing an observer with a SLSN. It would be very difficult to tell the difference observationally between the magnetar model and the opaque shocked shell model during the early phases around peak when photons are diffusing out through the shell or ejecta. It may be possible to see the difference at late times if late-time data are able to see the signature of the magnetar (Inserra et al. 2013).
In summary, there are three proposed physical mechanisms for powering SLSNe. For each, there are also reasons to suspect a link to VMSs.
1. Pair instability SNe. This is a very powerful thermonuclear SN explosion. To produce the observed luminosity and radiated energy, one requires of order 10 of synthesized 56Ni. These explosions are only expected to occur in VMSs with initial masses of 150 , because those stars are the only ones with a massive enough CO core to achieve the high temperatures needed for the pair-instability mechanism. The physics of these explosions is discussed more in the chapter by Woosley & Heger. So far, there is only one observed example of a SN that has been suggested as a good example of a PISN, and this is SN 2007bi (Gal-Yam et al. 2009). However, this association with a PISN is controversial. Dessart et al. (2012) have argued that SN 2007bi does not match predictions for a PISN; it has a very blue color with a peak in the UV, whereas the very large mass of Fe-group elements in a PISN should cause severe line blanketing, leading to very red observed colors and deep absorption features. Thus, it is unclear if we have ever yet observed a PISN.
2. Opaque shocked shells. Here we have a normal SN explosion that collides with a massive CSM shell, providing a very efficient way of converting the SN ejecta kinetic energy into radiated luminosity when the SN ejecta are decelerated. The reason that this mechanims would be linked to VMS progenitors is because one requires a very large mass of CSM (10-20 ) in order to stop the SN ejecta. Given expectations for the minimum mass of SN ejecta in models and the fact that stars also suffer strong mass loss duing their lifetimes, a high mass progenitor star is needed for the mass budget. Also, sudden eruptive mass loss in non-terminal events that eject 10 is, so far, a phenomenon exclusivy associated with VMSs like LBVs. Although lower-mass stars do appear to be suffering eruptions that look similar (see above), these do not involve the ejection of 10 .
3. Magnetar-powered SNe. In principle, the mechanism is quite similar to the opaque shocked shell model, in the sense that thermal energy is injected at a large radius, although here we have magnetar energy being dumped into a SN envelope, rather than SN ejecta colliding with CSM. Although the SN explosion that leads to this SLSN may be normal, the potential association with VMSs comes from the magnetar. Some magnetars have been found in the Milky Way to be residing in massive young star clusters that appear to have a turnoff mass around 40 , suggesting that the progenitor of the magnetar had an initial mass above 40 .
3.3 Type IIn SLSNe
Since massive stars are subject to strong mass loss, it is common that there is CSM surrounding a massive star at the time of its death, into which the fast SN ejecta must expand. The collision between the SN blast wave and this CSM is referred to as “CSM interaction”, which is commonly observed in core-collapse SNe in the form of X-ray or radio emission (Chevalier & Fransson 1994). However, only about 8-9% of core-collapse SNe (Smith et al. 2011b) have CSM that is dense enough to produce strong visual-wavelength emission lines and an optically thick continuum. In these cases, the SN usually exhibits a smooth blue continuum with strong narrow H emission lines, and is classified as a Type IIn SN.
Intense CSM interaction can occur in two basic regimes: (1) If the interaction is optically thick so that photons must diffuse out through the material in a time that is comparable to the expansion time, or (2) an effectively optically thin regime, where luminosity generated by CSM interaction escapes quickly. This is equivalent to cases where the outer boundary of the CSM is smaller or larger, respectively, than the “diffusion radius” (see Chevalier & Irwin 2011). The former case will yield an observed SN without narrow lines, resembling a normal broad-lined SN spectrum. The latter will exhibit strong narrow emission lines with widths comparable to the speed of the pre-shock CSM, emitted as the shock continues to plow through the extended CSM. In most cases, the SN will transition from the optically thick case to the optically thin case around the time of peak luminosity (see Smith et al. 2008). If the CSM is hydrogen rich, the narrow H lines earn the SN the designation of Type IIn. (If the CSM is H-poor and He-rich, it will be seen as a Type Ibn, but these are rare and no SLSNe have yet been seen of this type.)
Although narrow H emission lines are the defining charcteristic of the Type IIn class, the line widths and line profiles can be complex with multiple components. They exhibit wide diversity, and they evolve with time during a given SN event as the optical depth drops and as the shock encounters density and speed variations in the CSM. These line profiles are therefore a powerful probe of the pre-SN mass loss from the SN prognitor star. Generally, the emission line profiles in SNe IIn break down into three subcomponents: narrow, intermediate-width, and broad.
-
•
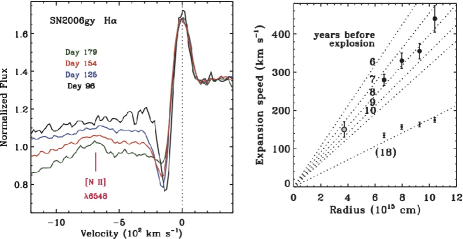
The narrow (few 102 km s-1) emission lines arise from a photoionized shock precursor, when hard ionizing photons generated in the hot post-shock region propagate upstream and photoionize much slower pre-shock gas. The width of the narrow component, if it is resolved in spectra, gives an estimate of the wind speed of the progenitor star in the years leading up to core collapse. Since these speeds are generally between about 200–600 km s-1, this seems to suggest blue supergiant stars or LBVs for the progenitors of SNe IIn, because the escape speeds are about right (see SMith et al. 2007, 2008, 2010a). Bloated red supergiants or compact WR stars have much slower or faster wind speeds, respectively. In some cases when relatively high spectral resolution is used, one can observe the narrow P Cygni absorption profile. This gives an even more precise probe of the wind speed of the pre-shock gas along the line-of-sight, which in some cases has multiple velocity components showing that the wind speed has been changing (see below, and Groh & Vink 2011). Since the absorption occurs in the densest gas immediately ahead of the shock, one can potentially use the time variation in the P Cyg absorption to trace out the radial velocity law in the wind. A dramatic example of this was the case of SN 2006gy (Fig. 4; Smith et al. 2010a), where the velocity of the P Cyg absorption increased with time as the shock expanded, indicating a Hubble-like flow in the CSM (i.e. ). In this case, the Hubble-like law in the pre-shock CSM indicated that the dense CSM was ejected only about 8 yr before the SN (Smith et al. 2010a). The rather close synchronization between the pre-SN eruptions and the SN has important implications, and is discussed more below.
-
•
Intermediate-width (103 km s-1) components usually accompany the narrow emission-line cores. Generally these broader components exhibit a Lorentzian profile at early times and gradually transition to Gaussian, asymmetric, or irregular profiles at late times. This is thought to be a direct consequence of dropping optical depth (see Smith et al. 2008). At early times in very dense CSM, line photons emitted in the ionized pre-shock CSM must diffuse outward through optically thick material outside that region. The multiple electron scatterings encountered as the photons escape produces the Lorentzian-shaped wings to the narrow line cores. For these phases, it would therefore be a mistake to fit multiple components to the H line profile, for example, and to adopt the broader component as indicative of some characteristic expansion speed in the explosion. At later times when the pre-shock density is lower and we see deeper into the shock, the intermediate-width components can trace the kinematics of the post-shock region more directly. These genrally indicate shock speeds of a few 103 km s-1 or less.
-
•
Sometimes, in special cases of lower-density CSM (or at late times), clumpy CSM, or CSM with non-spherical geometry, one can also observe the broad-line profiles from the underlying fast SN ejecta. In these cases one can estimate the speed of the SN ejecta directly. This usually does not occur in the most luminous SNe IIn, however, simply because the lower-density CSM or the small solid angle for CSM interaction (i.e. a disk) needed to allow one to see the broad SN ejecta lines also limits the luminosity of the CSM interaction, making it hard to have both transparency and high luminosity in the same explosion. A recent case of this is teh 2012 SN event of SN 2009ip (Smith et al. 2014).
3.4 CSM Mass Estimates for SLSNe IIn
Cold Dense Shell (CDS) Luminosity: Armed with empirical estimates of the speed of the CSM and the speed of the advancing shock, one can then calculate a rough estimate for the density and mass-loss rate of the CSM required to power the observed luminosity of the SN. Dense CSM slows the shock, and the resulting high densities in the post-shock region allow the shock to become radiative. With high densities and optical depths, thermal energy is radiated away primarily as visual-wavelength continuum emission. This loss of energy removes pressure support behind the forward shock, leading to a very thin, dense, and rapidly cooling shell at the contact discontinuity (usually referred to as the “cold dense shell”, or CDS; see Chugai et al. 2004; Chugai & Danziger 1994). This CDS is pushed by ejecta entering the reverse shock, and it expands into the CSM at a speed . In this scenario, the maximum emergent continuum luminosity from CSM interaction is given by
| (2) |
where is the outward expansion speed of the CDS derived from observations of the intermediate-width component, is the speed of the pre-shock wind derived from the narrow emission line widths or the speed of the P Cygni absorption trough, is the mass-loss rate of the progenitor’s wind, and = is the so-called wind density parameter (see Chugai et al. 2004; Chugai & Danziger 1994; Smith et al. 2008, 2010a). The wind density parameter is a convenient way to describe the CSM density, because it does not assume a constant speed (for the highest mass-loss rates, it may be a poor assumption to adopt a constant wind with a standard density law, since the huge masses involved are more likely to be the result of eruptive/explosive mass loss).
In general, this suggests that more luminous SNe require either higher density in the CSM, faster shocks, or both. Thus, a wide range of different CSM density (resulting from different pre-SN eruption parameters or different wind mass-loss rates) should produce a wide variety of luminosities in SNe IIn. This is, in fact observed. Figure 3 shows several examples of light curves for well-studied SNe IIn, which occupy a huge range in luminosity from the most luminous SNe down to the lower bound of core-collapse SNe (below peaks of about -15.5 mag, we would generally refer to a SN IIn as a SN impostor).
To derive a CSM mass, it is common to re-write the previous equation with an efficiency factor as:
| (3) |
With representative values, this can be rewritten as:
| (4) |
where is the bolometric luminosity in units of 109 , is the CSM expansion speed relative to 200 km s-1, and is the expansion speed of the post-shock gas in the CDS relative to 2000 km s-1. These velocities are representative of those observed in SNe IIn, although there is variation from one object to the next. corresponds roughly to an absolute magnitude of only 17.8 mag, which is relatively modest for SNe IIn (Fig. 3). Thus, we see that even for relatively normal luminosity SNe IIn, extremely high pre-SN mass-loss rates are required, much higher than is possible for any normal wind. For SLSNe that are 10 times more luminous, extreme mass-loss rates of order 1 yr-1 are needed. Moreover, this mass-loss rate is really a lower limit, due to the efficiency factor , which must be less than 100%. In favorable cases (fast SN ejecta, slow and dense CSM) the efficiency can be quite high (above 50%; see van Marle et al. 2010). However, for lower densities and especially non-spherical geometry in the CSM, the efficiency drops and CSM mass requirements rise.
In cases where the post-shock H emission is optically thin, one can, in principle, also estimate the CSM mass in a similar way, by replacing the bolometric luminosity with , and the efficiency with the corresponding H efficiency . This is perhaps most appropriate at late times, as CSM interaction may contiunue for a decade after the SN. During this time the assumption of optically thin post-shock H emission may be valid. In practice, however, there are large uncertainties in the value of (usually assumed to be of order 0.005 to 0.05; e.g. Salamanca et al. 2002), so this diagnostic provides only very rough order of magnitude estimates.
Light Curve Fits: The rough estimate in the previous method provides a mass-loss rate corresponding only to the density overtaken at one moment by the shock (assuming the CDS radiation escapes without delay; see below). In reality, the values of , , and the CSM density can change with time as the shock decelerates while it expands into the CSM, as does the speed of the SN ejecta crashing into the reverse shock. Moreover, pre-SN mass loss is likely to be episodic, so it is unclear for how long that value of was sustained. To get the total CSM mass ejected by the progenitor within some time frame before core collapse (and hence, an average value of ), one must integrate over time. This means producing a model to fit the observed light curve.
One can calculate a simple analytic model for the CSM mass needed to yield the light curve by demanding that momentum is conserved in the collision between the SN ejecta and the CSM, and that the change in kinetic energy resulting from the deceleration of the fast SN ejecta is lost to radiation. Assuming an explosion energy, a density law for the SN ejecta, and a speed and density law of the CSM, one can calculate the resulting analytic light curve assuming that high densities and H-rich composition lead to a small bolometric correction (see Smith et al. 2008, 2010a; Smith 2013a, 2013b; Chatzopoulos et al. 2013; Moriya et al. 2013). One can also do the same from a numerical simulation (e.g., Woosley et al. 2007; van Marle et al. 2010). In general, very high CSM masses of order 10-20 are found for SLSNe like SN 2006gy and 2006tf, emitted in the decade or so preceeding the explosion. Considering the CSM mass within the radius ivertaken by the shock, the undertainty in this mass estimate is roughyl a factor of 2, but should also be considered a lower limit to the total mass since more mass can reside at larger radii. When very high mass and dense CSM is involved, this methos is usually more reliable than other methods (emission lines, X-rays, radio) that may severely underestimate the mass due to high optical depths.
Diffusion Time: In extreme cases where the CSM is very dense, the diffusion time may be long. If becomes comparable to the expansion timescale of the shock moving through the CSM , then the shock-deposited thermal energy can leak out after the shock has broken out of the CSM. Since the radius of the CSM may be very large (of order 1015 cm), this may produce an extremely luminous SN display (Smith & McCray 2007). This is essentially the same mechanism as the normal plateau luminosity of a SN II-P (Falk & Arnett 1977), but the radius here is the radius of the CSM, not the hydrostatic radius of the star. This can be simplified to
| (5) |
where is the assumed radius of the opaque CSM in units of 1015 cm, and can be estimated from observations of the characteristic fading time of the SN light curve. Applying this to SLSNe like SN 2006gy yields a CSM mass of order 10-20 (Smith & McCray 2007; Chevalier & Irwin 2011). This is comparable to the estimates through the previous method. The underlying physical mechanism is the same as normal CSM interaction discussed above, but the optical depths are assumed to be too high for the luminosity to escape quickly. In fact, even lower-luminosity SNe IIn may have diffusion-powered light curves at early times as the shock breaks through the inner and denser parts of the wind; their lower luminosity compared to SLSNe reflects the smaller radius in the CSM where this breakout occurs (see Ofek et al. 2013a).
H Emission from Unshocked CSM: When high resolution spectra reveal a narrow P Cygni component to the H line (widths of order 100-500 km s-1), one can infer that this emission arises from the pre-shock CSM. (Note that if a narrow P Cyg profile is not seen, but rather a simple emission profile, it is uncertain if this narrow component arises from a distant circumstellar nebula or a nearby H ii region.) Following Smith et al. (2007), the mass of emitting ionized hydrogen in the CSM around a SN IIn can be inferred from the total narrow-component H luminosity from
| (6) |
where is the energy of an H photon, is the Case B recombination coefficient, and is the average electron density. This simplifies to
| (7) |
with in units of and in cm-3 (see Smith et al. 2007). Note that this is only the mass of ionized H at high densities, so it is only a lower limit to the CSM mass if some of the CSM remains neutral. However, as with mass-loss rates of normal O-type stars, the H emission depends on the degree of clumping in the wind (see review by Smith 2014), which can lower the total required mass. For more luminous SNe IIn with very dense pre-shock CSM, the narrow H component mar arize from a relatively thin zone ahead of the shock, and it therefore provides a useful probe of the immediate pre-shock CSM in cases where a narrow P Cyg profile is observed. For a SLSN IIn like SN 2006gy, this method yields a CSM mass of order 10 or a mass-loss rate of order 1 yr-1 (Smith et al. 2007). For a more moderate-luminosity SN IIn like SN 2009ip, Ofek et al. (2013a) applied this same method and found a mass-loss rate of order 10-2 yr-1.
X-ray and radio emission: For SLSNe IIn the X-ray and radio emission is of limited utility in diagnosing the pre-SN mass-loss rate, since very high CSM densities cause the X-rays to be self absorbed (the reprocessing of X-rays and their thermalization to lower temperatures is what powers the high visual-wavelength continuum luminosity of SNe IIn) and the CSM is optically thick to radio emission during the main portion of the visual light curve peak.
When X-rays are detected, the X-ray luminosity can be used to infer a characteristic mass-loss rate (see Ofek et al. 2013a; Smith et al. 2007; Pooley et al. 2002):
| (8) |
where is in units of 0.01 yr-1, the wind speed is relative to 500 km s-1, is the shock radius in units of 1015 cm, is the Thomson optical depth in the wind, and the exponential term is due to wind absorption (see Ofek et al. 2013a for further detail). Caution must be used when inferring global properties, however. If the CSM is significantly asymmetric (as most nebulae around massive stars are), X-rays may indeed escape from less dense regions of the CSM/shock interaction, while much denser zones may yield high optical depths and a strong visual-wavelength continuum. Thus, one could infer both low and high densities simultaneously, which might seem contradictory at first glance. This was indeed the case in SN 2006gy, where the CSM density indicated be X-rays was not nearly enough to provide the observed visual luminosity (Smith et al. 2007).
Radio synchrotron emission is quashed for progenitor mass-loss rates much higher than about 10-5 yr-1 in the first year or so after explosion, and as a result, radio emission is rarely seen from SNe IIn at early times. (In order for the CSM interaction luminosity to compete with the normal SN photosphere luminosity, the mass-loss rate of a SN IIn progenior must generally be higher than 10-4 yr-1. Moreover, very massive stars almost always have normal winds in this range anyway, due to their high luminosity.) Radio emission can be detected at later times when the density drops, but this emission is then tracing the mass-loss rate that occurred centuries before the SN, rather than the eruptions in the last few years before explosion. For a discussion of how to use radio emission as a diagnostic of the progenitor’s mass-loss rate, we refer the reader to Chevalier & Fransson (1994).
3.5 Connecting SNe IIn and LBVs
There are several lines of evidence that suggest a possible connection between LBVs and the progenitors of SNe IIn. While each one is not necessarily conclusive on its own, taken together they clearly favor LBVs as the most likely known type of observed stars that fit the bill. If the progenitors of SNe IIn are not actually LBVs, they do a very good impersonation. Here is a list of the different lines of evidence that have been suggested:
(1) Super-luminous SNe IIn, where the demands on the amount of CSM mass are so extreme (10-20 in some cases) that unstable massive stars are required for the mass budget, and the inferred radii and expansion speeds of the CSM require that it be ejected in an eruptive event within just a few years before core collapse (Smith et al. 2007, 2008, 2010a; Smith & McCray 2007; Woosley et al. 2007; van Marle et al. 2010). So far, the only observed precedent for stars known to exhibit this type of extreme, eruptive mass loss is LBV giant eruptions. (In fact, one could argue that since LBV is an observational designation, if any such pre-SN event were to be observed, we would probably call it an LBV-like eruption.)
(2) Direct detections of progenitors of SNe IIn that are consistent with massive LBV-like stars (Gal-Yam & Leonard 2009; Gal-Yam et al. 2007; Smith et al. 2010b, 2011a, 2012; Kochanek et al. 2011). This is discussed in the next section (Sect. 4).
(3) Direct detections of non-terminal LBV-like eruptions preceding a SN explosion. This is seen by some as a smoking gun for an LBV/SN connection. So far there are only two clear cases of this, and two more with less complete observations, discussed later (Sect. 5).
(4) The narrow emission-line components from the CSM indicate H-rich ejecta surrounding the star. H-rich CSM is obviously not exclusive to LBVs, but it argues against most WR stars as the progenitors. If SNe IIn (especially SLSNe IIn) indeed require very massive progenitors, this is a pretty severe problem for standard models of massive-star evolution. In any case, among massive stars with very strong mass loss, LBVs are the only ones with the combination of H-rich ejecta and high densities comparable to those required.
(5) Wind speeds consistent with LBVs. As noted above, the observed line widths for narrow components in SNe IIn suggest wind speeds of a few 102 km s-1. This is consistent with the expected escape velocities of blue supergiants and LBVs (Salamanca et al. 2002; Smith 2006; Smith et al. 2007, 2008, 2010a; Trundle et al. 2008). While it doesn’t prove that the progenitors are in fact LBVs, it is an argument against red supergiants or WR stars as the likely progenitors. Wind speeds alone are not conclusive, however, since radiation from the SN itself may accelerate pre-shock CSM to these speeds.
(6) Wind variability that seems consistent with LBVs. Modulation in radio light curves indicates density variations that suggest a connection to the well-established variability of LBV winds (Kotak & Vink 2006). Also, multiple velocity components along the line of sight seen in blueshifted P Cygni absorption components of some SNe IIn resemble similar multi-component absorption features seen in classic LBVs like AG Car (Trundle et al. 2008). This may hint that some SN IIn progenitors had winds that transitioned across the bistability jump, as do LBVs (see Vink chapter; Groh & Vink 2011). As with the previous point (wind speed), this is not a conclusive connection to LBVs, since other stars do experience density and speed variations in their winds, and the sudden impulse of radiation driving from the SN luminosity itself might give the impression of multiple wind speeds seen in absorption along the line of sight. Nevertheless, the variability inferred does hint at a possible connection to LBVs, and is consistent with that interpretation.
We must note, however, that not all SNe IIn are necessarily tied to LBVs and the most massive stars. Some SNe IIn may actually be Type Ia explosions with dense CSM (e.g., Silverman et al. 2013 and references therein), some may be electron-capture SN explosions of stars with initial masses around 810 (Smith 2013b; Mauerhan et al. 2013b; Chugai et al. 2004), and some may arise from extreme red supergiants like VY CMa with very dense winds (Smith et al. 2009; Mauerhan & Smith 2012; Chugai & Danziger 1994). The argument for a connection to LBVs and VMSs is most compelling for the SLSNe IIn because of the required mass budget, which is hard to circumnavigate (Smith & McCray 2007; Smith et al. 2007, 2008, 2010a; Woosley et al. 2007; Rest et al. 2011).
3.6 Requirements for Pre-SN Eruptions and Implications
In order for the characteristic Type IIn spectrum to be observed, and to achieve a high luminosity from CSM interaction, the collision between the SN shock and the CSM must occur immediately after explosion. This places a strong constraint on the location of the CSM and the time before the SN when it must have been ejected. Given the luminosity of SLSNe, the photosphere must be at a radius of a few 1015 cm, which must also be the location of the CSM if interaction drives the observed luminosity. Another way to arrive at this same number is to require that a SN shock front (the cold dense shell or CDS, as above) expands at a few 103 km s-1 in order to overtake the CSM in the first 100 days. Then we have = = (2,000 km s-1) (100 d) = 21015 cm. Note that the observed blueshifted P Cygni absorption profiles in narrow line components indicate that the CSM is outflowing. This observed expansion rules out possible scenarios where the CSM is primordial (i.e. disks left-over from star formation).
How recently was this CSM ejected by the progenitor star? From the widths of narrow lines observed in spectra we can derive the speed of the pre-SN wind, and these show speeds of typically 100600 km s-1 (Smith et al. 2008, 2010a; Kiewe et al. 2012), as noted earlier. In order to reach radii of 1-21015 cm, then, the mass ejection must have occurred only a few years before the SN. Since the lifetime of the star is several Myr and the time of He burning is 0.5-1 Myr, a timescale of only 2-3 yr is very closely synchronized with the time of core collapse. This is a strong hint that something violent (i.e., hydrodynamic) may be happening to these stars very shortly before core collapse, apparently as a prelude to the core collapse event.
As noted earlier, the CSM mass must be substantial in order to provide enough inertia to decelerate the fast SN ejecta and extract the kinetic energy. This is especially true for SLSNe, where high CSM masses of order 10 are required. Combined with the expansion speeds of several 102 km s-1 derived from narrow emission lines in SNe IIn, we find that whatever ejected the CSM must have been provided with an energy of order 1049 ergs. Since the mass loss occurred in only a few years before core collapse, it is necessarily an eruptive event that is short in duration.
The H-rich composition, high mass, speed, and energy of these pre-SN eruptions are remarkably similar to the physical conditions derived for LBV giant eruptions. This is the primary basis for the connections between LBVs and SNe IIn, as noted earlier. Consequently, we are left with the same ambiguity about the underlying physical mechanism of pre-SN outbursts as we have for LBVs. The SN precursors seem to be some sort of eruptive or explosive mass-loss event, but the underlying cause is not yet known. Unlike many of the LBVs, however, the pre-SN eruptions provide a telling clue — i.e. for some reason they appear to be synchronized with the time of core collapse. This is interesting, since we do know that core evolution proceeds rapidly through several different durning stages as a massive star approaches core collapse. It is perhaps natural to associated these pre-SN eruptions with Ne and O burning, each of which lasts roughly a year (see Quataert & Shiode 2011; Smith & Arnett 2014). Carbon burning lasts at least several centuries (too long for the immediate SN precursors, but possibly important in some SNe IIn), while Si burning lasts only a day or so (too short). A number of possible instabilities that may occur in massive stars during these phases is discussed in more detail by Smith & Arnett (2014), as well the specific case of wave-driven mass loss by Quataert & Shiode (2011) and Shiode & Quataert (2013).
In extremely massive stars with initial masses above 100 , a series of precursor outbursts can occur as a result of the pulsational pair instability (PPI; see chapter by Heger & Woosley). These eruptions are thought to occur in a range of initial masses (roughly 100-150 ) where explosive O burning events are insufficient to completely disrupt the star as a final SN, but which can give rise to mass ejections with roughly the mass and energy required for conditions observed in luminous SNe IIn precursors. The PPI should occur far too rarely (1% or less of all core-collapse SNe) to explain all of the SNe IIn (which are about 8-9% of ccSNe; Smith et al. 2011b). It may, however, provide a plausible explanation for the much more rare cases of SLSNe of Type IIn.
3.7 Type Ic SLSNe and GRBs
Not all SLSNe are Type IIn, and not all SLSNe have H in their spectra. The progenitors of SNe IIn are required to eject a large mass of H in just a few years before core collapse, so they must retain significant amounts of H until the very ends of their lives. This fact is in direct conflict with stellar evolution models, as noted above. There are also, however, a number of SNe that may be associated with the deaths of VMSs which have shed all of their H envelopes and possibly their He envelopes as well before finally exploding. Recall that SNe with no visible sign of H, but which do show strong He lines are Type Ib, and those which shown neither H or He are Type Ic (see Fillipenko 1997 for a review of SN classification). (Type IIb is an intermediate category that is basically a Type Ib, but with a small (0.1 ) mass of residual H left, and so the SN is seen as a Type II in the first few weeks, but then transitions to look like a Type Ib.) Together, Types Ib, Ic, and IIb are sometimes referred to as “stripped envelope” SNe. The stripped envelope SNe most closely related to the deaths of VMSs are the SLSN of Type Ic, and the broad-lined Type Ic supernovae that are observed to be associated with GRBs.
SLSN Ic. The most luminous SNe known to date turn out to be of spectral Type Ic. The prototypes for this class are objects like SN 2005ap (Quimby et al. 2007) and a number of other cases discussed by Quimby et al. (2011). Although these SNe were discovered around the same time as SN 2006gy, their true nature as the most luminous Type Ic SNe wasn’t recognized until a few years later. This is because they were actually located at a fairly substantial redshift (0.2 to 0.3), causing their visual-wavelength spectra to appear unfamiliar. It turns out that these objects are closest to Type Ic spectra, with no H and little if any He visible in their spectra.333There is so far only one exception to this, which is SN 2008es (Miller et al. 2010; Gezari et al. 2010), whose light curve is shown in Figure 3. This object is a SLSN of Type II, with broad H lines in its spectra, and is not a Type IIn. The total mass of H in its envelope is not well constrained, however. Once their redshifts were recognized, it became clear that these SNe were the most luminous of any SNe known, having peak absolute magnitudes around 22 to 23. These SNe are also hotter than normal Type Ic SNe, however, with the peak of their spectral energy distribution residing in the near-UV; this enhances their visual-wavelength apparent brightness (and detectability) because of the redshifts at which they are found. The hotter photospheric temperatures are likely related to their lack of H and He. Unlike SNe IIn, these obeject do not have narrow lines in their spectra; their spectra exhibit broad absorption lines that are more like normal SNe. More detailed information about these objects is available in two recent reviews (Quimby et al. 2011; Gal-Yam 2012).
The three possible physical driving mechanisms for these explosions are the same as those mentioned above for all SLSNe: (1) Interaction between a SN shock and an opaque CSM shell, (2) Magnetar birth, or (3) Pair instability SN. Even though these objects do not have narrow lines in their spectra (and therefore lack tell-tale signatures of CSM interaction), the first is a possible power source if the opaque CSM shell has a sharp outer boundary that is smaller than the diffusion radius in the CSM. If this is the case, then the shock will break out of the CSM and photons will diffuse out afteward, producing a broad-lined spectrum (Smith & McCray 2007; Chevalier & Irwin 2011). Magnetar-driven SNe (Kasen & Bildsten 2010; Woosley 2010) provide another possible power source for SLSNe Ic, and so far appear to be consistent with all available observations. Recently, Inserra et al. (2013) have presented evidence that favors the magnetar model for these SLSNe Ic, seen in the late-time data. The third mechanism of a pair instability SN (PISN) is perhaps the oldest viable idea for making SLSNe from very massive stars (Barkatt et al. 1967; Bond et al. 1984), but so far evidence for this type of explosion remains unclear. Most of the SLSNe Ic fade too quickly to be PISNe; for their observed peak luminosities they would require 10 of 56Ni in order to be powered by radioactive decay, but the rate at which they are observed to fade from peak is much faster than the 56Co rate (Quimby et al. 2011). So far only one object among the SLSNe Ic, SN 2007bi, has a fading rate that is consistent with radioactivity (Gal-Yam et al. 2009), but the suggestion that this is a true PISN is controversial, as noted earlier (Dessart et al. 2012). It remains unclear if any PISN have yet been directly deteted. Originally these SNe were predicted to occur only for extremely massive stars in the early universe (with little mass loss), as discussed more extensively in the chapter by Woosley & Heger.
SNe Ic-BL associated with GRBs. Gamma Ray Bursts (GRBs) represent another example of the possible deaths of VMSs. The detailed observed properties of GRBS, the variety of GRBs (short vs. long duration, etc.), and their history is too rich to discuss here (see Woosley & Bloom 2006 for a review). Instead we focus on the observable SNe that are associated with long-duration GRBs, which are thought to result from core collapse to a black hole in the death of a massive star.
So far, the only type of SN explosion seen to be associated with GRBs are the so called “broad-lined” Type Ic, or SN Ic-BL. Here we must be careful in terminology. While earlier in this chapter we referred to the fact that normal SNe have broad lines, at least compared to the narrow and intermediate-width lines seen in SNe IIn, the class of SN Ic-BL have extremely broad absorption lines in their spectra. A normal SN typically has lines that indicate outflow speeds of 10,000 km s-1, but SNe Ic-BL exhibit expansion speeds closer to 30,000 km s-1, or 0.1c. These trans-relativistic speeds are related to the fact that a GRB has a highly relativistic jet that is seen as the GRB, if we happen to be observing it nearly pole-on. Since kinetic energy goes as velocity squared, these very fast expansion speeds in SNe Ic-BL imply large explosion energy, and have led them to be referred to as “hypernovae” by some researchers. The reason to associate these SNe Ic-BL and GRBs with the possible deaths of VMSs is that the favored scenario for producing the relativistic jet (the “collapsar”, see Heger & Woosley chapter) involves a collapse to a black hole that is thought to occur in stars with initial masses above 30 . Although the GRBs and the afterglows are extremely luminous, the SN explosion seen as SNe Ic-BL that follow the GRBs are not extremely luminous (they are near the top end of the luminosity distribution for normal SNe, with peaks of 19 or 20 mag), and certainly not as luminous as the class of SLSN Ic discussed above.
Host Galaxies. An interesting commonality is found between SLSNe Ic and the class of SN Ic-BL associated with GRBs. In addition to sharing the Ic spectral type, indicating a progenitor stripped of both its H and He layers, the two groups seem to arise preferentially in similar environments. Namely, both classes of Ic occur preferentially in relatively low-mass host galaxies with low metallicity (Neill et al. 2011; Modjaz et al. 2008). This may hint that these two classes of SNe are the endpoints of similar evolution in massive stars at low metallicity, but that some additional property helps to determine if the object is a successful GRB or not. Since one normally associates stronger mass loss and stripping of the H and He layers with stronger winds (and therefore higher metallicity), the low-metallicity hosts of these SNe may hint that binary evolution plays a key role in the angular momentum that is needed (especailly for the production of GRB jets), with an alternative explanation relying upon chemically homogeneous evolution of rapidly rotating stars (see Yoon & Langer 2005). In this vein, it is perhaps interesting to note that magnetars have been suggested as another possible driving source for GRBs, while magnetar birth is also a likely explanation for SLSNe Ic as noted above. This is still an active topic of current research.
4 Detected Progenitors of Type IIn Supernovae
While the previous section described inferred connections between very luminous SNe and VMSs, these connections are however indirect, based primarily on circumstantial evidence. For example, they rely upon the large mass of CSM needed in SNe IIn, the observed wind speeds, and the requirement of extreme eruptive variability only demonstrated (to our knowledge) by evolved massive stars like LBVs, and the possible association with magnetars or collapsars. However, our most direct way to draw a connection between a SN and the mass of the star that gave rise to it is to directly detect the progenitor star itself in archival images of the explosion site taken before the SN occurred. The increase of successful cases of this in recent years is thanks in large part to the existence of archival HST images of nearby galaxies, and this has now been done for a number of normal SNe and for a small collection of Type IIn explosions (only one of which qualifies as a super-luminous SN). For this technique to work in identifying the progenitor star, one must be lucky444Another somewhat less direct technique for estimating the mass of a SN progenitor star is to analyze the stellar population in the nearby SN environment. The age of the surrounding stellar population provides a likely (although not necessarily conclusive) estimate of the exploded star’s lifetime and initial mass. While this information can only be obtained for the nearest SNe, it can be performed after the SN fades and therefore does not require the lucky circumstance of having a pre-existing high-quality archival image. enough to have a high quality, deep image of the explosion site in a public archive.
The first cases of a direct detection of a SN progenitor star were the very nearby explosions of SN 1987A in the Large Magellanic Cloud and SN 1993J in M 81, using archival ground-based data. With the advent of HST, this technique could be pushed to host galaxies at larger distances, and a number of such cases up until 2008 were reviewed by Smartt (2009). New examples continue to be added since the Smartt (2009) review, including the very nearby SN IIb in M101, SN 2011hd (Van Dyk et al. 2013). Most of the progenitor detections so far (and all those discussed in the Smartt 2009 review) are for SNe II-P and IIb, all with relatively low implied initial masses (20 ).
The technique for identifying SN progenitors requires very precise work. Once a nearby SN is discovered, one must determine if an archival image of sufficient quality exists (it is frustrating, for example, to find that your SN occurred at a position that is right at the very edge of a CCD chip in an archival image, or just past that edge). Then one must obtain an HST image or high-quality ground-based image (with either excellent seeing or adaptive optics) of the SN itself, in order to perform very careful and precise astrometry to pinpoint the exact position of the SN (usually the precision is a few percent of an HST pixel). The exact position of the SN must then be identified on the pre-explosion archival image of the SN site, using reference stars in common to both images (preferably at the same wavelengths), and then finally one can determine if there is a detected point source at the SN’s location. If not, one can derive an upper limit to the progenitor star’s luminosity and mass, which is most useful in the nearest cases where the upper limit can be quite restrictive. If there is a source detected, then it becomes a “candidate” progenitor, because it could also be a chance alignment, a companion star in a binary or triple system, or a host cluster. The way to tell is to wait several years and verify that this candidate progenitor source has disappeared after the SN fades beyond detectability.
Once a secure detection is made, one can then use the pre-explosion image to estimate the apparent and absolute magnitudes of the star, and to estimate colors if there are multiple filters. After correcting for the effects of extinction and reddening of the progenitor (which might include the effects of unknown amounts of CSM dust that was vaporized by the SN), one can place the progenitor star on an HR diagram. One can then use single-star evolution tracks to infer a rough value for the star’s initial mass, by comparing the progenitor’s position on the HR diagram to the expected luminosity and temperatures at the endpoints of evolution models (note, however, that trajectories of these evolution tracks are highly sensitive to assumptions about mass loss and mixing in the models, and the 1D models do not include possible instabilities in late burning phases; see Smith & Arnett 2014). The technique favors types of progenitor stars that are luminous in the filters used for other purposes (usually nearby galaxy surveys, using and -band filters), allowing them to be more easily detected. For example, WR stars are the expected progenitors of at least some SNe Ibc, but while these stars are luminous, they are also hot and therefore emit most of their flux in the UV. Compared to a red supergiant at the same distance, they are therefore less easily detected in the red -band filters that are often used in surveys of nearby galaxies that populate the HST archive. Similarly, very luminous progenitors that emit much of their luminosity at visual eavelengths, like LBVs, should be relatively easy to detect at a given distance. This probably explains why we have multiple cases of LBV-like progenitors, despite the relatively small numbers of very massive stars.
A central issue for understanding VMSs is whether they make normal SNe when they die, rare and unusual types of SNe (like SLSNe or Type IIn), or if instead they have weak/failed SNe as core material and 56Ni falls back into a black hole (making them difficult or impossible to observe). A common expectation from single-star evolution models combined with core collapse studies (e.g., Heger et al. 2003 and references therein; see also the chapter by Woosley & Heger) is that stars with initial masses above some threshold (for example, 30 , although the exact value differs from one study to the next) will collapse to a black hole and will fail to make a successful bright SN explosion, unless special conditions such as very rapid rotation and envelope stripping can lead to a collapsar and GRB.
Observationally, there are at least four cases where stars more massive than 30 do seem to have exploded successfully, and all of these are Type IIn (recall that these cases may be biased because LBV-like progenitos are very bright and easier to detect than hotter stars of the same bolometric luminosity). The four cases are listed individually below.
SN 2005gl. SN 2005gl was a moderately luminous SN IIn (Gal-Yam et al. 2007). Pre-explosion images showed a source at the SN position that faded below detection limits after the SN had faded (Gal-Yam & Leonard 2009). Its high luminosity suggested that the progenitor was a massive LBV similar to P Cygni, with an initial mass of order 60 and a mass-loss rate shortly before core-collapse of 0.01 yr-1 (Gal-Yam et al. 2007).
SN 1961V. Another example of a claimed detection of a SN IIn progenitor, SN 1961V, has a more complicated history because it is much closer to us and more highly scrutinized. For decades SN 1961V was considered a prototype (although the most extreme case) of giant eruptions of LBVs, as noted above, and an analog of the 19th century eruption of Carinae (Goodrich et al. 1989; Filippenko et al. 1995; Van Dyk et al. 2002). However, two recent studies (Smith et al. 2011a; Kochanek et al. 2011) argue for different reasons that SN 1961V was probably a true core-collapse SN IIn. Both studies point out that the pre-1961 photometry of this source’s variability was a detection of a very luminous quiescent star, as well as a possible precursor LBV-like giant eruption in the few years before the supposed core collapse. While the explosion mechanism of SN 1961V is still debated (e.g., Van Dyk & Matheson 2012), the clear detection and post-outburst fading of its LBV progenitor is at least as reliable as the case for SN 2005gl. SN 2005gl was shown to have faded to be about 1.5 mag fainter than its progenitor star, whereas SN 1961V is now at least 6 mag fainter than its progenitor. In any case, the luminosity of the progenitor of SN 1961V suggests an initial mass of at least 100-200 .
In the previous two cases, the SN has now faded enough that it is fainter than its detected progenitor star. The implication is that the luminous progenitor stars detected in pre-explosion images are no longer there, and are likely dead. This provides the strongest available evidence that these detected sources were indeed the stars that exploded to make the SNe we saw, and not simply a chance alignment of another unrelated star, a star cluster, or a companion star in a binary. This is not true for the next two sources, which are still in the process of fading from their explosion. We will need to wait until they fade to be sure that the candidate sources are indeed the star that exploded.
SN 2010jl. Of the four progenitor detections discussed here, SN 2010jl is the only explosion that qualifies as a SLSN, with a peak absolute magnitude brighter than 20 mag. Smith et al. (2011c) identified a source at the location of the SN in pre-explosion HST images. The high luminosity and blue colors of the candidate progenitor suggested either an extremely massive progenitor star or a very young and massive star cluster; in either case it seems likely that the progenitor had an initial mass well above 30 . In this case, however, the SN has not yet faded (it is still bright after 3 yr), so we will need to wait to solve the issue of whether the source was the prognitor or a likely host cluster.
SN 2009ip. Although its name says “2009”, SN 2009ip is the most recent addition to the class of direct SN IIn progenitor detections, because while the 2009 discovery event was a SN impostor, the same object now appears to have suffered a true SN in 2012 (Mauerhan et al. 2013; Smith et al. 2014). SN 2009ip is an exceptional case, and is discussed in more detail below (Sect. 5). For now, the relevant point to mention is that archival HST images obtained a decade before the initial discovery revealed a luminous point source at the precise location of the transient. If this was the quiescent progenitor star, the implied initial mass is 50-80 (Smith et al. 2010b) or 60 (Foley et al. 2011), depending on the assumptions used to caculate the mass. Thus, the case seems quite solid that the progenitor was indeed a VMS.
Altogether, all four of these cases of possible progenitors of SNe IIn suggest progenitor stars that are much more massive than the typical red supergiant progenitors of SNe II-P (Smartt 2009).
5 Direct Detections of Pre-SN Eruptions
SNe IIn (and SNe Ibn) require eruptive or explosive mass loss in just the few years preceding core collapse in order to have the dense CSM needed for their narrow-line spectra and high luminosity from CSM interaction. As noted above, the timescale is constrained to be within a few years beforehand, based on the observed expansion speed of the pre-shock gas and the derived radius of the shock and photosphere.
Until recently, these pre-SN eruptions were mostly hypothetical, limited to conjectures supported by the circumstantial evidence that something must deposit the outflowing CSM so close to the star. However, we now have examples of SN explosions where a violent outburst was detected in the few years before a SN, and in all cases the SN had bright narrow emission lines indicative of CSM interaction. The two most conclusive detections of an outburst are SN 2006jc and SN 2009ip, and they deserve special mention. SN 1961V and SN 2010mc also had pre-peak detections, although the data are less complete, and the interpretations are more controversial.
SN 2006jc. - SN 2006jc was the first object clearly recognized to have a brief outburst 2 years before a SN. The precursor event was discovered in 2004 and noted as a possible LBV or SN impostor. It had a peak luminosity similar to that of Car (absolute magnitude of 14), but was fairly brief and faded after only a few weeks (Pastorello et al. 2007). No spectra were obtained for the precursor transient source, but the SN explosion 2 years later was a Type Ibn with strong narrow emission lines of He, indicating moderately slow (1000 km s-1) and dense H-poor CSM (Pastorello et al. 2007; Foley et al. 2007). There is no detection of the quiescent progenitor, but the star is inferred to have been a WR star based on the H-poor composition of the CSM.
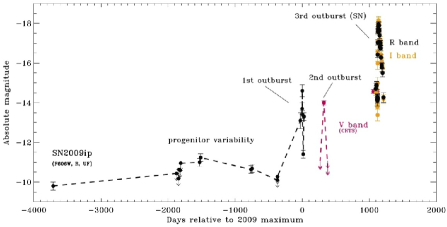
SN 2009ip. A much more vivid and well-documented case was SN 2009ip, mentioned earlier. It was initially discovered and studied in detail as an LBV-like outburst in 2009, again with a peak absolute magnitude near 14. This time, however, several spectra of the pre-SN eruptions were obtained, and these spectra showed properties similar to LBVs (Smith et al. 2010b; Foley et al. 2011). Also, a quiescent progenitor star was detected in archival HST data taken 10 yr earlier, which as noted above, indicated a VMS progenitor. In the 5 yr preceding its discovery as an LBV-like eruption, the progenitor also showed slow variability consistent with an S Dor-like episode without a major increase in bolometric luminosity, characteristic of LBVs. The object then experienced several brief luminosity peaks over 3 yrs that looked like additional LBV eruptions (unlike SN 2006jc, detailed spectra of these progenitor outbursts were obtained), culminating in a final SN explosion in 2012 (Mauerhan et al. 2013a; Smith et al. 2014). The SN light curve was double-peaked, with an initially fainter bump (15 mag) that had very broad (8000 km s-1) emission lines probably formed in the SN ejecta photosphere, and it rose quickly 40 days later to a peak of 18 mag, when it looked like a normal SN IIn (caused by CSM interaction, as the SN crashed into the slow material ejected 1-3 years earlier; see Mauerhan et al. 2013a and Smith et al. 2014). A number of detailed studies of the bright 2012 transient have now been published, although there has been some controversey about whether the 2012 event was a true core-collapse SN (Mauerhan et al. 2013a; Prieto et al. 2013; Ofek et al. 2013a; Smith et al. 2013, 2014) or not (Pastorello et al. 2013; Fraser et al. 2013; Margutti et al. 2013). More recently, Smith et al. (2014) have shown that the object continues to fade and its late-time emission is consistent with late-time CSM interaction in normal Type IIn supernovae. In any case, SN 2009ip provides us with the most detailed information about any SN progenitor for a decade preceding the SN, with a detection of a quiescent progenitor, several LBV-like precursor eruptions of two different types, and detailed high-quality spectra of the star. This object paints a very detailed picture of the violent death throes in the final years in the life of a VMS.
SN 2010mc. Ofek et al. (2013b) reported the discovery of a precursor outburst in the 40 days before the peak of SN 2010mc, recognized after the SN by analyzing archival data. Smith et al. (2013a,2013b) showed that the light curve of SN 2010mc was nearly identical to that of the 2012 supernova-like event of SN 2009ip, to a surprising degree. Smith et al. (2014) proposed that the 40 day precursor events in both SN 2009ip and SN 2010mc were in fact the SN explosions, since this is when very broad P Cygni features were seen in the spectra, and that the following rise to peak was actually due to additional luminosity generated by intense CSM interaction. In that case, the 40 day precursor event of SN 2010mc was not actually a pre-SN eruption, but the SN itself. Nevertheless, the similarity in light curves and spectra between SN 2009ip and SN 2010mc would obviously suggest that SN 2010mc probably did have a series of pre-SN LBV-like erutions too, although those preceding events were not detected.
SN 1961V. The remarkable object SN 1961V has extensive temporal coverage of its pre-SN phases and solid detections of a luminous and highly variable progenitor, moreso than any other SN. The luminous (12.2 mag absolute at blue/photographic wavelengths) progenitor is well detected in data reaching back to more than 20 yr preceding the SN, which includes some small (0.5 mag) fluctuations in brightness that could be S Dor-like LBV episodes. In the year before the SN, there is one detection at an absolute magnitude of roughly 14.5, although since it is only one epoch, we don’t know if this was an LBV giant eruption or the beginning of the SN. Then in 1961 there was a 100 day plateau at almost 17 mag followed by a brief peak at about 18 mag. After this, the SN faded rapidly and has been fading ever since, except for some plateaus or humps in the declining light curve within 5 yr after peak. Currently, the suggested source at the same position is about 6 mag fainter than the progenitor, and shows H emission. In chronological order, SN 1961V was therefore the first direct detection of a pre-SN eruption. In practice, however, the significance of this has been overlooked because the 1961 event was discussed in terms of LBV eruptions (it was considered a “super- Car-like event”), and was not thought to be a true SN. It is only the much more recent recognition that SN 1961V could have been a true core-collapse Type IIn supernova (Smith et al. 2011a; Kochanek et al. 2011) that underscores the implications of the pre-1961 photometric evidence.
These direct discoveries of pre-SN transient events provide strong evidence that VMSs suffer violent instabilities associated with the latest phases in a massive star’s life. The extremely short timescale of only a few years probably hints at severe instability in the final nuclear burning sequences, especially Ne and O burning (Smith & Arnett 2014; Shiode & Quataert 2013; Quataert & Shiode 2012), each of which lasts about 1 yr. These instabilities may be exacerbated in the most massive stars, athough much theoretical work remains to be done. The increased instability at very high initial masses is certainly true in cases where the pre-SN eruptions result from the pulsational pair instability (see the chapter by Woosley & Heger), but it may extend to other unkown nuclear burning instabilities as well (Smith & Arnett 2014). Although the events listed above are just a few very lucky cases, they may also be merely the tip of the iceberg. Undoubtedly, continued work on the flood of new transient discoveries will reveal more of these cases. Future cases will be interesting if high-quality data can place reliable constraints on the duration, number, or luminosity of the pre-SN outbursts that will allow for a meaningful comparison with LBV-like eruoptions. The limitation will be the existence of high-quality archival data over long timescales of years before the SNe, but these sorts of archives are always becoming more populated and improved. When LSST arrives, it will probably become routine to detect pre-SN outbursts.
6 Looking Forward (or Backward, Actually)
Very massive stars are very bright, and their SLSNe are even brighter. Thus, we can see them at large distances, and there is hope that we may soon be able to see light from the explosions of some of the earliest stars in the Universe. The fact that VMSs appear to suffer pre-SN instability that leads to the ejection of large amounts of mass — which in turn enhances the luminosity of the explosion — helps our chances of seeing the first SNe. There is an expectation that the low metallicity environments in the early Universe may favor the formation of very massive stars because of the difficulty in cooling and fragmentation during the star-formation process.
So then we must ask what happens to these stars and their explosions as we move to very low metallicity? How does the physics of eruptions and explosions in the local universe translate to the low-metallicity environments of the earlier universe?
Traditional expectations for massive star evolution are that lower metallicity means lower mass-loss rates (e.g., Heger et al. 2003), since line-driven winds of hot stars have a strong metallicity dependence. It is somewhat ironic, then, that the SNe associated with VMSs have some of the most extreme mass-loss rates (SNe IIn and SLSNe Ic), but these appear to favor host galaxies with low metallicity. This contradicts the simple expectation that lower metallicity means lower mass loss, and the implication is that eruptive mass-loss and mass transfer in binary systems may play an extremely important role. It may, in fact, dominate the observed populations of different types of SNe (Smith et al. 2011b). In that case, extrapolating back to low-metallicity conditions in the early univere is not so easy. Binary evolution is not well understood even in the local universe, so extrapolating to a regime where there is no data remains rather adventurous.
The main theme throughout this chapter is that VMSs seem to suffer violent eruptions that impact their evolution and drastically modify the type of SN seen. These eruptions may be very important and may actually dominate the mass lost by VMSs in the local universe, and it is important to recognize that they are probably much less sensitive to changes in metallicity than line-driven winds. The two leading candidates for the physical mechanism of driving this eruptive mass loss are continuum-driven super-Eddington winds and hydrodynamic explosions. While we are not yet certain of the triggering mechanism(s) for either type of event, which may turn out to depend somehow on metallicity, the physical mechamisms that drive the mass loss are not metallicity dependent.
Super-Eddington continuum-driven winds rely on electron scattering opacity to transfer radiation momentum to the gas (see the chapter by Owocki; Owocki et al. 2004; Smith & Owocki 2006), and this is independent of metallicity since it only requires electrons supplied by ionized H. This occurs because absorption lines are saturated for high densities in winds with mass-loss rates much above 10-4 yr-1 (recall that LBV eruptions typically have mass-loss rates of 0.01 yr-1 or more). Non-terminal hydrodynamic explosions are driven by a shock wave, and shock waves can obviously still accelerate gas even with zero metal content. If the shocks are driven by some sort of instability in advanced nuclear burning stages (using the ashes of previous burning stages as fuel), it seems unlikely that this would depend sensitively on the initial metallicity that the star was born with. Since these eruptive mechanisms appear to be important for heavy mass loss of VMS in the local universe, there is a good chance that they will still operate or may even be enhanced at low metallicity (Smith & Owocki 2006). The recent recognition that SLSNe appear to favor low-metallicity hosts (see above) would seem to reinforce this suspicion.
One of the key missions for the James Webb Space Telescope (JWST) will be to detect the light of the explosions from the first stars. Given the arguments above, we should perhaps be hopeful that JWST may be able to see extremely luminous SNe from very massive stars, if they suffer similar types of pre-SN eruptive mass loss.
References
- (1) Barkat Z, et al. 1967. Phys. Rev. Lett, 18: 379
- (2) Bond JR, Arnett WD, Carr BJ. 1984. ApJ, 280: 825
- (3) Chatzopoulos E, Wheeler JC, Vinko J, Horvath ZL, Nagy A. 2013. ApJ, 773: 76
- (4) Chevalier RA, Fransson C. 1994. ApJ, 420: 268
- (5) Chevalier RA, Irwin 2011. ApJ, 729: L6
- (6) Chini R, Hoffmeister VH, Nasseri A, Stahl O, Zinnecker H. 2012. MNRAS, 424: 1925
- (7) Chugai NN, Danziger IJ. 1994. MNRAS, 268: 173
- (8) Chugai NN, Blinnikov SI, Cumming RJ, et al. 2004. MNRAS, 352: 1213
- (9) Clark JS, Larionov VM, Arkharov A. 2005. A&A, 435:239
- (10) Conti PS. 1984. IAUS, 105: 233
- (11) Daminelli A, et al. 1997. New Astron., 2: 107
- (12) Davidson K, Humphreys RM. 1997. ARA&A, 35: 1
- (13) Davidson K, et al. 1986. ApJ, 305: 867
- (14) de Koter A, et al. 1996. A&A, 306, 501
- (15) Dessart L, et al. 2012. MNRAS, 426: L76
- (16) Falk S, Arnett WD. 1977. ApJS, 33: 515
- (17) Ferland GJ, et al. 1998. PASP, 110: 761
- (18) Filippenko AV. 1997. ARA&A, 35: 309
- (19) Filippenko AV, et al. 1995. AJ, 110: 2261
- (20) Foley RJ, Smith N, Ganeshalingam M, et al. 2007. ApJ, 657: L105
- (21) Foley RJ, Berger E, Fox O, et al. 2011. ApJ, 732: 32
- (22) Fraser M, Inserra C, Jerkstrand A, et al. 2013. MNRAS, 433: 1312
- (23) Gal-Yam A, Leonard DC, Fox DB, et al. 2007. ApJ, 656: 372
- (24) Gal-Yam A, Leonard DC. 2009. Nature, 458: 865
- (25) Gal-Yam A, et al. 2009. Nature: 462, 624
- (26) Gal-Yam A. 2012. Science, 337: 927
- (27) Garcia B, Mermilliod J. 2001. A&A, 368: 122
- (28) Goodrich RW, et al. 1989. ApJ, 342: 908
- (29) Gomez H, et al. 2010. MNRAS, 401: L48
- (30) Groh JH, Hillier DJ, Damineli A, et al. 2009. ApJ, 698: 1698
- (31) Groh JH, Vink, J. 2011. A&A, 531: L10
- (32) Gull T et al. 2005. ApJ, 620: 442
- (33) Gvaramadze VV, Kniazev AY, Fabrika S. 2010. MNRAS, 405: 520
- (34) Hubble E, Sandage A. 1953. ApJ, 118: 353
- (35) Humphreys RM, Davidson K. 1994. PASP, 106: 1025
- (36) Humphreys RM, Davidson K, Smith N. 1999. PASP, 111: 1124
- (37) Inserra C, et al. 2013. ApJ, 710: 128
- (38) Kasen D, Bildsten L. 2010. ApJ, 717: 245
- (39) Kiewe M, et al. 2012. ApJ, 744: 10
- (40) Kiminki DC, Kobulnicky HA. 2012. ApJ, 751: 4
- (41) Kiminki DC, Kobulnicky HA, Erwig I, et al. 2012. ApJ, 747: 41
- (42) Kobulnicky HA, Fryer CL. 2007. ApJ, 670: 747
- (43) Kochanek CS, Szczygiel DM, Stanek KZ. 2011. ApJ, 737: 76
- (44) Kotak R, Vink JS. 2006. A&A, 460: L5
- (45) Langer N. 2012. ARA&A, 50: 107
- (46) Madura et al. 2012. MNRAS, 420: 2064
- (47) Massey P. 2006. ApJ, 638: L93
- (48) Massey P, et al. 2007. AJ, 134: 2474
- (49) Mauerhan JC, Smith N, Filippenko AV, et al. 2013a. MNRAS, 430: 1801
- (50) Mauerhan JC, Smith N, Silverman JM, et al. 2013b. MNRAS, 431: 2599
- (51) Modjaz M, Kewley L, Kirshner RP, et al. 2008. ApJ, 702: 226
- (52) Morris P, et al. 1999. Nature, 402: 502
- (53) Moriya TJ, Blinnikov SI, Baklanov PV, Sorokina EI, Dolgov AP. 2013. MNRAS, 430: 1402
- (54) Morse JA, et al. 2001. ApJ, 548: L207
- (55) Neill JD, Sullivan M, Gal-Yam A, et al. 2011. ApJ, 727: 15
- (56) Ofek EO, Cameron PB, Kasliwal MM, et al. 2007. ApJ, 659: L13
- (57) Ofek EO, Lin L, Kouveliotou C, et al. 2013a. ApJ, 768: 47
- (58) Ofek EO, Sullivan M, Cenko SB, et al. 2013b. Nature, 494: 65
- (59) Owocki SP, Gayey KG, Shaviv NJ. 2004. ApJ, 616: 525
- (60) Pastorello A, Smartt SJ, Mattila S, et al. 2007. Nature, 447: 829
- (61) Pastorello A, Cappaellaro E, Inserra C, et al. 2013. ApJ, 767: 1
- (62) Podsiadlowski P, Ivanova N, Justham S, Pappaport S. 2010. MNRAS, 406: 840
- (63) Pooley D, et al. 2002, ApJ, 572: 932
- (64) Prieto JL, Stanek KZ, Beacom JF. 2008a. ApJ, 673: 999
- (65) Prieto JL, Stanek KZ, Kochanek CS, et al. 2008b. ApJ, 673: L59
- (66) Quataert E, Shiode J. 2012. MNRAS, 423: L92
- (67) Quimby RM, Kulkarni SR, Kasliwal MM, et al. 2011. Nature, 474: 487
- (68) Rest A, Foley RJ, Gezari S, et al. 2011. ApJ, 729: 88
- (69) Rest A, Prieto JL, Walborn NR, et al. 2012. Nature, 482: 375
- (70) Salamanca I, et al. 2002. MNRAS, 330: 844
- (71) Sana H, de Mink SE, de Koter A, et al. 2012. Science, 337: 444
- (72) Shaviv NJ. 2000. ApJ, 532: L137
- (73) Shiode J, Quataert E. 2013. preprint (arXiv:1308.5978)
- (74) Silverman JM, Nugent PE, Gal-Yam A, et al. 2013. ApJS, 207: 3
- (75) Smartt SJ. 2009. ARA&A, 47: 63
- (76) Smith N. 2006. ApJ, 644: 1151
- (77) Smith N. 2008. Nature, 455: 201
- (78) Smith N. 2011. MNRAS, 415: 2020
- (79) Smith N. 2013a. MNRAS, 429: 2366
- (80) Smith N. 2013b. MNRAS, 434: 102
- (81) Smith N. 2014. ARA&A, 52, in press (arXiv:1402:1237)
- (82) Smith N, Arnett WD. 2014, ApJ, 785, 82
- (83) Smith N, Frew D. 2011. MNRAS, 415: 2009
- (84) Smith N, McCray R. 2007. ApJ, 671: L17
- (85) Smith N, Owocki SP. 2006. ApJ, 645: L45
- (86) Smith N, Gehrz RD, Hinz PM, et al. 2003. AJ, 125: 1458
- (87) Smith N, Vink JS, de Koter A 2004. ApJ, 615: 475
- (88) Smith N, Li W, Foley RJ, et al. 2007. ApJ, 666: 1116
- (89) Smith N, Chornock R, Li W, et al. 2008. ApJ, 686: 467
- (90) Smith N, Hinkle KH, Ryde N. 2009. AJ, 137: 3558
- (91) Smith N, Chornock R, Silverman JM, Filippenko AV, Foley RJ. 2010a. ApJ, 709: 856
- (92) Smith N, Miller AA, Li W, et al. 2010b. AJ, 139: 1451
- (93) Smith N, Li W, Silverman JM, Ganeshalingam M, Filippenko AV. 2011a. MNRAS, 415: 773
- (94) Smith N, Li W, Filippenko AV, Chornock R. 2011b. MNRAS, 412: 1522
- (95) Smith N, Li W, Miller AA, et al. 2011d. ApJ, 732: 63
- (96) Smith N, Mauerhan JC, Kasliwal M, Burgasser A. 2013. MNRAS, 434, 3721
- (97) Smith N, Mauerhan JC, Prieto JL. 2014. MNRAS, 438: 1191
- (98) Sutherland PG, Wheeler JC. 1984. ApJ, 280: 282
- (99) Tammann GA, Sandage A. 1968. ApJ, 151: 825
- (100) Thompson TA, Prieto JL, Stanek KZ, et al. 2009. ApJ, 705: 1364
- (101) Trundle C, et al. 2008. A&A, 483: L47
- (102) Van Dyk SD, Matheson T. 2012. ApJ, 746: 179
- (103) Van Dyk SD, et al. 2002. PASP, 114: 700
- (104) Van Dyk SD, Zheng WK, Clubb KI, et al. 2013. ApJ, 772: L32
- (105) van Genderen A. 2001. A&A, 366: 508
- (106) van Marle AJ, Smith N, Owocki SP, van Veelen B. 2010. MNRAS, 407: 2305
- (107) Wachter S, Mauerhan JC, Van Dyk, SD, et al. 2010. AJ, 139: 2330
- (108) Wolf B. 1989. A&A, 217: 87
- (109) Woosley SE. 2010. ApJ, 719: L204
- (110) Woosley SE, Bloom JS. 2006. ARA&A, 44: 507
- (111) Yoon SC, Langer N. 2005. A&A, 443: 643