The age-metallicity relationship in the Fornax spheroidal dwarf galaxy
Abstract
We produce a comprehensive field star age-metallicity relationship (AMR) from the earliest epoch until 1 Gyr ago for three fields in the Fornax dSph galaxy by using photometric data obtained with at the . We find that the innermost one does not contains dominant very old stars (age 12 Gyr), whereas the relatively outer field does not account for representative star field populations younger than 3 Gyr. When focusing on the most prominent stellar populations, we find that the derived AMRs are engraved by the evidence of a outside-in star formation process. The studied fields show bimodal metallicity distributions peaked at [Fe/H] = (-0.95 0.15) dex and (-1.15 or -1.25 0.05) dex, respectively, but only during the first half of the entire galaxy lifetime. Furthermore, the more metal-rich population appears to be more numerous in the outer fields, while in the innermost Fornax field the contribution of both metallicity populations seems to be similar. We also find that the metallicity spread 6 Gyr ago is remarkable large, while the intrinsic metallicity dispersion at 1-2 Gyr results smaller than that for the relatively older generations of stars. We interpret these outcomes as a result of a posssible merger of two galaxies that would have triggered a star formation bursting process that peaked between 6 and 9 Gyr ago, depending on the position of the field in the galaxy.
keywords:
techniques: photometric – galaxies: dwarf – galaxies: individual: Fornax1 Introduction
In the widely accepted Cold Dark Matter (CDM) cosmological scenario, dwarf galaxies are key pieces in the galaxy formation and evolution puzzle. Their evolution is very likely affected by numerous processes such interactions with other systems, supernovae feedback, cosmic reionization, among others. Characterizing their evolution could shed light on the physical mechanisms involved.
The Milky Way (MW) satellites provide a unique opportunity to study in detail galaxy formation and chemical evolution processes. Considered traditionally as relatively simple systems, dwarf spheroidals (dSphs) are so far the most common types within the MW companions. Nevertheless, the complexity of these galaxies is becoming more evident as new detailed and deep data are available.
The Fornax dSph, located at a distance of 1365 kpc [2003, 2007, 2008, 2008, 2009], is after the Sagittarius dSph the largest and most luminous of the MW companions. These two galaxies are the only dSph MW’s satellites hosting globular clusters. Particularly, Fornax is up to date known to have a very complex structure. Two star clumps located at 17 and at 1.3 from the galaxy centre have stoked a discussion about whether Fornax suffered a merger. Coleman et al. [2004], Coleman & Da Costa [2005], and Coleman & de Jong [2008] proposed that these overdensities are shell structures resulting from a merger with a smaller gas-rich system that occurred 2 Gyr ago. The merger scenario is also supported by Amorisco & Evans [2012] who found distinct radial velocity stellar components with different metallicities, suggesting that Fornax is a merger of a bound pair.
On the another hand, de Boer et al. [2013] claimed that these clumps are more likely the result of the quiet infall of gas previously expelled by Fornax during its star formation episodes. Likewise, previous studies [2008, 2012] have assessed important variations in the star formation history depending on the galactocentric radius. Furthermore, del Pino et al. [2013] found a delay in the main star formation burst at the centre of the galaxy, which is compatible with both an outside-in formation and a merger scenario. As can be figure out, the Age-Metalliciy Relation (AMR) of Fornax should also be engraved by the different formation events that have taken place during its entire lifetime.
In this paper we revisit the data analysed by del Pino et al. [2013] by making use of a different approach [2012, 2013]. We produced the presently observed AMR for the dominant stellar populations of the galaxy from its birth until 1 Gyr ago; being able to disentangle a bimodal distribution in the metallicity. The latter may be the first direct evidence of a merger formation scenario for the Fornax dSph. In Sect. 2 we describe the data handling in order to obtain mean ages and metallicities for the representative stellar populations, while Sect. 3 deals with the construction of the Fornax’s AMR. Sect. 4 focuses on the discussion of the resulting AMR. Finally, Sect. 5 summaries our main conclusions.
2 Data handling and scope
We obtained photometric data in three fields of Fornax with at the . We refer the reader to del Pino et al. [2013] for details about the observations, reduction, and analysis of the data. Here we derive the AMR for the three Fornax fields using the procedure applied by Piatti & Geisler [2013] to produce a comprehensive field star AMR of the Large Magellanic Cloud from its earliest epoch until 1 Gyr ago. Briefly, the procedure is based on the so-called ”representative” population, assumed that the observed Main Sequence (MS) in each field is the result of the superposition of MSs with different turnoffs (ages) and constant luminosity functions. This ”representative” AMR differs from those derived from modeled Star Formation Histories (SFHs) in the fact that it does not include complete information on all stellar populations, but accounts for the dominant population present in each field. Minority populations are not considered, nor dominant populations younger than 1 Gyr, due to our inability to age-date them.
Following the precepts outlined by Piatti, Geisler & Mateluna [2012], we first subdivided the IC1, IC2, and OC fields (see Fig. 1 by del Pino et al. 2013) into 16, 20, and 12 subfields as is shown in Fig. 1. For each subfield we built the MS luminosity function by counting the number of stars in bins of 0.25 mag. The chosen bin size encompasses the magnitude errors (() 0.2 mag for 25.9 mag) of the stars in each bin, thus producing an appropriate sample of the stars. Hence, the difference between the number of stars of two adjacent magnitude intervals gives the intrinsic number of stars belonging to the faintest interval. Consequently, the maximum of the distribution function of all these differences in terms of (the differential luminosity function) is directly related to the most populated TO. Similarly, following the procedure described in Piatti, Geisler & Mateluna [2012], we measured the magnitudes of the Red Clump (RC) stars, which are relatively invariant to population effects such as age and metallicity for such stars. RCs are used in age estimates based on the magnitude difference between the clump/HB and the TO for intermediate-age and old clusters. Fig. 2 shows the colour-magnitude diagram for the IC1_1 subfield with the purpose of illustrating the method. We have included in the left-hand panel the normalized and differential MS luminosity functions represented by thin and thick solid lines, and the RC luminosity distribution by a dotted line as well. Tables 1 and 2 present the derived representative (MSTO) and (RC) magnitudes for the studied Fornax subfields. According to del Pino et al. [2013], the derived (MSTO) mags result brighter than the mag at the 90 completeness level, so that we actually reach the MSTO of the representative oldest populations of the galaxy. The (MSTO) and (RC) dispersions have been calculated bearing in mind the broadness of the differential luminosity function and the (RC) distribution, instead of the photometric errors at (MSTO) and (RC) mags, respectively. The former are clearly larger, and represent in general a satisfactory estimate of the spread around the prevailing population, although some individual subfields have slightly larger spreads. These larger age spreads should not affect the subsequent results.
In order to calculate the representative ages, we first used the values listed in Tables 1 and 2 to compute the difference = (MSTO) - (RC), and then calculated the representative ages and their dispersions by using equations (3) and (4) of Geisler et al. [1997] as follows:
| (1) |
This equation is only calibrated for ages larger than 1 Gyr, so that we are not able to produce ages for younger representative populations. In addition, we also estimated representative metallicities using the equation:
| (2) |
of Da Costa & Armandroff [1990], once the colours of the Red Giant Branch (RGB) at = -3.0 mag and their dispersions were obtained (typically = 0.02 mag). The colours were derived from the intersection of the RGBs traced for each subfield and the horizontal line at = -3.0 mag, as illustrated in Fig. 3. Note that the adopted subfield size led to obtain well-defined RGBs - without any noticeable colour (age) spread -, so that the representative metallicities could be estimated from those RGBs. Table 4 provides with the derived reddening corrected values (=0.028 mag, Del Pino et al. 2013).
3 The age-metallicity relationship
The estimated values of age and metallicity with their respective dispersions for the 48 studied subfields in Fornax are treated hereafter as individual point spread functions in order to disentangle the intrinsic AMRs. In general, one of the unavoidable complications in analysing measured ages and metallicities is that they have associated dispersions. Indeed, the resulting AMR can differ appreciably depending on whether it is obtained by using only mean values. Furthermore, even if dispersions did not play an important role, the binning of the age/metallicity ranges could however bias the results. Thus, for example, by using a fixed age bin size is not appropriate for yielding the intrinsic age distribution, since the result would depend on the chosen age interval [2010]. A more robust age bin should be of the order of the age dispersions in that interval. In the star cluster arena, where the dispersion comes from the uncertainty in measuring ages, this would lead to the selection of very narrow bins for young clusters and relatively broader age bins for the older ones. Notice that the dispersions of the representative ages and metallicities quoted in Tables 3 and 5 refer to the intrinsic age and metallicity spread among the prevailing stellar populations in the respective subfields.
We then searched Table 3 to find that typical age dispersions are 0.10 log() 0.15. Therefore, we produced the AMR of the Fornax field population by setting the age bin sizes according to this logarithmic law, which traces the variation in the derived age spread in terms of the measured ages. We used intervals of log() = 0.10. We proceeded in a similar way when binning the metallicity range. In this case, we adopted a [Fe/H] interval of 0.25 dex. However, there is still an additional issue to be considered: even though the (age,[Fe/H]) bins are set to match the age/metallicity spread, any individual point in the AMR plane may fall in the respective (age,[Fe/H]) bin or in any of the eight adjacent bins. This happens when an (age,[FeH]) point does not fall in the bin centre and, due to its point spread function, has the chance to fall outside it. Note that, since we chose bin dimensions as large as the involved dispersions, such points should not fall on average far beyond the adjacent bins. We have taken all these effects into account to produce the AMR of the studied IC1, IC2, and OC Fornax fields using the procedure proposed by Piatti & Geisler [2013]. We weighed the contribution of each (age,[Fe/H]) pair to each one of the AMR grid bins occupied by it due to their point spread functions. We are confident that our analysis yields accurate morphology and position of the main features in the derived AMRs.
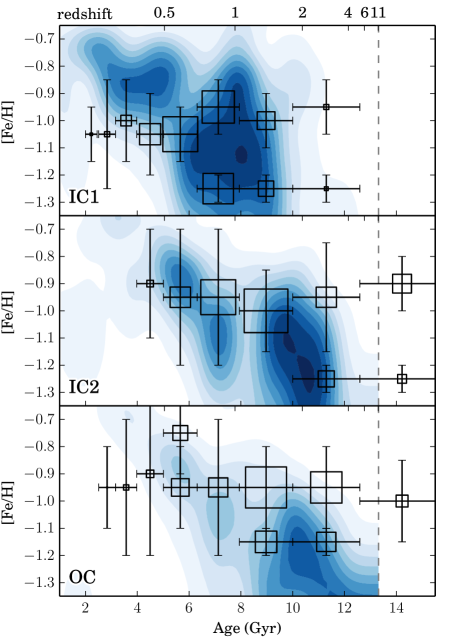
Fig. 4 shows the resulting presently observed IC1, IC2, and OC AMRs as labelled at the bottom-left margin of each panel. It is important to keep in mind that each (age,[Fe/H]) point used is simply the representative, most dominant population in that subfield, independently of whether it is primordial or recently formed. These prevailing populations trace the present-day AMR of the galaxy. They account for the most important metallicity-enrichment processes that have undergone in the galaxy lifetime. Minority stellar populations not following these main chemical galactic processes are discarded. Therefore, presently-subdominant populations in certain locations could have been in the majority in the galaxy in the past, but were not considered. This could be the case of old stellar populations placed in the innermost regions. However, unless the Fornax has had an original metallicity gradient during its birth, the metallicity of the oldest stellar populations is recovered from the dominant oldest populations. The age error bars in Fig. 4 follow the law log() = 0.10, whereas the [Fe/H] error bars come from the full width at half-maxima (FWHMs) we derived by fitting Gaussian functions to the metallicity distribution in each age interval. The size of the open boxes centred on the mean (age,[Fe/H]) values is a measure of the number of subfields used to compute them. They come from considering the total number of subfields involved in a mean (age,[Fe/H]) estimate, normalized to the total number of subfield used. Thus, the larger the number of subfields employed ( galaxy mass) to estimate a mean (age,[Fe/H]) value, the bigger the size of the box. We also included as a reference a redshift scale in the upper axis, computed assuming = 70.5 kms-1Mpc-1, m = 0.273, and a flat universe with Λ = 1 - m.
The AMRs derived by del Pino et al. [2013] are also shown as background Hess diagrams, where the most numerous the stellar populations the bluer the contour colour. The former provides with a complete solution for the SFH along the galaxy lifetime, and hence for the AMR. The present method does not give the same information, since most of the stellar populations do not appear in the solution but only those that at the present time are the representative ones, i.e., those with the presently highest number of stars.
4 Discussion
Fig. 4 shows that, although at first glance we find stars at any age in the three Fornax fields, the innermost one (IC1 field) does not contains dominant very old stars (age 12 Gyr) -they could certainly still be present as minority population though-, whereas the relatively outer IC2 field does not account for representative star field populations younger than 3 Gyr. Furthermore, when focusing on the biggest boxes of the three pannels, it seems that most of the OC field stars have been formed between 8 and 12 Gyr ago, whereas comparable signifivative star formation has occurred between 6 and 10 Gyr for IC2, and between 5 and 8 Gyr for IC1. Both results lead us to conclude that the derived AMRs are engraved by the evidence of a outside-in star formation process in Fornax.
On the metallicity side, Fig. 4 shows bimodal distributions in the three Fornax fields, but only during the first half of its entire lifetime. In order to draw such a conclusion we required the fulfillment of the following statistical criterion : ([Fe/H]1) + ([Fe/H]2) [Fe/H]1 -[Fe/H]2), where ([Fe/H]i), = 1,2, represents the intrinsic spread observed in the mean representative metallicity [Fe/H]i. As judged from the mean position of the boxes, such metallicity distributions peak at [Fe/H] = (-0.95 0.15) dex and (-1.15 or -1.25 0.05) dex, respectively. Note that both mean values are distinguishable at 1- level, i.e., the difference is () 0.10 mag, or ([Fe/H]) 0.3 dex. We interprete such a metallicity bimodality - seen along 5 Gyr - as the possible evidence of the occurrence of a merger between two galaxies during their early epoch. One of them was more metal-poor and, due to the merger, its contributed gas was chemically enriched at a metallicity level similar to the other galaxy. In addition, one of both galaxies would have contributed to the resulting outer merged mass with much more gas and stars than the other, since the metal-rich peaks in the IC2 and OC Fornax fields contain twice up to four times more stars ( more mass) than the metal-poor peak. In the innermost IC1 Fornax field, the contribution of the supossed two colliding galaxies seems to be similar.
Battaglia et al. [2006], from spectroscopic metallicities and velocities of red giant stars at the central region of the galaxy, also found evidence of a relatively recent merger of another galaxy or other means of gas accretion. Yozin & Bekki [2012] using orbits for Fornax that are consistent with the latest proper motion measurements, showed that the observed asymmetric shell-like substructures can be formed from the remnant of a smaller dwarf during minor merging. Nevertheless, since our results are constrained to three particular Fornax fields, extrapolation to other gaxaly regions requires further work.
The merger of these two galaxies would have triggered a star formation bursting process that peaked between 6 and 9 Gyr ago, depending on the position of the field in the galaxy. We draw this conclusion from the comparison of the box sizes for each one of the AMRs along the age axis. On the other hand, notice that the metallicity spread after the burst is remarkable large, probably as a consequence of the presence of not well-mixed gas out of which the new generation of star have been formed. During the most recent star formation processes that we can account for (age 1-2 Gyr), the intrinsic metallicity dispersion results smaller than that for the relatively older generations of stars.
We investigated the metallicity distributions for the three Fornax fields in three different galaxy lifetime periods, namely, 1-5 Gyr, 5-10 Gyr, and 10-15 Gyr, respectively. In order to obtain such distributions we associated each metallicity value in Fig. 4 to a gaussian distribution function with the mean [Fe/H] value, and the errorbar and box sizes being the centre, the full width at half maximum, and the amplitude of the Gaussian, respectively. We then summed the contribution of all the gaussian functions in the three lifetime periods. The results are depicted in Fig. 5, where we distinguished those for the 1-5 Gyr, 5-10 Gyr, and 10-15 Gyr age lifetime periods with solid, dotted and dashed lines, respectively. As can be seen, the bimodal metallicity distribution arises clearly during the very earlier epoch of the galaxy evolution, while the most significant amount of stars have been formed in the midst of its star formation history.
The AMRs recovered by del Pino et al. [2013] show a general good agreement with the representative AMRs derived in this work (see Fig. 4), although they do not stand for metallicity bimodality. The greatest difference occurs for the IC2 and OC fields at the age 9 Gyr. We recall that del Pino et al. considered all the observed stellar populations in the galaxy to recover the Fornax’s AMR, whereas we only focused on those most numerous ones. This means that a representative population seen in a particular subfield could be blur whenever it is included in a composite stellar population framework, so that its representative age/metallicity could result in a value in contrast with the global age/metallicity distribution. The meaning of the ”representative population” as a galaxy chemical evolution tracer, as well as how similar/different it is -in terms of galaxy chemical evolution- from that of a composite stellar population deserves further studies which are beyond the scope of this paper; the representative metallicity bimodality shown in this work being not altered.
5 Summary
From photometric data in three fields of Fornax dSph obtained with at the , we produce a comprehensive field star age-metallicity relationship (AMR) from the earliest epoch until 1 Gyr ago. Although we find stars at any age in the three Fornax fields, the innermost one does not contains dominant very old stars (age 12 Gyr), whereas the relatively outer field does not account for representative star field populations younger than 3 Gyr. Furthermore, when focusing on the most prominent stellar populations, we find that the derived AMRs are engraved by the evidence of a outside-in star formation process in Fornax.
On the metallicity side, the studied fields show bimodal distributions peaked at [Fe/H] = (-0.95 0.15) dex and (-1.15 or -1.25 0.05) dex, respectively, but only during the first half of the entire galaxy lifetime. This is a possible evidence of the occurrence of a merger between two galaxies during their early epoch. In this context, one of both galaxies would have contributed to the resulting outer merged mass with much more gas and stars than the other, while in the innermost Fornax field the contribution of the supossed two colliding galaxies seems to be similar. We also find that the metallicity spread 6 Gyr ago is remarkable large, probably as a consequence of the presence of not well-mixed gas out of which the new generation of star have been formed. During the most recent star formation processes that we can account for (age 1-2 Gyr), the intrinsic metallicity dispersion results smaller than that for the relatively older generations of stars. The merger of these two galaxies would have triggered a star formation bursting process that peaked between 6 and 9 Gyr ago, depending on the position of the field in the galaxy.
Acknowledgements
This work was partially supported by the Argentinian institutions CONICET and Agencia Nacional de Promoción Científica y Tecnológica (ANPCyT). We thank the anonymous referee, whose comments and suggestions have allowed us to improve the manuscript.
References
- [2012] Amorisco N.C., Evans N.W., 2012, ApJ, 756, L2
- [2006] Battaglia G., Tolstoy E., Helmi A., Irwin M.J., Letarte B., Jablonka P., Hill V., Venn K.A., et al., 2006, A&A, 459, 423
- [2004] Coleman M., Da Costa G.S., Bland-Hawthorn J., Martínez-Delgado D., Freeman K.C., Malin D., 2004, AJ, 127, 832
- [2005] Coleman M.G., Da Costa G.S., 2005, PASA, 22, 162
- [2008] Coleman M.G., de Jong J.T.A., 2008, ApJ, 685, 933
- [1990] Da Costa G.S., Armandroff T.E. 1990, AJ, 100, 162
- [2012] de Boer T.J.L. et al., 2012, A&A, 544, A73
- [2013] de Boer T.J.L., Tolstoy E., Saha A., Olszewski E.W., 2013, A&A, 551, A103
- [2013] del Pino A., Hidalgo S.L., Aparicio A., Gallart C., Carrera R., Monelli M. 2013, MNRAS, in press
- [1997] Geisler D., Bica E., Dottori H., Clariá J.J., Piatti A.E., Santos Jr., J.F.C. 1997, AJ, 114, 1920
- [2007] Greco C. et al., 2007, ApJ, 670, 332
- [2009] Greco C. et al., 2009, ApJ, 701, 1323
- [2003] Mackey A.D., Gilmore G.F., 2003, MNRAS, 345, 747
- [2010] Piatti A.E. 2010, A&A, 513, L13
- [2013] Piatti A.E., Geisler D. 2013, AJ, 145, 17
- [2012] Piatti A.E., Geisler D., Mateluna R. 2012, AJ, 144, 100
- [2008] Poretti E. et al., 2008, ApJ, 685, 947
- [2008] Tammann G.A., Sandage A., Reindl B., 2008, ApJ, 679, 52
- [2012] Yozin C., Bekki K., 2012, ApJ, 756, L18


| Subfield | 1 | 2 | 3 | 4 | 5 | 6 | 7 | 8 | 9 | 10 | 11 | 12 | 13 | 14 | 15 | 16 | 17 | 18 | 19 | 20 |
|---|---|---|---|---|---|---|---|---|---|---|---|---|---|---|---|---|---|---|---|---|
| IC1 | 23.55 | 23.80 | 23.75 | 23.65 | 23.75 | 23.85 | 23.75 | 23.65 | 23.65 | 23.65 | 23.75 | 23.85 | 23.85 | 23.75 | 23.75 | 23.85 | — | — | — | — |
| 0.20 | 0.30 | 0.50 | 0.40 | 0.30 | 0.30 | 0.40 | 0.50 | 0.20 | 0.30 | 0.30 | 0.40 | 0.20 | 0.30 | 0.30 | 0.30 | — | — | — | — | |
| IC2 | 23.85 | 23.95 | 23.95 | 23.85 | 23.85 | 24.45 | 23.85 | 24.05 | 24.05 | 24.05 | 24.05 | 24.15 | 24.45 | 24.05 | 24.05 | 24.05 | 24.05 | 24.25 | 24.35 | 24.25 |
| 0.20 | 0.20 | 0.20 | 0.30 | 0.20 | 0.30 | 0.20 | 0.30 | 0.30 | 0.20 | 0.30 | 0.30 | 0.20 | 0.30 | 0.30 | 0.20 | 0.30 | 0.30 | 0.20 | 0.20 | |
| OC | 24.25 | 24.05 | 24.25 | 23.85 | 24.25 | 23.85 | 24.25 | 24.05 | 24.05 | 24.35 | 24.25 | 24.25 | — | — | — | — | — | — | — | — |
| 0.20 | 0.40 | 0.40 | 0.30 | 0.15 | 0.40 | 0.30 | 0.30 | 0.30 | 0.50 | 0.30 | 0.15 | — | — | — | — | — | — | — | — |
| Subfield | 1 | 2 | 3 | 4 | 5 | 6 | 7 | 8 | 9 | 10 | 11 | 12 | 13 | 14 | 15 | 16 | 17 | 18 | 19 | 20 |
|---|---|---|---|---|---|---|---|---|---|---|---|---|---|---|---|---|---|---|---|---|
| IC1 | 21.10 | 21.10 | 21.10 | 21.10 | 21.15 | 21.10 | 21.10 | 21.10 | 21.15 | 21.10 | 21.10 | 21.10 | 21.15 | 21.15 | 21.10 | 21.10 | — | — | — | — |
| 0.05 | 0.05 | 0.05 | 0.05 | 0.05 | 0.05 | 0.05 | 0.05 | 0.05 | 0.05 | 0.05 | 0.05 | 0.05 | 0.10 | 0.05 | 0.05 | — | — | — | — | |
| IC2 | 21.15 | 21.15 | 21.20 | 21.20 | 21.20 | 21.25 | 21.15 | 21.20 | 21.15 | 21.15 | 21.20 | 21.20 | 21.15 | 21.20 | 21.20 | 21.15 | 21.15 | 21.15 | 21.15 | 21.20 |
| 0.05 | 0.05 | 0.05 | 0.05 | 0.05 | 0.05 | 0.05 | 0.05 | 0.05 | 0.10 | 0.10 | 0.05 | 0.10 | 0.05 | 0.10 | 0.05 | 0.05 | 0.05 | 0.05 | 0.05 | |
| OC | 21.25 | 21.20 | 21.15 | 21.25 | 21.25 | 21.25 | 21.20 | 21.20 | 21.15 | 21.20 | 21.20 | 21.25 | — | — | — | — | — | — | — | — |
| 0.05 | 0.05 | 0.05 | 0.05 | 0.05 | 0.05 | 0.05 | 0.05 | 0.05 | 0.05 | 0.05 | 0.05 | — | — | — | — | — | — | — | — |
| Subfield | 1 | 2 | 3 | 4 | 5 | 6 | 7 | 8 | 9 | 10 | 11 | 12 | 13 | 14 | 15 | 16 | 17 | 18 | 19 | 20 |
|---|---|---|---|---|---|---|---|---|---|---|---|---|---|---|---|---|---|---|---|---|
| IC1 | 5.26 | 6.92 | 6.55 | 5.87 | 6.20 | 7.30 | 6.55 | 5.87 | 5.56 | 5.87 | 6.55 | 7.30 | 6.92 | 6.20 | 6.55 | 7.30 | — | — | — | — |
| 1.45 | 2.62 | 3.93 | 2.91 | 2.38 | 2.75 | 3.21 | 3.55 | 1.53 | 2.26 | 2.50 | 3.54 | 1.87 | 2.72 | 2.50 | 2.75 | — | — | — | — | |
| IC2 | 6.92 | 7.70 | 7.30 | 6.55 | 6.55 | 11.64 | 6.92 | 8.12 | 8.56 | 8.56 | 8.12 | 9.02 | 12.84 | 8.12 | 8.12 | 8.56 | 8.56 | 10.53 | 11.64 | 10.01 |
| 1.87 | 2.06 | 1.96 | 2.50 | 1.78 | 4.04 | 1.87 | 3.01 | 3.15 | 2.70 | 3.44 | 3.29 | 3.74 | 3.01 | 3.44 | 2.25 | 3.15 | 3.73 | 2.89 | 2.56 | |
| OC | 9.50 | 8.12 | 10.53 | 6.20 | 9.50 | 6.20 | 10.01 | 8.12 | 8.56 | 11.07 | 10.01 | 9.50 | — | — | — | — | — | — | — | — |
| 2.45 | 3.88 | 4.80 | 2.38 | 1.96 | 3.06 | 3.58 | 3.01 | 3.15 | 6.11 | 3.58 | 1.96 | — | — | — | — | — | — | — | — |
| Subfield | 1 | 2 | 3 | 4 | 5 | 6 | 7 | 8 | 9 | 10 | 11 | 12 | 13 | 14 | 15 | 16 | 17 | 18 | 19 | 20 |
|---|---|---|---|---|---|---|---|---|---|---|---|---|---|---|---|---|---|---|---|---|
| IC1 | 1.36 | 1.32 | 1.32 | 1.38 | 1.40 | 1.38 | 1.40 | 1.38 | 1.38 | 1.38 | 1.32 | 1.40 | 1.42 | 1.40 | 1.36 | 1.32 | — | — | — | — |
| IC2 | 1.34 | 1.44 | 1.38 | 1.44 | 1.40 | 1.32 | 1.40 | 1.38 | 1.38 | 1.42 | 1.40 | 1.40 | 1.42 | 1.40 | 1.40 | 1.40 | 1.40 | 1.40 | 1.40 | 1.40 |
| OC | 1.40 | 1.42 | 1.40 | 1.48 | 1.40 | 1.40 | 1.40 | 1.40 | 1.40 | 1.40 | 1.36 | 1.36 | — | — | — | — | — | — | — | — |
| Subfield | 1 | 2 | 3 | 4 | 5 | 6 | 7 | 8 | 9 | 10 | 11 | 12 | 13 | 14 | 15 | 16 | 17 | 18 | 19 | 20 |
|---|---|---|---|---|---|---|---|---|---|---|---|---|---|---|---|---|---|---|---|---|
| IC1 | -1.10 | -1.26 | -1.26 | -1.03 | -0.96 | -1.03 | -0.96 | -1.03 | -1.03 | -1.03 | -1.26 | -0.96 | -0.90 | -0.96 | -1.10 | -1.26 | — | — | — | — |
| 0.07 | 0.08 | 0.08 | 0.07 | 0.07 | 0.07 | 0.07 | 0.07 | 0.07 | 0.07 | 0.08 | 0.07 | 0.06 | 0.07 | 0.07 | 0.08 | — | — | — | — | |
| IC2 | -1.18 | -0.84 | -1.03 | -0.84 | -0.96 | -1.26 | -0.96 | -1.03 | -1.03 | -0.90 | -0.96 | -0.96 | -0.90 | -0.96 | -0.96 | -0.96 | -0.96 | -0.96 | -0.96 | -0.96 |
| 0.08 | 0.06 | 0.07 | 0.06 | 0.07 | 0.08 | 0.07 | 0.07 | 0.07 | 0.06 | 0.07 | 0.07 | 0.06 | 0.07 | 0.07 | 0.07 | 0.07 | 0.07 | 0.07 | 0.07 | |
| OC | -0.96 | -0.90 | -0.96 | -0.73 | -0.96 | -0.96 | -0.96 | -0.96 | -0.96 | -0.96 | -1.10 | -1.10 | — | — | — | — | — | — | — | — |
| 0.07 | 0.06 | 0.07 | 0.05 | 0.07 | 0.07 | 0.07 | 0.07 | 0.07 | 0.07 | 0.07 | 0.07 | — | — | — | — | — | — | — | — |