Formation of Warped Disks by Galactic Fly-by Encounters. I. Stellar Disks
Abstract
Warped disks are almost ubiquitous among spiral galaxies. Here we revisit and test the ‘fly-by scenario’ of warp formation, in which impulsive encounters between galaxies are responsible for warped disks. Based on N-body simulations, we investigate the morphological and kinematical evolution of the stellar component of disks when galaxies undergo fly-by interactions with adjacent dark matter halos. We find that the so-called ‘S’-shaped warps can be excited by fly-bys and sustained for even up to a few billion years, and that this scenario provides a cohesive explanation for several key observations. We show that disk warp properties are governed primarily by the following three parameters: (1) the impact parameter, i.e., the minimum distance between two halos, (2) the mass ratio between two halos, and (3) the incident angle of the fly-by perturber. The warp angle is tied up with all three parameters, yet the warp lifetime is particularly sensitive to the incident angle of the perturber. Interestingly, the modeled S-shaped warps are often non-symmetric depending on the incident angle. We speculate that the puzzling U- and L-shaped warps are geometrically superimposed S-types produced by successive fly-bys with different incident angles, including multiple interactions with a satellite on a highly elongated orbit.
Subject headings:
galaxies: evolution galaxies: halos galaxies: interactions galaxies: structure methods: numerical1. Introduction
The outer parts of most disk galaxies does not seem to be aligned with the inner planes of the disks, with warps apparent from an edge-on view (e.g., Sanchez-Saavedra et al., 1990; Reshetnikov & Combes, 1998; Ann & Park, 2006). There are two major types of warps: S-shaped warps, in which one side of the plane of the disk rises and the other side declines; and U-shaped warps, in which both sides of the plane rise. In addition to these two types, Sánchez-Saavedra et al. (2003) introduced another type of warp, L-shaped warps, to describe a few galaxies with only a one-sided warp.
The first warped galaxy ever discovered was our Milky Way. Burke (1957) and Kerr (1957) independently studied the shape of the Galaxy using 21 cm hydrogen-line observation and found that the maximum deviation of the plane exceeds 300 pc at a distance of 12 kpc from the Galactic center. Subsequent hydrogen-line observations of nearby edge-on galaxies confirmed that external galaxies also show significant warping at the outer gas regions (Sancisi, 1976). Similar results were inferred from kinematic studies on less inclined galaxies (Rogstad et al., 1974; Bosma, 1981a, b). NGC 4013 is an example of a strong warp of an external galaxy (Bottema et al., 1987; 1995A&zA...295..605B; Bottema, 1996). Based on various H i observations and parameterization of kinematics of massive spirals, it has been suggested that warps are rarer toward larger masses (Struve et al., 2007), and tend to be more asymmetric and have larger amplitudes in denser environments (García-Ruiz et al., 2002). In addition, Briggs (1990) noted that warps are mainly noticeable at large radii where the optical image starts to diminish.
Stellar warps also exist (van der Kruit, 1979; Sandage & Humphreys, 1980; Sasaki, 1987), although the amplitude of the warp angle seems smaller than that of H i (Ann & Park, 2006). There are some extreme cases of very strong stellar warps (even comparable with the strong radio warps) in interacting systems. One good example of a strong optical warp is in Mkn 305 along with Mkn 306 (Kollatschny & Dietrich, 1990). Sanchez-Saavedra et al. (1990) showed that the warp frequency was higher than 80 of all northern-hemisphere NGC spiral galaxies. Later, the same result was confirmed for the galaxies in the southern hemisphere (Castro-Rodríguez et al., 2002). They also reported that no lenticular warped galaxy had been found. Reshetnikov & Combes (1998) found evidence that more massive galaxies are less likely to warp, and most interacting galaxies show measurable warps, emphasizing the role of gravitational interaction. No correlation, however, has been found between the observed frequency of warped galaxies and spiral galaxy morphology.
To explain the formation and evolution of warped galaxies, several theoretical mechanisms have been proposed, including (1) intergalactic magnetic fields acting directly on the H i gas in disks (Battaner et al., 1990; Battaner & Jimenez-Vicente, 1998), (2) external torques originating from the gravitational forces of sinking satellites (Huang & Carlberg, 1997; Sadoun et al., 2013), (3) discrete bending modes with the disk embedded in an axisymmetric halo (Sparke & Casertano, 1988), (4) torques exerted by a misaligned halo (Debattista & Sellwood, 1999; Ideta et al., 2000), (5) direct accretion of intergalactic medium on disks (Revaz & Pfenniger, 2001), (6) reorientation of the outer parts of halos by cosmic infall (Ostriker & Binney, 1989; Jiang & Binney, 1999; Shen & Sellwood, 2006), and (7) distortions in the dark matter halo by satellite galaxies (Weinberg & Blitz, 2006).
Many warped galaxies have nearby companions. This may support the idea that tidal interactions are involved in the creation of galaxy warps. Toomre & Toomre (1972) demonstrated the effects of close encounters on the galaxy evolution in great detail, although they focused mainly on the formation of galactic bridges and tails with various orbital parameters, not on galactic warps. Vesperini & Weinberg (2000) investigated the effects of distortion produced in dark matter halos during fly-by encounters, and found that such distortion of the halo might account for the formation of lopsided and warped disks. Similar interpretations were drawn from observational investigations (e.g., Swaters et al., 1999).
In a CDM universe, galaxy mergers are considered key to understanding the formation and evolution of halos due to their dramatic influence on galaxy morphology and star formation rate. For this reason, various researchers (e.g., Moore et al., 1998, 1999; Dubinski et al., 1999; Springel & White, 1999; Bekki, 2008; Peirani et al., 2009; Peirani et al., 2010) have investigated mergers. In contrast, yet another class of galaxy interaction, the fly-by encounter with no mergers involved, has been discounted, although it could be as frequent as, or even surpass the frequency of the merger (Gnedin, 2003; Sinha & Holley-Bockelmann, 2012).
Galaxies in cluster environments travel at a relatively high speed (Gnedin, 2003), and experience a number of fly-bys with high probability. Sinha & Holley-Bockelmann (2012) paid attention to close halo fly-bys by analyzing high resolution N-body simulations. They found that halos with masses above in low redshift () experience more than 100 fly-by encounters per Gyr, although the number of fly-bys among massive galaxy pairs is relatively small. They noted that about 70 % of fly-bys are one-time events between halos. S.H. An et al. (2014, in preparation) also performed cosmological simulations to investigate the key characteristics of fly-by interactions as functions of redshift and mass ratios. Their results demonstrate that the number of equal mass fly-bys in clusters is comparable to the number of major mergers.
For the following reasons, we hypothesize that galaxy fly-by interactions are responsible for galaxy warps in certain cases. First, galactic fly-by interactions are frequent (Sinha & Holley-Bockelmann, 2012). Furthermore, a few interesting relations reinforce the idea of a gravitational origin of warped disks: (1) most interacting galaxies are warped and have greater warp amplitudes on average than isolated galaxies (Kollatschny & Dietrich, 1990; Reshetnikov & Combes, 1998; Schwarzkopf & Dettmar, 2001), (2) galaxies that have distinct tidal features show large warp asymmetries (Ann & Park, 2006), and (3) more massive galaxies are somewhat less warped than less massive galaxies (Struve et al., 2007).
The main goal of this paper is to study whether a one-time, fly-by encounter with a perturber can generate a warp, with the structure being maintained for a long period of time. To scrutinize the potential ramifications of galactic fly-by encounters, we utilize N-body simulations. In particular, we use a live set of halo N-body particles to produce a dark matter halo. We prefer live halos to static fixed potential wells so as not to underestimate the influence of interactions among halos when halos overlap during the encounter. We confine our discussion to the warp phenomenon of stellar disks, leaving the discussion on extended H i warps to forthcoming papers in this series.
This paper is organized as follows. In Section 2, we describe model galaxy construction and fly-by simulation set-ups for various parameters. In Section 3, we present the methods we use to analyze simulated warps. Results for galaxies both in isolation and with encounters are shown in Section 4. In Section 5, we summarize our findings and discuss the results. We present conclusions in Section 6.
2. Models
2.1. Construction of Model Galaxies
| DM | ||||
| Disk | ||||
| Gas | ||||
| Bulge |
| Model | |||
|---|---|---|---|
| DM1 | |||
| DM2 | |||
| DM3 | |||
| DM4 | |||
| DM5 | |||
| DM6 |
Note. — A perturber only consists of dark matter particles to avoid model complexity.
Our aim is to investigate gravitational interactions between a disk galaxy (host) and a fly-by galaxy (perturber) using an idealized N-body + SPH simulation. Both objects are created following the prescription of Springel et al. (2005). We use Gadget2 (Springel, 2005) to perform fly-by simulations after construction of both the host and the perturber.
In particular, the host galaxy consists of a spherical dark matter halo with a Hernquist profile (Hernquist, 1990), a disk with an exponential surface density profile containing both stars and gas, and a bulge. The disk and bulge comprise 4.1 % and 1.4 % of the total mass respectively (Tables 1). The baryon fraction used here (5.46 %) is lower than the cosmic baryon fraction (16.7 %) derived by Komatsu et al. (2009), but consistent with that of Springel et al. (2005). Observational analysis suggests that most galaxies are severely baryon-depleted with respect to the cosmological fraction (see for instance Bell et al., 2003; Hoekstra et al., 2005; McGaugh et al., 2010). The gas fraction of the disk is 10 % in the host galaxy, consistent with Liang et al. (2006). In our fiducial model the host has a mass of 9.52, which corresponds to a virial velocity () of 160 km s-1 comparable with the Milky Way. The values of the concentration index of the halo (c) and the spin parameter of the halo () are 9 and 0.033, respectively. The disk scale length (), which is effectively determined by the spin parameter value, is 2.34 kpc for the host galaxy in our case.
For the perturber, we only consider a dark matter halo () with the Hernquist profile because even for the closest passage, only halos are interpenetrated without direct interactions between baryonic components, i.e., bulges and disks. Six model perturbers with different masses, ranging from (DM1) to (DM6), are used. Detailed information about the perturber models (their total masses, the number of particles, and the particle masses of each component) is listed in Table 2. Note that the particle mass of each component must match between the host and the perturber.
2.2. Initial Parameters for Fly-by Encounters
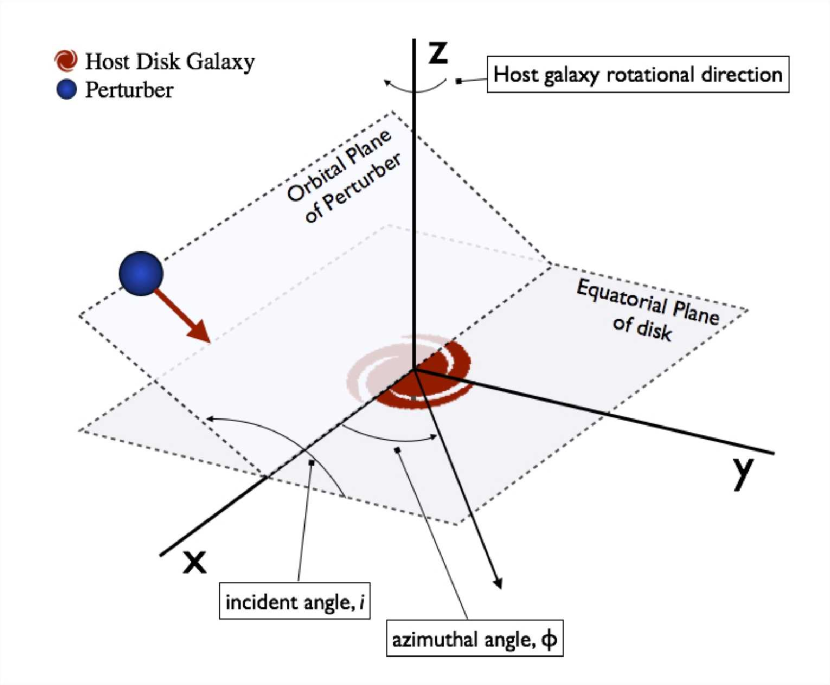
Once we build host and perturbing galaxies, their initial positions, initial velocities, and orientation angles are defined. A schematic view of the fly-by simulations is provided in Figure 1. For the purpose of this study, one disk galaxy is placed at the origin with no initial velocity while one dark halo perturber is located 600 kpc away from the host with a relative velocity of 600 km s-1. The host disk galaxy rotates in the x-y plane. The azimuthal angle is measured from the x-axis to quantify the evolution of tips of warps. Gnedin (2003), based on a Virgo-type cluster simulation, found that the relative velocity of galaxies at encounters peaks at 350 km s-1 and has a mean value of around 800 km s-1 showing a skewed distribution. In addition, Tormen et al. (1998) reported that galaxies have a peak relative velocity of 500 km s-1. Our initial relative velocity of 600 km s-1 lies in the range of the values previously proposed, and is therefore an appropriate representative value. We note that the total tidal strength exerted on the galaxy is proportional to the integration time (i.e., the duration) of the encounter. Accordingly, interactions with smaller relative velocities have a higher chance of triggering warp formation.
Each simulation run has a different impact parameter, mass ratio, or incident angle of the perturber. The impact parameter () is the minimum distance between the host and the perturber at the moment of the minimum distance (). The mass ratio is defined as
| (1) |
such that a higher mass ratio indicates a more massive perturber with respect to the host galaxy. The incident angle () denotes the angle of the perturber’s orbit to the rotational plane of the host. In other words, we set the incident angle to if the perturber moves along the plane in the same direction as disk rotation (prograde passage). By convention, does not exceed . The configurations of all runs are listed in Table 3.
| Runa | Perturber | ||||
|---|---|---|---|---|---|
| (kpc) | (∘) | (Gyr) | |||
| IP1 | DM4 | ||||
| IP2 | DM4 | ||||
| IP3 | DM4 | ||||
| IP4 | DM4 | ||||
| IP5 | DM4 | ||||
| IP6 | DM4 | ||||
| IP7 | DM4 | ||||
| IP8 | DM4 | ||||
| IP9 | DM4 | ||||
| IP10 | DM4 | ||||
| M1 | DM1 | ||||
| M2 | DM2 | ||||
| M3 | DM3 | ||||
| M4 | DM4 | ||||
| M5 | DM5 | ||||
| M6 | DM6 | ||||
| A1 | DM4 | ||||
| A2 | DM4 | ||||
| A3 | DM4 | ||||
| A4 | DM4 | ||||
| A5 | DM4 | ||||
| A6 | DM4 | ||||
| A7 | DM4 | ||||
| A8 | DM4 | ||||
| A9 | DM4 |
3. Analysis
3.1. Angle Measurements
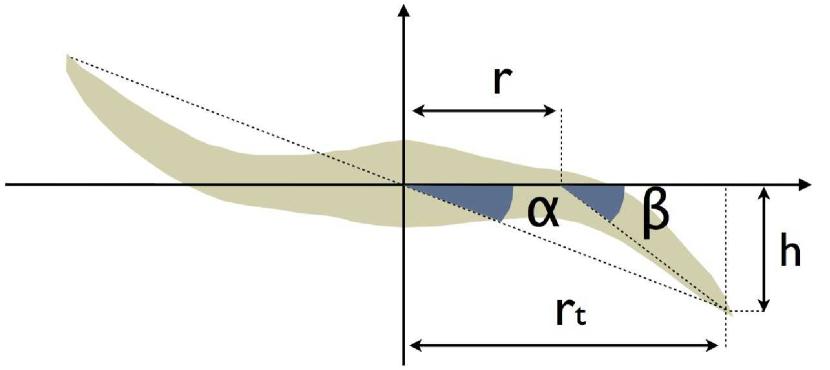
Figure 2 shows the definitions of the warp angles, and . The angle is the angle between the major axis of a galaxy and the outermost point of the disk, and is given by
| (2) |
where h is the distance of the tip of the outermost point from the disk major axis and is the distance of the tip of the outermost point from the galaxy center along the x-axis (i.e., disks major axis). The angle is the angle between the galaxy’s major axis and the line drawn from the point where the warp becomes evident to the outermost point of the disk, and is given by
| (3) |
where r is the warp starting radius. In this scheme, the warp angle is smaller than the angle .
As shown in Figure 2, evaluating accurately is closely related to measuring . It is clear that errors associated with the measurement of are larger than those of because of ambiguity in defining the warp starting point r of the disks. For this reason, we use the warp angle rather than in the analysis of our simulated galaxies throughout this study.
3.2. Ring Model
To quantify the warp structure we use the tilted-ring model, which was first introduced by Rogstad et al. (1974) to explain M83’s warp. Bosma (1981a) and Schoenmakers et al. (1997) have shown that the orbits of material within spiral galaxies have low ellipticity. Thus, treating disk material as being circular has validity. To measure warp angles, each simulated galaxy is divided into 10 successive rings, or annuli, of equal width from the center of galaxy out to 20 kpc in radius. For example, the first ring represents the inner region of the disk from its center to 2 kpc in radius while the final tenth annuli is for the outermost parts of the disk between 18 and 20 kpc in radius. By dividing a disk into equal width, we can calculate the warp angle for each annuli, the warp starting points, and their sensitivity to fly-by encounters.
Warp is in general stronger at the outer part of disks and thus the outer rings in the simulation better represent the structure. However, the outermost region contains only a small fraction of the mass of a disk or the total number of particles. Hence, we only consider regions up to 20 kpc in radius to avoid the statistical uncertainty caused by an insufficient number of particles.
3.3. Definition of Warp Lifetime,
Estimating the lifetime of a warp is crucial because lifetime is directly correlated with the probability of a warp being observed. To estimate the lifetime of warps from simulations, we adopt the following simple approach. Warp angles are recorded for the isolated system, i.e., an unperturbed galaxy acting as a control sample. Throughout the paper, we postulate that a galaxy is warped only if the warp angle exceeds two times the standard deviation (2) of the averaged warp angle of the isolated, unperturbed galaxy disk. To model the pattern of change in the warp angle with time elapsed after an encounter, we apply polynomial fitting to our resultant data. A fifth order polynomial fit provides the best model for the warp evolution pattern. As our simulations are only performed for 5 Gyr, we use additional linear fits to the data for warps that last longer than 5 Gyr to obtain the extrapolated lifetime.
4. Results
4.1. Isolated Disk Galaxy as a Control Sample
Simulation of an isolated, unperturbed system shows no or little warp at the inner rings (R 10 kpc), but a very weak warp () at the outer rings (R 10 kpc). For example, the outer regions of the disk, represented by Rings 810, have noticeable variations in inclination angle compared to the stable inner regions represented by Ring 57. In our working hypothesis, warps are not expected for isolated galaxies and we thus attribute the weak warps to random fluctuation of modeled rings mainly due to the lack of particles residing in each annulus. Ring 10, for instance, only contains 0.2 of the total mass of the galaxy disk.
Hereafter, the change in the inclination angle of an isolated galaxy will be used as the background level of the real warp angle for all simulations performed. We identify a disk as being warped only if the warp angle exceeds two times the standard deviation (2) of average inclination angles of the isolated system in each bin.
4.2. Disk Galaxies after Fly-by Encounters
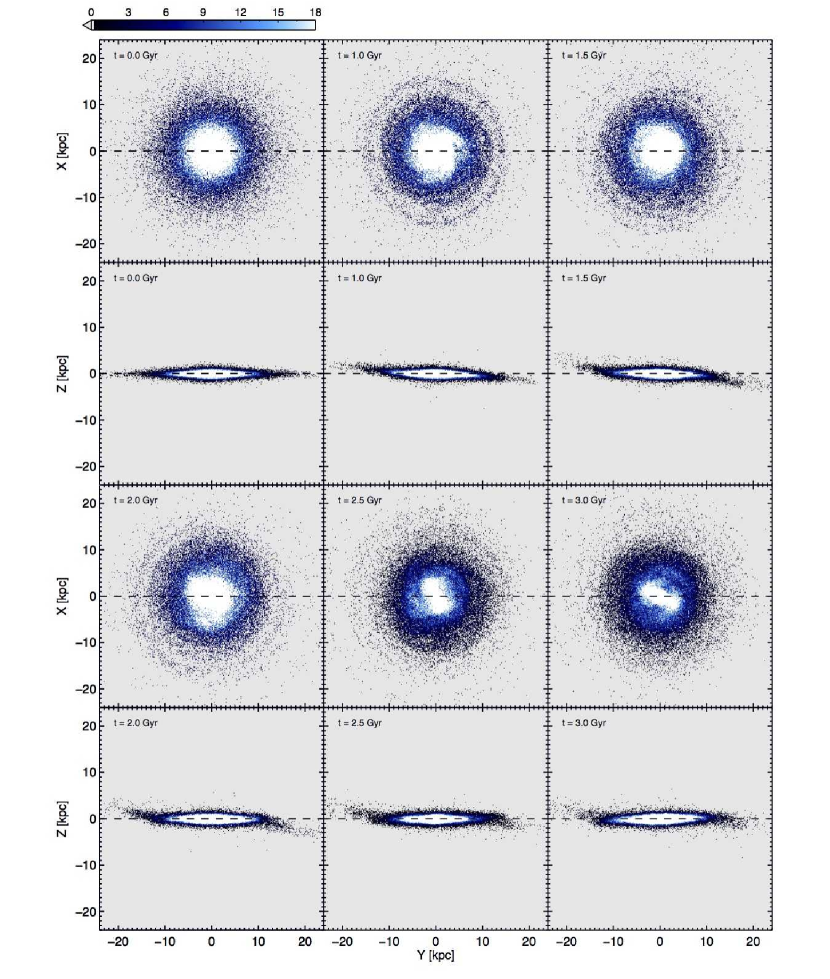
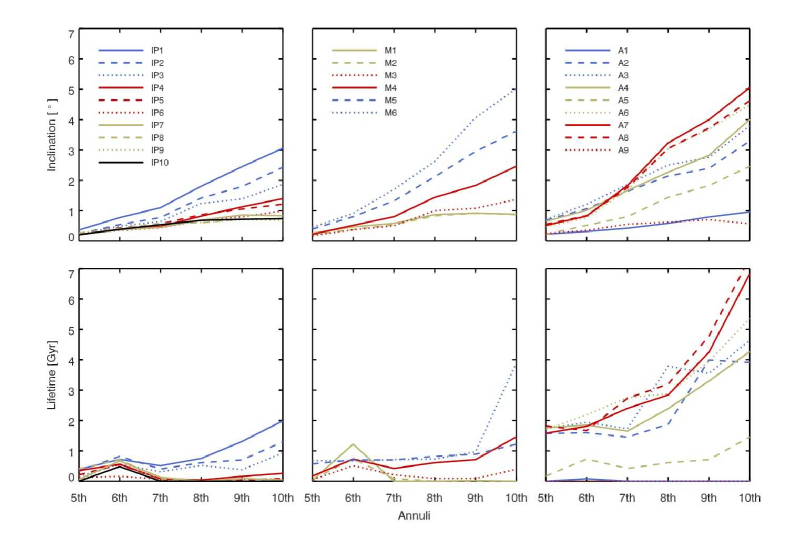
An example of a warped galaxy after a fly-by interaction with a dark halo is illustrated in Figure 3. As the perturber gets closer to the host, the near side of the galaxy starts to bend (), and after the perturber passes by (), a warp develops on the further side, resulting in an integral-shaped warp. The outermost regions maintain the warp for a few billion years (depending on models), but warps in the inner regions disappear quickly. The size of the warp angles of our model galaxies ranges from = 2∘ 5∘, consistent with observations (Reshetnikov, 1995; Reshetnikov & Combes, 1998; Ann & Park, 2006). The present study considers three parameters—the impact parameter , mass ratio , and incident angle (Table 3). Figures 4 and 5 demonstrate the effects of these parameters. We show the evolution of the warp amplitude for an isolated, unperturbed disk in Figure 4 (red region) to compare with the evolution of a disk galaxy with and without a fly-by encounter with a dark matter perturber.
4.2.1 The Effect of the Impact Parameter
We perform a total of 10 simulation runs (Table 3, ‘IP’ runs) to explore the effect of the impact parameter, , on the creation of galaxy warp. The values range from 30 kpc (IP1) to 190 kpc (IP10). We do not perform simulations with 30 kpc to avoid destruction of the internal structures of disks.
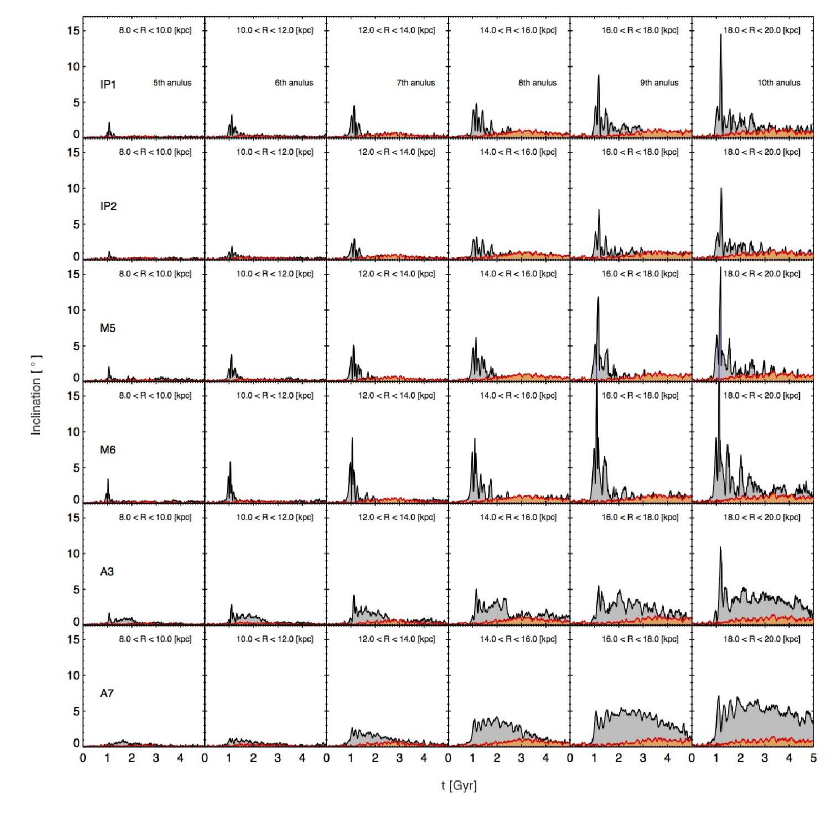
The top row of Figure 4 shows the result of the IP1 run, for which two galaxies have the minimum distance at and thus the host experiences the strongest tidal force among all IP runs. The perturber passes by the disk galaxy at Gyr and the magnitude of the warp reaches its peak about 0.2 Gyr after the encounter. The minimum distance between the disk galaxy and the perturber is approximately 33 kpc at Gyr. The system has a mass ratio () of 1 with an incident angle () of . The IP1 run has the largest inclination angle and the longest warp lifetime among all IP runs. Warping of the outer parts is more pronounced than that of the inner region. For instance, the inner Ring 5 has a maximum warp angle of about . The amplitudes of Rings 6, 7, 8, and 9 have maximum angles of approximately , , , and , respectively. The outermost region of the disk, represented by Ring 10, has the largest warp amplitude ( ).
The IP2 run shown in the second row of Figure 4 has an value of 42 kpc. Compared to the previous run (IP1), the amplitudes are lower, as expected. The inner region, Ring 5, has a small warp, while the outermost region, Ring 10, has a warp angle slightly above . The warp lifetime in this case is shorter than that of the IP1 run.
The leftmost column of Figure 5 shows the averaged inclination over 1 Gyr and the lifetime of each IP run as functions of galactocentric distance (i.e., annulus number). Runs IP3 to IP10 correspond to 51, 60, 69, 79, 88, 109, 138, and 187 kpc, respectively. As increases, the warp amplitude and the estimated lifetime decreases. These results suggest that a one-time, fly-by encounter with 1 can generate warp and that this structure can be sustained for a few billion years if is close enough.
4.2.2 The Effect of the Mass Ratio
We perform a total of six simulations (Table 3, ‘M’ runs) to examine the effect of the mass ratio between the disk galaxy and the perturber. The values range from 1/6 (M1) to 4 (M6).
The third and fourth rows of Figure 4 show the results of the M5 and M6 runs, for which the two galaxies have the largest ratios of 2 and 4, respectively, and thus the hosts experience the strongest tidal force among all M runs. The systems have kpc. For both runs, Rings 9 and 10 become highly warped, reaching a maximum angle of with warp lifetimes of Gyr.
The middle column of Figure 5 shows the averaged inclination and lifetime of each M run in terms of the annulus. When the mass of the perturber is one-sixth that of the disk galaxy (M1 run), no significant result is found, implying that it is unlikely to generate warps. Similarly, the interaction in run M2 with 0.25 and 45 kpc simply cannot generate a tidal force strong enough to excite warps. Therefore, a one-time fly-by encounter with 0.25 and 45 kpc cannot cause warps unless the galaxy pair has a very small relative velocity and thus a sufficient interaction duration.
When reaches 0.5 (the M3 run), however, the warps become apparent. In this case, the outer regions of galaxies are clearly warped ( and ). Interactions with more massive perturbers ( 1) generate highly warped galaxies. In these simulations, the maximum warp angle reaches about at around Gyr and decreases quickly. For every case, the warp cannot be retained for longer than 4 Gyr.
4.2.3 The Effect of the Incident Angle
We define the incident angle as the angle between the orbital plane of the perturber and the equatorial plane of the disk galaxy. In previous sections, the incident angle was set to for all simulation runs. In reality, however, galaxies interact with no preference in angle, and even for the same and , the strength and the lifetime of warps will vary according to different values. We examine the effect of perturbers with various incident angles ranging from (A1) to (A9) on the disk galaxy during fly-by encounters (Table 3, the ‘A’ runs).
Early work by Toomre & Toomre (1972) showed that prograde fly-by encounters induce a stronger host galaxy response than retrograde fly-by encounters. This phenomena is also well exhibited in our simulation results, showing well-developed spiral arms in one of the prograde models, A1 (bottom panels in Figure 6). We refer to Oh et al. (2008) for detailed physical properties of spiral arms in interacting systems.
The fifth and bottom rows of Figure 4 show the results of the A3 and A7 runs, for which and are used, respectively. At Gyr, warps reach their maximum and the overall pattern of evolution up to this point is almost identical to that of the simulation with (run A5 and IP2). A difference is found after reaching maximum warp. A warp angle with drops quickly in a few billion years and no sign of a warp remains after 4 Gyr. However, when or , warps do not disappear until the end of our simulation.
The rightmost column of Figure 5 shows the averaged inclination and lifetime of each ‘A’ run in terms of the annulus. The main lesson to be drawn from this result is that the incident angle plays a critical role in determining the angle and lifetime of warps, with the latter more closely related to the integration time of the encounter. Fly-bys with more inclined incident angles have a longer integration time, but their tidal forces are imposed mainly in the horizontal direction, not the vertical direction. As a result, little or no disk warp is found for (A1) and (A9), i.e., with a perturber moving on the same plane as the host galaxy’s disk. In contrast, fly-bys with (run A5) exert the largest vertical tidal force, but have the shortest integration time. For this reason, the angle and lifetime reach their peaks at the midpoint between and (i.e., ) and between and (i.e., ), respectively.
It is important to note that there is a sizable disparity in warp angle and lifetime between the and cases, in the sense that the case (A3) has a steeper slope of change in inclination than the case (A7). Incident angles could be treated the same way as when the angle between the incoming path of the perturber and the equatorial plane is measured. However, the perturber follows the direction of the disk galaxy’s rotation (prograde), while the perturber moves in the opposite direction (retrograde). For the prograde encounter, stellar particles of the host galaxy on the side closest to the perturber move in the same direction as the perturber, exerting tidal perturbations for a longer time. We note that the lifetime of the A3 run is estimated to be shorter than that of the A7 run. The outermost regions are disrupted severely, but not in the form of galaxy warps, due to the strong tidal force exerted on the prograde models.
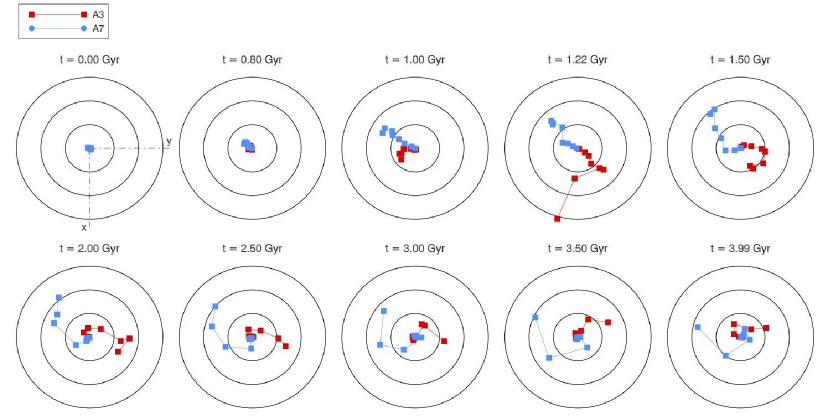
We also find that the incident angle is closely related to the evolution of the line of node (LON). Figure 7 is the Briggs diagrams (Briggs, 1990), showing the evolution of warps in terms of their amplitude and LON. In the diagrams, radial bins are spaced equally between 0 and 20 kpc (blue and red points, respectively) and the polar coordinate shows the warp angles (, , and ) of the LONs (concentric circles). Simulations show that the tip of a warp of first develops with respect to the direction of the perturber’s incoming path. As for the case of the A3 model run, the LON evolves in the direction of the disk’s rotation for 0.5 Gyr and turns its direction afterward, whereas the LON of the A7 model evolves in the direction opposite to the disk rotation from the beginning. The LON of the inner region advances faster than that of the outer regions. As a result, the diagrams gradually turn into leading spirals for both models.
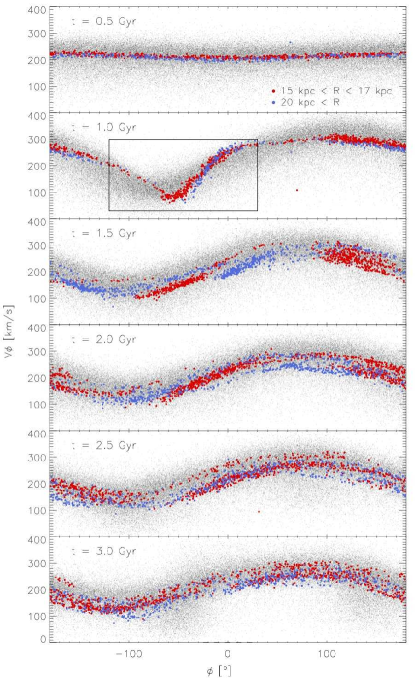
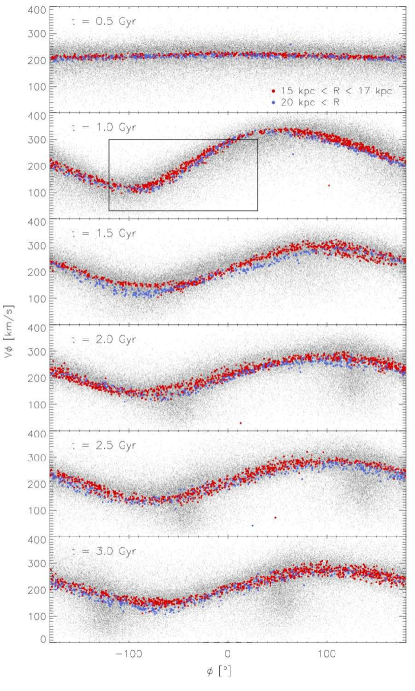
Figure 8 depicts the variations of the azimuthal velocities of the A3 and A7 models as a function of . Before an encounter, the azimuthal variation remains at 220 km s-1. The orbits of particles are arranged in such a manner that the azimuthal velocities are symmetric with respect to the x-axis ( = 0∘), the point where the perturber passes by most closely. The signature of the azimuthal velocity variation is apparent while the perturber approaches the host, reaching its maximum at t 1.0 Gyr. The azimuthal velocities of the particles for the A3 and A7 models reach minimum values at and , respectively. (See the inside of small boxes in each panel of Figure 8 at t 1 Gyr). These values of agree with the position angles of the warps we found in Figure 7, implying that warps develop where the azimuthal velocity of galaxy is at a the minimum. The difference between prograde and retrograde models is that the overall distributions are slightly shifted, which basically depends on the perturbers’ path. At t 1 Gyr, the velocity distribution in the outermost regions (red and blue dots) of the A3 models does not seem to follow the that of inner regions (gray), showing a more shifted distribution due to the formation of strong spiral arms.
4.2.4 Summary on the Effects of the Three Parameters
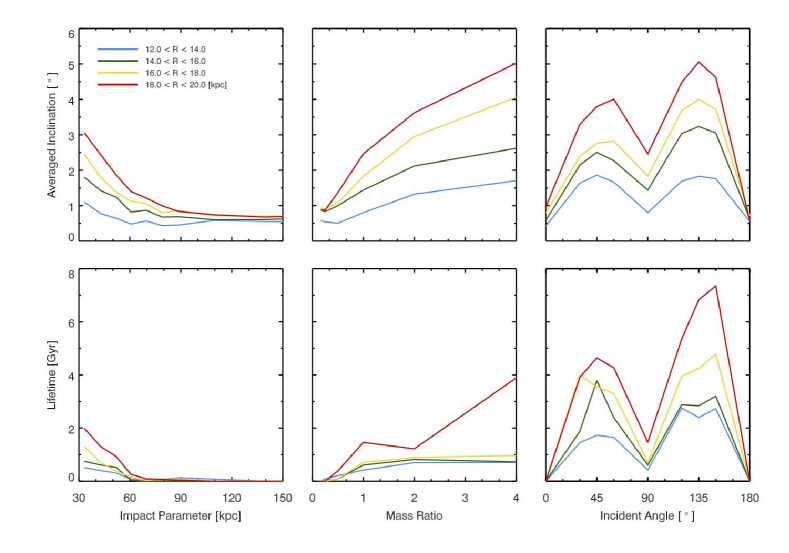
A summary of all simulation runs in terms of the warp amplitude (upper row) and lifetime (lower row) as functions of three parameters—impact parameter (left panels), mass ratio (middle), and incident angle (right) is provided in Figure 9. The tendency of the warp’s evolution can be summarized as follows: (1) the outer part of the disk is more affected by fly-by encounters, (2) more massive perturbers and/or closer interactions trigger the formation of stronger, longer-lasting warps, and (3) the perturber’s incoming path matters, in that it determines how long the bending structure persists. For instance, in the case where exceeds 100 kpc, a galactic interaction even with is unlikely to excite a warp. In the case of interactions with similar or more massive perturbers, relatively large warps are created, but is not able to excite warps. In the case of perturbers with and , no visible warp is generated. Perturbers with and excite the largest warps that persist for the longest time. Inclination angles and estimated lifetime decrease as approaches , resulting in an ‘M’-shaped curve for the warp angle and a lifetime that is a function of the incident angle.
5. Discussion
5.1. The Effect of the Mass Resolution
Using 100,000 particles in the disks might be inadequate to treat the subtleties of the disk edge phenomenon. Disks at this resolution are subject to internal heating that increases the disk scaleheight and possibly induces artificial bending instabilities. Therefore, it is important to test for the numerical convergence of our results with higher resolution simulations.
In this section, we discuss the effect of particle resolution on the formation and evolution of galaxy warps induced by fly-by encounters, especially on the amplitude, position angle and its persistence. In previous runs, we used 100,000 particles for disks, ending up with a total number of around 1.4 million particles for the whole galaxy model.
To test the sensitivity of galaxy warp evolution to numerical resolution, we conduct two additional experiments which are upgraded from the previous model simulation. Two models are exactly identical to the A3 and A7 runs aside from the fact that new higher-resolution sets now have one million particles for disks. Note that the number of other components of the model galaxy are also increased (6.4 million, 55,000 and 185,000 particles for dark halo and the gas in the disks and the bulge, respectively). The number of particles used for the perturber in these new sets are 6.8 million.
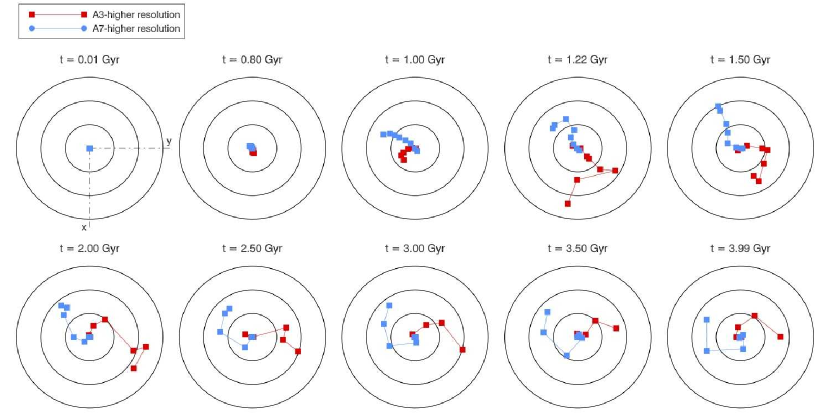
Figure 10 shows Briggs diagrams for the higher resolution model A3 and A7 runs. A Briggs diagram is useful when comparing our intermediate and higher resolution models because we can easily visualize two major features,warp amplitude and position angle, simultaneously. Although there was a small deviation in the amplitude and position angle due to the random fluctuation, still we observe almost identical patterns in warp evolution between the intermediate (Figure 7) and higher resolution simulation (Figure 10). Thus, this suggests that particle resolution does not affect much the evolution trend of warps induced via fly-by encounters.
5.2. Warps of Galaxies in the Field Environment
We do not have a clear explanation for the origin of warps in field environments. Both the Milky Way galaxy and M31, for example, are significantly warped, yet they show no sign of recent interaction with a large galaxy in the past few billion years. Moreover, M33, the largest satellite of M31, is only 10 % of the host, which may not be massive enough to create warps even during the interaction. Interestingly, Weinberg & Blitz (2006) showed that Magellanic Clouds can produce distortions in the dark matter halo of the Milky Way. They stated that the combined effect of these distortions and the tidal force exerted by Magellanic Clouds account for the creation of Galactic warp.
An interesting population of galaxies, the so-called backsplash galaxies, may provide a hint for warps in field galaxies. Backsplash galaxies are individual galaxies that once visited the core regions of a galaxy cluster, deep within the cluster potential 0.5 and rebounded up to 2.5 so that they are now located in the outskirts of the cluster, obscuring the definition of cluster and field environments (Mamon et al., 2004; Gill et al., 2005). Several observational studies have confirmed the existence of this new population in galaxy clusters (Sanchis et al., 2004; Pimbblet et al., 2006), and backsplash galaxies even in isolated galaxy clusters that are free from recent clustercluster merger activity (Pimbblet, 2011). The backsplash galaxies in the outskirt of clusters should have high chance of fly-by interactions and thus of exhibiting warp phenomena.
5.3. The Effect of Triaxial Halos
It has been suggested that warps in disks might survive for a long time if halos are at least three times more massive than the disk and nearly spherical (axial ratio 1.2), obviously triggering no precession of disks (Tubbs & Sanders, 1979; Toomre, 1983). Thus, this basic idea is consistent with our results.
We prefer spherical live halos to a static fixed potential so as not to underestimate the effect of dynamical friction on disks residing on halos when halos overlap during the encounter. However, as many numerical studies demonstrate, the shape of the dark matter halos are, in fact, triaxial (Dubinski & Carlberg, 1991; Jing & Suto, 2002; Bailin & Steinmetz, 2005; Allgood et al., 2006; Zemp et al., 2012), favoring flattened dark halos.
The effect of a triaxial halo on the evolution of warps in galaxies with disk particles in a fixed halo potential has been examined. One of the key results is that warps in triaxial halos show oscillatory behavior. The triaxiality of halos also cause the differential precession and nutation between the inner and outer regions of the disks, attenuating or fluctuating the magnitude of the warps (Ideta et al., 2000; Jeon et al., 2009). It is a well-known fact that the main difficulty in maintaining coherent warps of galaxies is the problem of differential precession of inclined orbits in the combined flattened potential of the disk and asymmetric dark halo.
Unfortunately, our scheme is currently incapable of generating a stable triaxial halo and galaxy with live particles. It is beyond the scope of this paper to run fly-by simulations in order to demonstrate the effect of the flattened halo on the evolution of warps. Given these limitations, our aim in the present study is to understand the fundamental effects of galactic fly-by encounters on the formation and evolution of disk warps.
5.4. Stellar Disk versus Extended Gas Disk
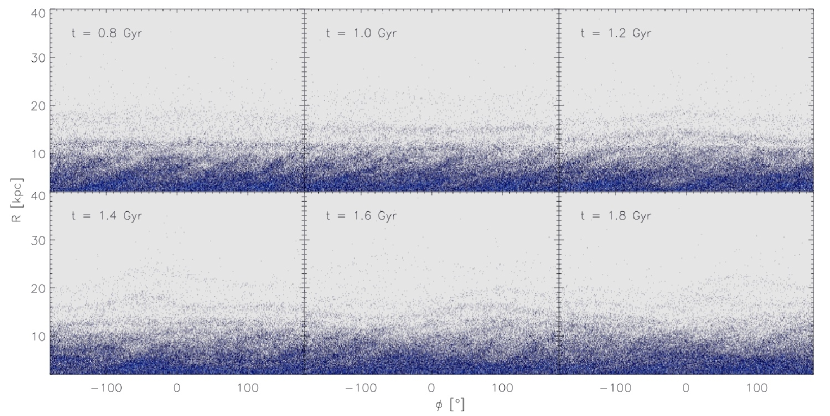
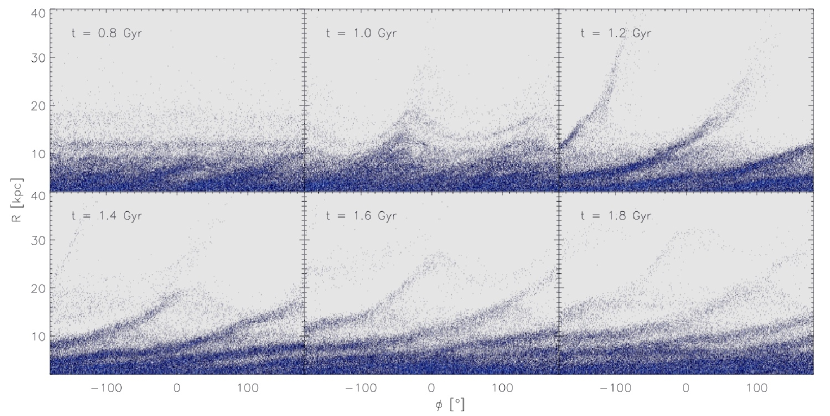
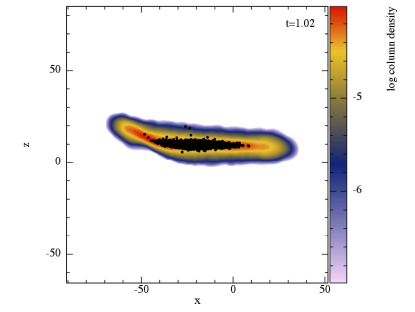
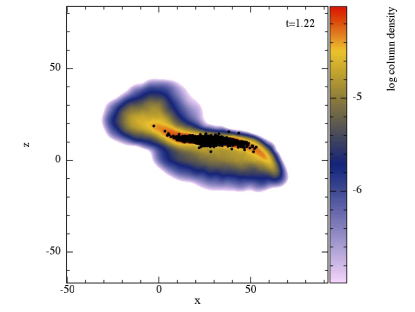
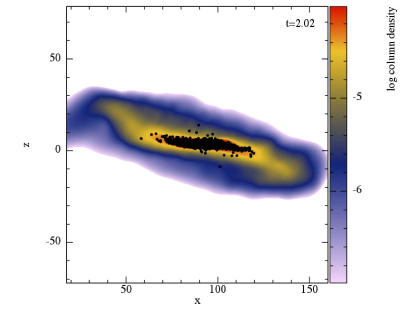
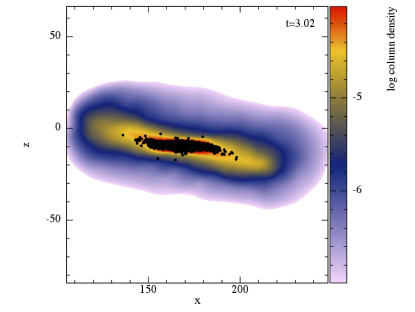
The galaxy models in this study do not contain particles that describe extended H i gas disks. However, extended H i warps are universal, and their amplitudes are usually greater than those of stellar warps (e.g., Reshetnikov & Combes, 1998). Cox et al. (1996) showed that warps in both optical and neutral hydrogen gas share similar characteristics, supporting the idea that gravitational force plays a crucial role in the formation of warped galaxies (Binney, 1992). To ensure that the fly-by mechanism also works for the formation of gaseous warps, we perform a single run that includes the extended H i gas containing 10 % of the total gas mass.
Four snapshots of the projected particle number density ( 1.0, 1.2, 2.0 and 3.0 Gyr) of the simulated gas distribution along with the stellar distributions are demonstrated in Figure 11. The simulation parameters are chosen to be identical to the A2 model. In line with observations, the gas distribution of our model follows that of stellar disks and an extended H i warp develops with a higher amplitude than that of stellar warp. Details of gas behavior will be presented in a separate paper in this series.
5.5. Asymmetric Warps and the Possible Origin of U- and L-shaped Warps
A considerable number of warped galaxies show noticeable asymmetries (Richter & Sancisi, 1994; Reshetnikov & Combes, 1998; Castro-Rodríguez et al., 2002; Ann & Park, 2006). The degree of asymmetry can be quantified by the difference in warp magnitude at each side, using
| (4) |
where and are the warp angles of one side and the opposite side, respectively (Ann & Park, 2006). Most models show an asymmetry of for the majority of the time and for a short period of time right after the interaction. Among our galaxy models, the A2, A3 and A4 runs show the most prominent asymmetric warps ( at Gyr).
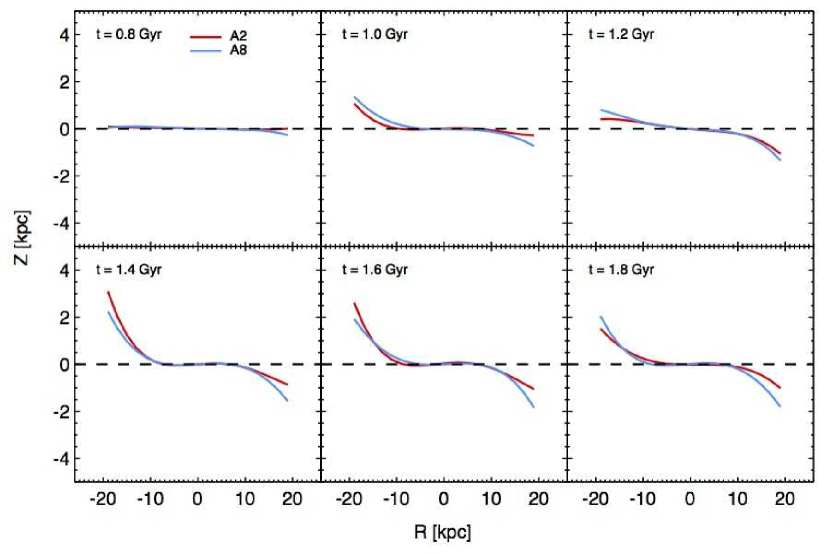
An example of a non-symmetric warp in our runs (A2 in red) along with a relatively symmetric warp (A8 in blue) for comparison is shown in Figure 12. As a perturber is still approaching ( Gyr), one side of the disk (the side nearest the perturber) bends first. After the perturber passes by ( Gyr), the other side of the disk starts to bend, resulting in an S-shaped warp. For a few billion years, some warps in our models develop strong asymmetry. Later on, the stronger side of the warp descends to the same level as the other side of the warp, resulting in a normal symmetric warp. We note that once a non-symmetric stellar warp is present, the extended gas disk has a larger and the asymmetry lasts longer than the stellar counterpart.
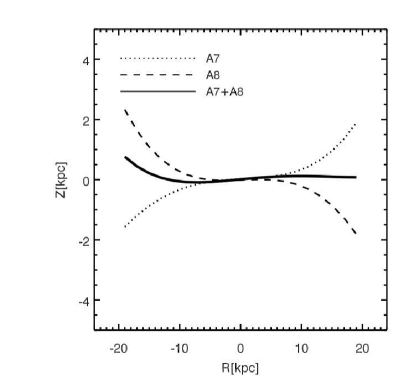
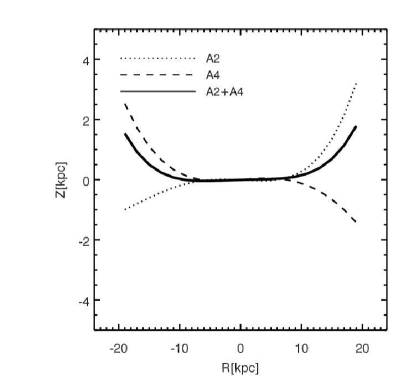
In Figure 13, we speculate that the observed U- and L-shaped warps are geometric superpositions of two (or more) non-symmetric S-type warps. More than one successive fly-by, each with a different incident angle, can cause two S-types to be superimposed. Multiple fly-bys may include interactions with a satellite on a highly elongated orbit Suppose that an intruder galaxy perturbs a disk, producing a symmetric warp, and that the warped galaxy experiences another fly-by encounter generating an asymmetric warp. In this case, the initial S-type can be modified by the latter incident, leading to an L-shaped (left panel) or U-shaped warp (right panel). Observations show that the minority ( 30 %) of stellar warps are U- and L-types while the S-type accounts for 70 % of stellar warps (Ann & Park, 2006). Because multiple interactions with proper incident angles are required to form U- and L-shaped warps under the superposition scheme, the fraction of these types should naturally be less than that of the dominant S-types.
6. Conclusions
We performed a set of N-body simulations with live halos to investigate the morphological and kinematical evolution of disk galaxies that experience fly-by encounters. We found that warps can be excited by impulsive encounters and can be sustained for a few billion years. The magnitudes of the warps reach maximum values from a few degrees up to , and warps survive for a few billion years depending on three major parameters: (1) minimum distance, (2) mass ratio, and (3) incident angle. Our results coincide with the fact that most optical warps are weak, and confined to the outer parts of the galaxy. While the maximum amplitude is tied up with all parameters listed above, the warp lifetime is determined mainly by the incident angle of the perturber because it affects the integration time and the direction of the force exerted. In addition, the tip angle of a warp first develops with respect to the direction of the incident angle where the azimuthal velocity of the galaxy is at a minimum, and then evolves in the direction opposite to the disk rotation after all.
Some models show strong non-symmetric warps () at a certain period of time. This suggests that the superposition of asymmetric warps, created by two successive fly-by encounters or even multiple interactions with a satellite on a highly elongated orbit, generates U- and L-shaped warps. If this is the case, the amplitudes of most U- and L-shaped warps should be smaller than that of S-shaped warps, which is consistent with observations.
We also briefly described how H i disks forms a bending structure similar to that of stellar disks in response to fly-by encounters, except that the magnitude of the H i warps is greater than that of stellar warps. How the gas components react to fly-bys is also an important issue to consider. Details of gas behavior will be presented in a subsequent paper in this series.
References
- Allgood et al. (2006) Allgood, B., Flores, R. A., Primack, J. R., et al. 2006, MNRAS, 367, 1781
- Ann & Park (2006) Ann, H. B., & Park, J.-C. 2006, NewA, 11, 293
- Bailin & Steinmetz (2005) Bailin, J., & Steinmetz, M. 2005, ApJ, 627, 647
- Battaner et al. (1990) Battaner, E., Florido, E., & Sanchez-Saavedra, M. L. 1990, A&A, 236, 1
- Battaner & Jimenez-Vicente (1998) Battaner, E., & Jimenez-Vicente, J. 1998, A&A, 332, 809
- Bekki (2008) Bekki, K. 2008, MNRAS, 388, L10
- Bell et al. (2003) Bell, E. F., McIntosh, D. H., Katz, N., & Weinberg, M. D. 2003, ApJS, 149, 289
- Binney (1992) Binney, J. 1992, ARA&A, 30, 51
- Bosma (1981a) Bosma, A. 1981a, AJ, 86, 1791
- Bosma (1981b) Bosma, A. 1981b, AJ, 86, 1825
- Bottema et al. (1987) Bottema, R., Shostak, G. S., & van der Kruit, P. C. 1987, Nature, 328, 401
- Bottema (1995) Bottema, R. 1995, A&A, 295, 605
- Bottema (1996) Bottema, R. 1996, A&A, 306, 345
- Briggs (1990) Briggs, F. H. 1990, ApJ, 352, 15
- Burke (1957) Burke, B. F. 1957, AJ, 62, 90
- Castro-Rodríguez et al. (2002) Castro-Rodríguez, N., López-Corredoira, M., Sánchez-Saavedra, M. L., & Battaner, E. 2002, A&A, 391, 519
- Cox et al. (1996) Cox, A. L., Sparke, L. S., van Moorsel, G., & Shaw, M. 1996, AJ, 111, 1505
- Debattista & Sellwood (1999) Debattista, V. P., & Sellwood, J. A. 1999, ApJ, 513, L107
- Dubinski & Carlberg (1991) Dubinski, J., & Carlberg, R. G. 1991, ApJ, 378, 496
- Dubinski et al. (1999) Dubinski, J., Mihos, J. C., & Hernquist, L. 1999, ApJ, 526, 607
- García-Ruiz et al. (2002) García-Ruiz, I., Kuijken, K., & Dubinski, J. 2002, MNRAS, 337, 459
- Gill et al. (2005) Gill, S. P. D., Knebe, A., & Gibson, B. K. 2005, MNRAS, 356, 1327
- Gnedin (2003) Gnedin, O. Y. 2003, ApJ, 582, 141
- Hernquist (1990) Hernquist, L. 1990, ApJ, 356, 359
- Hoekstra et al. (2005) Hoekstra, H., Hsieh, B. C., Yee, H. K. C., Lin, H., & Gladders, M. D. 2005, ApJ, 635, 73
- Huang & Carlberg (1997) Huang, S., & Carlberg, R. G. 1997, ApJ, 480, 503
- Ideta et al. (2000) Ideta, M., Hozumi, S., Tsuchiya, T., & Takizawa, M. 2000, MNRAS, 311, 733
- Jeon et al. (2009) Jeon, M., Kim, S. S., & Ann, H. B. 2009, ApJ, 696, 1899
- Jiang & Binney (1999) Jiang, I.-G., & Binney, J. 1999, MNRAS, 303, L7
- Jing & Suto (2002) Jing, Y. P., & Suto, Y. 2002, ApJ, 574, 538
- Kerr (1957) Kerr, F. J. 1957, AJ, 62, 93
- Kim et al. (2012) Kim, J., Peirani, S., Kim, S., & Yoon, S. 2012, American Astronomical Society Meeting Abstracts, 219, 346.15
- Kollatschny & Dietrich (1990) Kollatschny, W., & Dietrich, M. 1990, A&A, 233, 333
- Komatsu et al. (2009) Komatsu, E., Dunkley, J., Nolta, M. R., et al. 2009, ApJS, 180, 330
- Liang et al. (2006) Liang, Y. C., Hammer, F., & Flores, H. 2006, A&A, 447, 113
- Mamon et al. (2004) Mamon, G. A., Sanchis, T., Salvador-Solé, E., & Solanes, J. M. 2004, A&A, 414, 445
- McGaugh et al. (2010) McGaugh, S. S., Schombert, J. M., de Blok, W. J. G., & Zagursky, M. J. 2010, ApJ, 708, L14
- Moore et al. (1998) Moore, B., Lake, G., & Katz, N. 1998, ApJ, 495, 139
- Moore et al. (1999) Moore, B., Lake, G., Quinn, T., & Stadel, J. 1999, MNRAS, 304, 465
- Oh et al. (2008) Oh, S. H., Kim, W.-T., Lee, H. M., & Kim, J. 2008, ApJ, 683, 94
- Ostriker & Binney (1989) Ostriker, E. C., & Binney, J. J. 1989, MNRAS, 237, 785
- Peirani et al. (2009) Peirani, S., Hammer, F., Flores, H., Yang, Y., & Athanassoula, E. 2009, A&A, 496, 51
- Peirani et al. (2010) Peirani, S., Crockett, R. M., Geen, S., et al. 2010, MNRAS, 405, 2327
- Pimbblet et al. (2006) Pimbblet, K. A., Smail, I., Edge, A. C., et al. 2006, MNRAS, 366, 645
- Pimbblet (2011) Pimbblet, K. A. 2011, MNRAS, 411, 2637
- Price (2007) Price, D. J. 2007, PASA, 24, 159
- Reshetnikov (1995) Reshetnikov, V. P. 1995, Astronomical and Astrophysical Transactions, 8, 31
- Reshetnikov & Combes (1998) Reshetnikov, V., & Combes, F. 1998, A&A, 337, 9
- Revaz & Pfenniger (2001) Revaz, Y., & Pfenniger, D. 2001, Gas and Galaxy Evolution, 240, 278
- Richter & Sancisi (1994) Richter, O.-G., & Sancisi, R. 1994, A&A, 290, L9
- Rogstad et al. (1974) Rogstad, D. H., Lockhart, I. A., & Wright, M. C. H. 1974, ApJ, 193, 309
- Sadoun et al. (2013) Sadoun, R., Mohayaee, R., & Colin, J. 2013, arXiv:1307.5044
- Sanchez-Saavedra et al. (1990) Sanchez-Saavedra, M. L., Battaner, E., & Florido, E. 1990, MNRAS, 246, 458
- Sánchez-Saavedra et al. (2003) Sánchez-Saavedra, M. L., Battaner, E., Guijarro, A., López-Corredoira, M., & Castro-Rodríguez, N. 2003, A&A, 399, 457
- Sancisi (1976) Sancisi, R. 1976, A&A, 53, 159
- Sanchis et al. (2004) Sanchis, T., Mamon, G. A., Salvador-Solé, E., & Solanes, J. M. 2004, A&A, 418, 393
- Sandage & Humphreys (1980) Sandage, A., & Humphreys, R. M. 1980, ApJ, 236, L1
- Sasaki (1987) Sasaki, T. 1987, PASJ, 39, 849
- Schoenmakers et al. (1997) Schoenmakers, R. H. M., Franx, M., & de Zeeuw, P. T. 1997, MNRAS, 292, 349
- Schwarzkopf & Dettmar (2001) Schwarzkopf, U., & Dettmar, R.-J. 2001, A&A, 373, 402
- Shen & Sellwood (2006) Shen, J., & Sellwood, J. A. 2006, MNRAS, 370, 2
- Sinha & Holley-Bockelmann (2012) Sinha, M., & Holley-Bockelmann, K. 2012, ApJ, 751, 17
- Sparke & Casertano (1988) Sparke, L. S., & Casertano, S. 1988, MNRAS, 234, 873
- Springel & White (1999) Springel, V., & White, S. D. M. 1999, MNRAS, 307, 162
- Springel (2000) Springel, V. 2000, MNRAS, 312, 859
- Springel et al. (2001) Springel, V., Yoshida, N., & White, S. D. M. 2001, New Astronomy, 6, 79
- Springel (2005) Springel, V. 2005, MNRAS, 364, 1105
- Springel et al. (2005) Springel, V., Di Matteo, T., & Hernquist, L. 2005, MNRAS, 361, 776
- Struve et al. (2007) Struve, C., Józsa, G., Kenn, F., Klein, U., Pizzella, A., & Salcuci, P. 2007, New Astronomy Reviews, 51, 120
- Swaters et al. (1999) Swaters, R. A., Schoenmakers, R. H. M., Sancisi, R., & van Albada, T. S. 1999, MNRAS, 304, 330
- Tormen et al. (1998) Tormen, G., Diaferio, A., & Syer, D. 1998, MNRAS, 299, 728
- Toomre & Toomre (1972) Toomre, A., & Toomre, J. 1972, ApJ, 178, 623
- Toomre (1983) Toomre, A. 1983, Internal Kinematics and Dynamics of Galaxies, 100, 177
- Tubbs & Sanders (1979) Tubbs, A. D., & Sanders, R. H. 1979, ApJ, 230, 736
- van der Kruit (1979) van der Kruit, P. C. 1979, A&AS, 38, 15
- Vesperini & Weinberg (2000) Vesperini, E., & Weinberg, M. D. 2000, ApJ, 534, 598
- Weinberg & Blitz (2006) Weinberg, M. D., & Blitz, L. 2006, ApJ, 641, L33
- Zemp et al. (2012) Zemp, M., Gnedin, O. Y., Gnedin, N. Y., & Kravtsov, A. V. 2012, ApJ, 748, 54