The Black Hole Mass Scale of Classical and Pseudo Bulges in Active Galaxies
Abstract
The mass estimator used to calculate black hole (BH) masses in broad-line active galactic nuclei (AGNs) relies on a virial coefficient (the “ factor”) that is determined by comparing reverberation-mapped (RM) AGNs with measured bulge stellar velocity dispersions against the relation of inactive galaxies. It has recently been recognized that only classical bulges and ellipticals obey a tight relation; pseudobulges have a different zero point and much larger scatter. Motivated by these developments, we reevaluate the factor for RM AGNs with available measurements, updated H RM lags, and new bulge classifications based on detailed decomposition of high-resolution ground-based and space-based images. Separate calibrations are provided for the two bulge types, whose virial coefficients differ by a factor of : for classical bulges and ellipticals and for pseudobulges. The structure and kinematics of the broad-line region, at least as crudely encoded in the factor, seems to related to the large-scale properties or formation history of the bulge. Lastly, we investigate the bulge stellar masses of the RM AGNs, show evidence for recent star formation in the AGN hosts that correlates with Eddington ratio, and discuss the potential utility of the relation as a more promising alternative to the conventionally used relation for future refinement of the virial mass estimator for AGNs.
1 Background
The discovery of supermassive black holes (BHs) and empirical relations between BH mass and host galaxy properties ushered an exciting era in extragalactic astronomy over the last decade and a half. Particularly influential was the realization that BH mass correlates strongly with the stellar luminosity or mass (Kormendy & Richstone 1995; Magorrian et al. 1998) and velocity dispersion (Ferrarese & Merritt 2000; Gebhardt et al. 2000a) of the bulge. Supermassive BHs are not only commonplace, but they may play a pivotal role in regulating many aspects of galaxy formation.
Notwithstanding these advances, direct dynamical detections of supermassive BHs do not extend beyond the very nearby Universe (100 Mpc), and even then they are confined only to relatively inactive galaxies. The bulk of the growth of supermassive BHs occurred in more active systems, mostly at earlier epochs. If we are to reach a fuller understanding of the interplay between BH accretion and galaxy evolution, we must devise a method to measure BH masses in active galactic nuclei (AGNs).
Historically, estimating BH masses in AGNs has always been challenging. Methods that rely on continuum fitting are notoriously degenerate and model-dependent (e.g., Sun & Malkan 1989; Sincell & Krolik 1998). Apart from limitations imposed by resolution, standard techniques involving spatially resolved kinematics of stars generally cannot be applied to AGNs because the strong featureless, nonstellar continuum severely dilutes the spectral features of the stars (e.g., Davies et al. 2006; Onken et al. 2007). Low-density, narrow-line gas can be easily detected but its kinematics can be influenced by nongravitational effects (e.g., Hicks & Malkan 2008). Thus, it has long been realized that the dense, high-velocity gas that comprises the broad-line region (BLR) may offer the most promising probe of the gravitational potential of the BH. If the gravity of the BH controls the motions of the BLR clouds, then from the virial theorem
| (1) |
where is the radius of the BLR, is the velocity width of the broad emission lines, is the gravitational constant, and VP is commonly called the virial product. The coefficient depends on the kinematics, geometry, and inclination of the clouds and is likely to vary from object to object.
Now, , with scales of light days to light weeks (Kaspi et al. 2000), cannot be resolved spatially except in a few rare cases magnified by gravitational lensing (e.g., Sluse et al. 2012). It can only be inferred indirectly. Dibai (1977, 1984) pioneered the earliest efforts to constrain through photoionization modeling of the BLR. Subsequent reverberation mapping (RM; Blandford & McKee 1982) of nearby Seyfert 1 galaxies showed that the photoionization method systematically overestimated , by factors of 10 (e.g., Peterson 1993; but see recent improvements in photoionization estimates of by Negrete et al. 2013). Despite the success of RM in improving the accuracy of BLR size measurements, and even though a statistically interesting sample of such measurements had already been accumulated (Ho 1999; Wandel et al. 1999), the community initially did not widely embrace the promise of this new technique. Worries lingered over the key assumption of whether the BLR clouds are truly gravitationally bound (Krolik 2001).
The crucial breakthrough came with the discovery of the relation in nearby inactive galaxies (Ferrarese & Merritt 2000; Gebhardt et al. 2000a) and the demonstration that RM AGNs—at least the handful at the time that had stellar velocity dispersions measured—seem to obey an relation that roughly parallels that of non-AGNs (Gebhardt et al. 2000b; Ferrarese et al. 2001; Nelson et al. 2004). If, as can be reasonably supposed, active and inactive galaxies follow the same relation, then scaling the RM AGNs to the inactive galaxies yields an empirical calibration of the average value of the factor in Equation 1. This is the approach adopted by Onken et al. (2004), Woo et al. (2010), Graham et al. (2011), Grier et al. (2013b), among others.
Two recent developments compel us to reevaluate the zero point of the AGN mass scale. Both are reviewed by Kormendy & Ho (2013) and in Section 2. Section 3 summarizes the most up-to-date database on the host galaxy properties of RM AGNs. We utilize the latest relation to calibrate (Section 4). Implications and outstanding uncertainties are discussed in Section 5. Section 6 ends with a summary and future prospects.
2 The BH-Bulge Relations of Inactive Galaxies
Kormendy & Ho (2013) present a comprehensive review of the current status of BH mass measurements determined through dynamical modeling of spatially resolved kinematics. Their database contains several improvements that lead to important quantitative revisions of the and relations. The key features are the following.
-
•
The sample, the largest and most comprehensive to date, contains 88 galaxies. Apart from new detections, Kormendy & Ho update a number of galaxies with recently improved stellar-dynamical BH masses.
-
•
The sample has been carefully scrutinized to identify three types of systematic problems that were previously underappreciated: (1) mass measurements based on ionized gas kinematics that are biased low due to neglect of gas pressure support; (2) mergers-in-progress that have undermassive BHs; and (3) a few peculiar compact objects, either tidally stripped systems or remnants of high-redshift galaxies, that have overly massive BHs. These outliers should not be included in the final correlations.
-
•
The database contains accurate bulge photometry based on a uniform set of bulge-to-disk decomposition of -band images. The luminosities are converted to stellar masses using newly derived -band mass-to-light ratios. The database also presents consistently measured stellar velocity dispersions for the bulges.
-
•
Importantly, Kormendy & Ho apply a self-consistent set of criteria to separate pseudobulges from classical bulges (Kormendy & Kennicutt 2004), a distinction that turns out to be critical to their redefinition of the BH-host scaling relations. Classical bulges and ellipticals define tight and relations, whereas pseudobulges do not. Kormendy & Ho propose that only classical bulges and ellipticals, both formed through gas-rich mergers at early times, participate in BH-galaxy coevolution. Pseudobulges experience slow, stochastic growth via secular processes and do not coevolve closely with their central BH.
-
•
Excluding pseudobulges,
(2) and
(3) The intrinsic scatter is 0.29 dex for both relations: the relation is not intrinsically tighter than the relation. Equation 2 is slightly steeper than the best-fit relation of Gültekin et al. (2009), but not as extreme as that of McConnell & Ma (2013) based on the entire sample that does not distinguish by bulge type. Equation 3 is marginally steeper than the near-linear relation of Häring & Rix (2004), but the most important difference lies in the normalization, which is on average times higher than the canonical value of (Kormendy & Gebhardt 2001; Häring & Rix 2004).
3 Bulge Properties and Virial Products for the RM Sample
In light of the developments discussed in Section 2, the factor for the RM AGN sample should be reevaluated taking into account the bulge type of the host galaxies. Our approach is fundamentally different from that of other recent efforts to quantify (Woo et al. 2010, 2013; Park et al. 2012a; Grier et al. 2013b), which do not explicitly distinguish between pseudo and classical bulges. The work of Graham et al. (2011) comes closest to the spirit of this paper, but it primarily emphasizes the role of bars, which, as Kormendy & Ho emphasize, is related to, but not synonymous with, pseudobulges.
We devote considerable attention to classify the bulge type of the RM AGN sample in a consistent manner. The criteria used to identify pseudobulges (Kormendy & Kennicutt 2004) are summarized and augmented in Kormendy & Ho (2013; Supplemental Material). However, in practice some of the criteria normally used to classify inactive galaxies are difficult to apply to type 1 (broad-line) Seyferts and quasars, whose host galaxies, especially their bulges, are often severely contaminated by the bright active nucleus. Appendix A gives notes for each object in our sample, which was individually scrutinized using all available photometric information in the literature. We give preference to two-dimensional structural decomposition of high-resolution images—principally, but not exclusively, based on Hubble Space Telescope (HST) observations—with sufficient detail to extract a robust measurement of the bulge-to-total () luminosity ratio and a bulge surface brightness distribution parameterized by the Sérsic (1968) function. Recently, Grier et al. (2013a) also attempted to assign bulge types to the RM sample, but we disagree with a number of their classifications.
Following common practice (Kormendy & Kennicutt 2004; Fisher & Drory 2008), we consider bulges with a Sérsic index as pseudobulges and those with as classical bulges. However, as illustrated in Appendix A, a practical challenge arises from the fact that it is often difficult to decompose the bulge accurately in AGN hosts, let alone a higher order attribute such as its profile shape. The luminosity of the bulge is a more robust quantity. Thus, apart from the Sérsic index, we also take into consideration the relative light fraction of the bulge, generally favoring a pseudobulge classification for systems with
0.2 (Fisher & Drory 2008; Gadotti 2009). In some cases, additional clues come from the detection of circumnuclear rings and other signatures of ongoing central star formation.
Our RM AGN sample consists of the 44 objects that has been imaged, to varying degrees of accuracy, at rest-frame optical wavelengths with HST. This comprises the majority () of all sources with published RM data. Appendix A describes details relevant to our bulge classification, and Table 1 summarizes the final results. Among the 44 objects, we formally classify 13 as ellipticals, 14 as classical bulges, and 16 as pseudobulges; one (PG 1022+519 or Mrk 142) does not have a detectable bulge component (Bentz et al. 2013) and hence cannot be classified. Reliable measurements of central stellar velocity dispersion are available for a total of 31 sources, among them 15 classical bulges or ellipticals and all of the 16 pseudobulges. For all 43 of the galaxies with detected bulges, we convert their bulge luminosities to the band following the procedure of Kim et al. (2008a) and Kim et al. (2014; hereinafter K14). This involves transforming each of the observed HST filters to assuming the fiducial composite quasar spectrum from Vanden Berk et al. (2001) for the nucleus and the galaxy spectral templates from Calzetti et al. (1994) and Kinney et al. (1996) for the bulge. The choice of galaxy template is based on the Hubble type inferred from the measured , using the statistical correlation between the morphological type and of Simien & de Vaucouleurs (1986).
We calculate virial products using improved time lag measurements based on the SPEAR method of Zu et al. (2011), as advocated by Grier et al. (2013b). Whenever possible we adopt the revised time lags from the recent compilation of Grier et al. (2013b). The majority of those not included in that work have revised lags given in Zu et al. Of the 43 sources with bulge parameters, 39 (91%) have revised and improved H lags (Table 2).
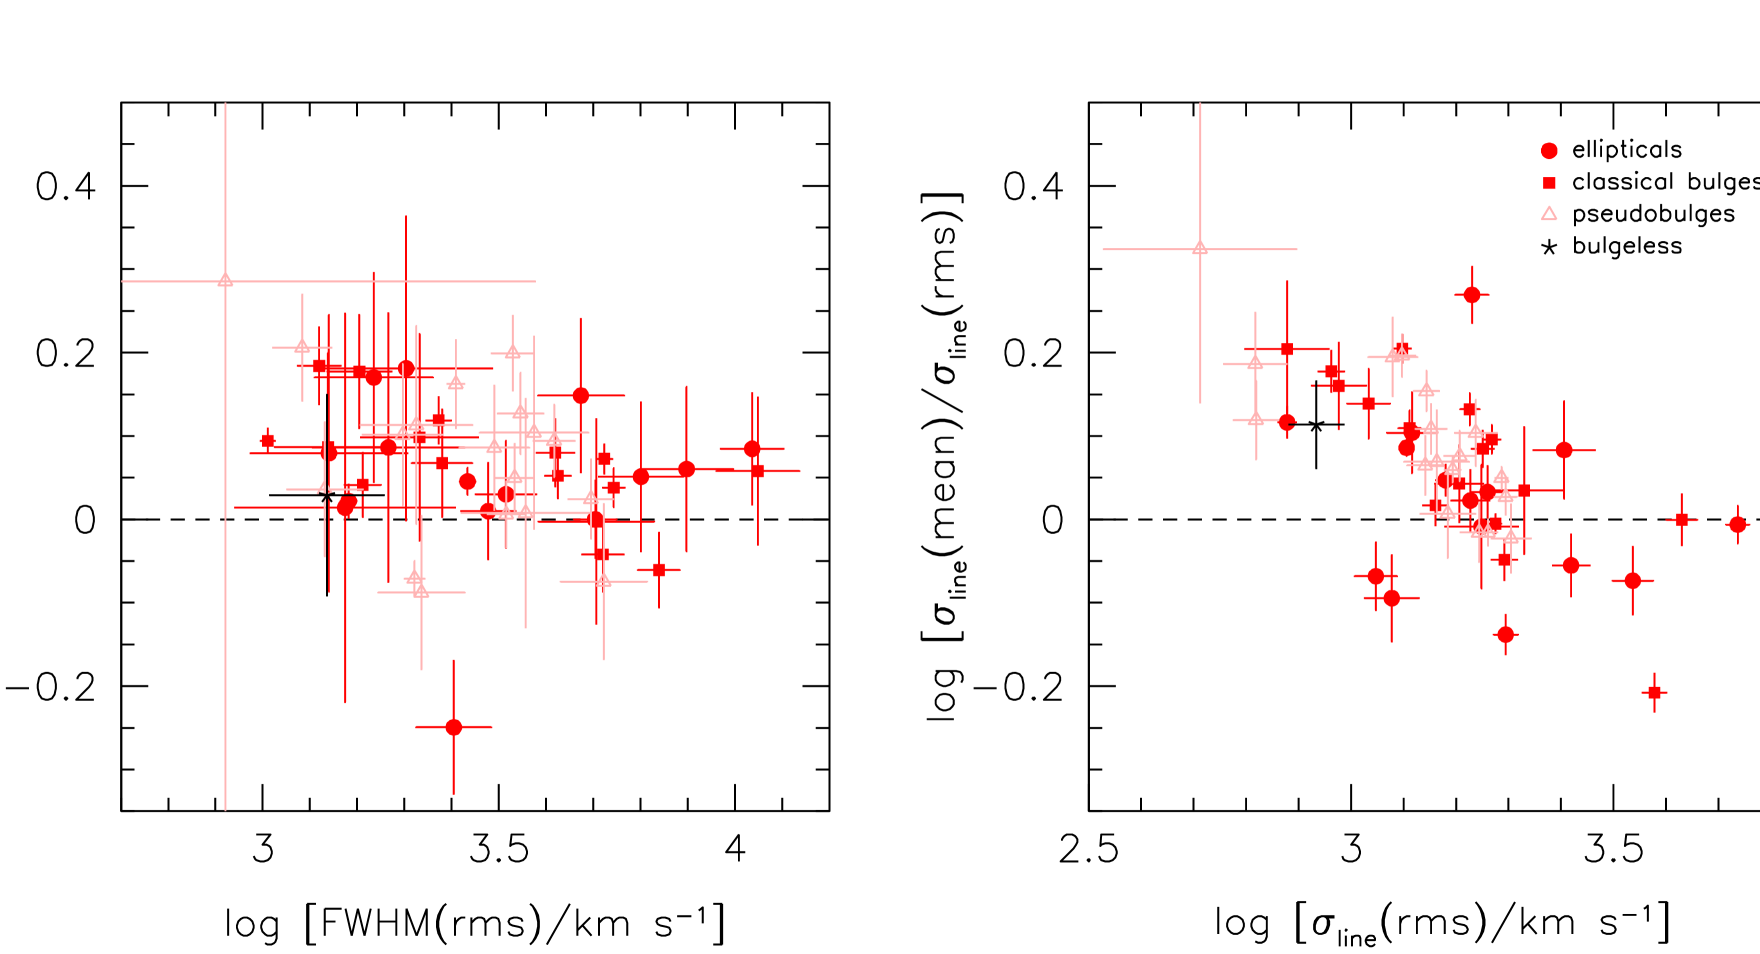
With the notable exception of Collin et al. (2006), previous works calculate using the virial product based on the dispersion (second moment) of H, , measured from the root-mean-square (rms) spectrum. While there are well-motivated reasons for this choice (e.g., Peterson et al. 2004), a priori it is not obvious that leads to a better calibration of than FWHM, although Collin et al. (2006) argue that is a less biased estimator of than FWHM. Moreover, rms and mean spectra may yield systematically different line widths. Table 2 lists line widths measured from both rms and mean spectra and their respective virial products. Published line widths measured from mean spectra exist for all but five of the 44 RM AGNs, including 26 of the 31 sources with . Consistent with past studies (e.g., Sergeev et al. 1999; Collin et al. 2006), we confirm that mean spectra yield systematically broader H line widths than rms spectra (Figure 1), on average by ( dex for FWHM and for ). Curiously, the discrepancy between mean and rms velocities is most severe for systems with 2000 km s-1, and the amount of departure increases systematically with decreasing (right panel of Figure 1). Park et al. (2012b) noticed this effect in a significantly smaller sample. The trend also appears for FWHM but it is less well defined; FWHM(mean) statistically exceeds FWHM(rms) at all velocities, although the largest excess occurs at FWHM 3000 km s-1 (left panel of Figure 1).
4 Calibrating
As in previous works, we compute by assuming that the RM AGNs intrinsically obey the same relation as inactive galaxies. The key difference between our approach and that of past studies is that we initially restrict the calibration
![[Uncaptioned image]](/html/1406.6137/assets/x2.png)
![[Uncaptioned image]](/html/1406.6137/assets/x3.png)
![[Uncaptioned image]](/html/1406.6137/assets/x4.png)
![[Uncaptioned image]](/html/1406.6137/assets/x5.png)
(Top) The relation for inactive galaxies (black points) and RM AGNs (red points). The masses for the RM AGNs represent the virial product, , with (H) measured from rms spectra. Classical bulges and ellipticals are highlighted as filled symbols, and pseudobulges are plotted as open symbols. Error bars are suppressed for the inactive galaxies to reduce crowding. The best-fit relation of Kormendy & Ho for classical bulges and ellipticals (Equation 2) is given by the solid line; the gray shading represents its scatter. The fits of Gültekin et al. (2009) and McConnell & Ma (2013) are shown as dashed and dotted lines, respectively. (Bottom) Residuals of the data points with respect to the Kormendy & Ho fit for ellipticals and classical bulges. The red dashed line and associated shaded pink band mark the average offset and standard deviation for the 15 RM AGNs hosted by ellipticals and classical bulges: .
exclusively to classical bulges and ellipticals, which Kormendy & Ho (2013) show to be the only subgroup of local inactive galaxies that obey a tight relation. Pseudobulges do not.
Figure 2 shows the distribution for inactive galaxies (solid black points) with spatially resolved dynamical BH mass measurements from the database of Kormendy & Ho, with their best-fitting relation (Equation 2) for classical bulges and ellipticals overplotted as a solid line accompanied by its 1 range in gray shading. Pseudobulges, excluded from the fit, are shown as open symbols in a lighter shade. For comparison, we also show the Gültekin et al. (2009) and McConnell & Ma (2013) fits, which include both bulge types mixed. The colored points represent the subset of 31 RM AGNs that have measurements of ; plotted on the ordinate is the virial product based on parameterized through (H) measured from rms spectra. The bottom panel shows the residuals of the data points with respect to the best-fit relation. On average, the RM AGNs in classical bulges and ellipticals are offset from their inactive counterparts by 0.79 dex (factor 6.2; red dashed line),
![[Uncaptioned image]](/html/1406.6137/assets/x6.png)
The relation for RM AGNs (red points) with the virial products scaled by to match the locus of inactive galaxies (black points). Error bars are suppressed for the inactive galaxies to reduce crowding. The virial products, derived from (H) measured from rms spectra, have been scaled by for classical bulges and ellipticals and by for pseudobulges. The best-fit relation of Kormendy & Ho for classical bulges and ellipticals (Equation 2) is given by the solid line; the gray shading denotes its scatter.
with a standard deviation of 0.42 dex (pink shaded band). This is a zeroth-order estimate of .
To obtain a more formal determination of and its intrinsic scatter, we express the relation as
| (4) |
where is the normalization and is the slope. We use the FITEXY estimator (Press et al. 1992), as modified by Tremaine et al. (2002), to perform a linear regression to minimize the quantity
| (5) |
Park et al. (2012a) discuss at length the performance of alternate fitting methods. In the above expression, and are the regression coefficients, , , and are their respective measurement errors, and is the intrinsic scatter. FITEXY treats and as independent variables and allows for asymmetric errors. Fixing the intercept () and slope () to those of the relation for inactive galaxies, we solve for the two parameters and . For VP based on (H), we find and dex, consistent with the simple estimate above. In the case of VP based on FWHM(H), . For completeness, Table 3 also gives fits for VP calculated from mean spectra instead of rms spectra. The errors on the parameters come from a bootstrap calculation. We perform the same calculation using randomly selected
![[Uncaptioned image]](/html/1406.6137/assets/x7.png)
subsamples repeated 5000 times. The errors are determined by the standard deviation of the best parameters derived from the repeated estimation.
The above estimate of strictly holds only for AGNs hosted by elliptical galaxies and classical bulges. We cannot apply the same calibration strategy to systems containing pseudobulges because their inactive counterparts exhibit a significantly different (Hu 2008) and much looser (Greene et al. 2010; Kormendy et al. 2011; Kormendy & Ho 2013) relation. Although the scatter of the relation for pseudobulges is indeed large, Figure 2 illustrates that, as a group, pseudobulges tend to lie systematically below the locus of classical bulges and ellipticals. Kormendy & Ho resisted from performing a formal fit to the pseudobulges on account of the questionable physical significance of the relation for these objects. Here, we have a more pragmatic concern: without a reference point for pseudobulges, even if imprecise, we lose all ability to estimate BH masses for a large segment of the AGN population, many of which have modest that likely live in disk host galaxies with pseudobulges. We proceed as follows.
Keeping the slope fixed to , the pseudobulge population (tabulated in Table 3 of Kormendy & Ho) has a zero point of and an intrinsic scatter of dex. If we assume that inactive pseudobulges follow an relation with the same slope as classical bulges but with a zero point offset by this magnitude111A formal fit to the pseudobulges alone yields a significantly shallower but highly uncertain slope of , , and dex., then we can derive a rough estimate of the corresponding factor for the 16 RM AGNs hosted by pseudobulges. Following the same procedure as above, the FITEXY estimator yields for VP() and for VP(FWHM). AGNs in classical bulges and pseudobulges do not share the same value of ; the former has a value times larger. Figure 3 redisplays the relation for RM AGNs, now with the virial products properly scaled by the bulge type-specific factor. The AGN hosts—by design—faithfully track their inactive counterparts.
The above results were obtained by fixing to 4.38, the slope of the relation for inactive classical bulges. It is interesting to note that an unconstrained fit on VP() for the RM AGNs yields and for the classical and pseudo bulge subsamples, respectively. Both slopes are consistent with those of their respective counterparts in the inactive galaxy sample. The relation of pseudobulges—whether their BHs are active or not—is marginally shallower than that of classical bulges. For completeness, Table 3 lists factors inferred for fits with unconstrained, but for these cases the uncertainties are large and we recommend against them for actual applications.
5 Discussion
5.1 The Factor Depends on Bulge Type
A number of previous works have used the relation of inactive galaxies to derive the zero point ( factor) of the virial mass estimator for AGNs (Equation 1). Onken et al. (2004) first applied this calibration, referenced with respect to the relation of quiescent galaxies of Tremaine et al. (2002), to a subset of 14 RM AGNs with available measurements of to arrive at . This value of pertains to VP calculated from (H). Woo et al. (2010) enlarged the sample to 24 objects and, using the Gültekin et al. (2009) relation as reference, redetermined and an intrinsic scatter of dex. Slight variants of this exercise, with essentially comparable results, appear in Park et al. (2012a) and Woo et al. (2013). Grier et al. (2013b) present the largest and latest collection of RM lags and stellar velocity dispersion measurements; using the quiescent galaxy sample of McConnell et al. (2011) as reference, they find and no noticeable dependence on mass or galaxy morphology. The most notable exception comes from Graham et al. (2011), who report a significantly lower value of ; Park et al. (2012a) conclude that this large difference comes from sample selection and choice of regression method.
We take a different approach. Motivated by the recent evidence that the BH-host scaling relations depend strongly on bulge type (Kormendy & Ho 2013), we calibrate the factor
separately for classical and pseudo bulges. This is by no means straightforward, in view of the vagaries of bulge classification, which is made all the more challenging in the presence of a bright active nucleus. Nevertheless, we demonstrate that active galaxies, as their inactive counterparts, separately do define their own relation according to bulge type. Moreover, the slopes of the respective relations for classical and pseudo bulges are—within the considerable error bars—consistent between active and inactive galaxies. Our unconstrained fits for VP() based on rms spectra yield for classical bulges and for pseudobulges. Qualitatively similar differences between classical and pseudo bulges are found for VP(FWHM) and for line widths measured from mean spectra (see Table 3). A number of previous studies (e.g., Greene & Ho 2006; Woo et al. 2010, 2013; Bennert et al. 2011; Xiao et al. 2011) conclude that the relation of active galaxies tends to be shallower than that of inactive systems. In light of the present findings, the previous results can be understood to be a natural consequence of the fact that current AGN samples with measurements tend to contain a large proportion of later type galaxies, which preferentially host pseudobulges (Kormendy & Kennicutt 2004).
Of more immediate relevance to the BH mass scale of AGNs, we show that AGNs hosted in pseudobulges lie slightly but systematically below the relation compared to those hosted in classical bulges. Again, this parallels the trend seen in inactive galaxies (Hu 2008; Greene et al. 2010; Kormendy et al. 2011; Kormendy & Ho 2013), as Figure 2 clearly illustrates. This being the case, the factor should depend on bulge type. Indeed, with the slope of the relation fixed to , classical bulges and ellipticals on average have , twice the value of for pseudobulges. These values pertain to VP() derived from rms spectra, but the same trend holds for other measures of VP (Table 3). Given that uncertainties in the factor currently dominate the overall error budget of BH virial masses, this factor-of-two difference in between classical and pseudo bulges represents a major source of systematic uncertainty that can—and should—be eliminated. In practice, however, this will be challenging to implement. Classification of the bulge type depends on detailed information on the structural parameters of the host galaxy, which is difficult to ascertain for distant or very luminous quasars wherein the bright nucleus overwhelms the signal from the central regions of the host. Fortunately, pseudobulges tend to be confined to lower mass systems: most are characterized by and 200 km s-1 (Figure 2). For the foreseeable future, studies of high-redshift AGNs will be sensitive mostly to the upper end of the BH mass function, a regime likely to be dominated by ellipticals or early-type galaxies with classical bulges. On the other hand, lower redshift AGNs with will suffer from this factor-of-two uncertainty in unless the bulge type can be determined independently; pseudo and classical bulges thoroughly overlap within this mass range (Figure 2). Only for are AGN samples likely to be dominated by pseudobulges (e.g., Greene et al. 2008; Jiang et al. 2011). In such low-mass systems, it would be relatively safe to adopt a priori the factor appropriate for pseudobulges.
Graham et al. (2011), studying the dependence of the relation on bars, show for the RM AGN sample that the factor for barred hosts is times lower than that for unbarred hosts. Although the presence of a bar does not correlate perfectly with bulge type, the systematic difference in between barred and unbarred galaxies qualitatively resembles the dependence on bulge type that we find.
Taken at face value, the different factors for pseudo and classical bulges suggest that the two groups on average have systematically different BLR structures. A value of for pseudobulges formally corresponds to a spherical BLR (Kaspi et al. 2000), whereas for classical bulges agrees better with a disk-like geometry. It is unclear why the structure of the BLR would depend on the large-scale properties of the host galaxy bulge. From dynamical modeling of velocity-resolved RM data, Brewer et al. (2011) infer for Arp 151, and Pancoast et al. (2012) obtain for Mrk 50. Both objects host a classical bulge (Table 1), although the classification for Arp 151 is quite uncertain because of its strongly tidally distorted morphology (Appendix A). We should also keep in
![[Uncaptioned image]](/html/1406.6137/assets/x9.png)
relation for inactive galaxies (black points) and RM AGNs (red points). Error bars are suppressed for the inactive galaxies to reduce crowding. The virial products, derived from (H) measured from rms spectra, have been scaled by for classical bulges and ellipticals and by for pseudobulges. The best-fit relation of Kormendy & Ho for classical bulges and ellipticals (Equation 3) is given by the solid line; the gray shading denotes its scatter. AGNs hosted by classical bulges and ellipticals with / 0.07 are denoted by filled red symbols and the red dashed line; those with / 0.07 are highlighted with a blue center and the blue dotted line.
mind that the apparent difference in between pseudo and classical bulges can arise, at least in part, from uncertainties in bulge classification.
5.2 Possible Dependence of on Eddington Ratio
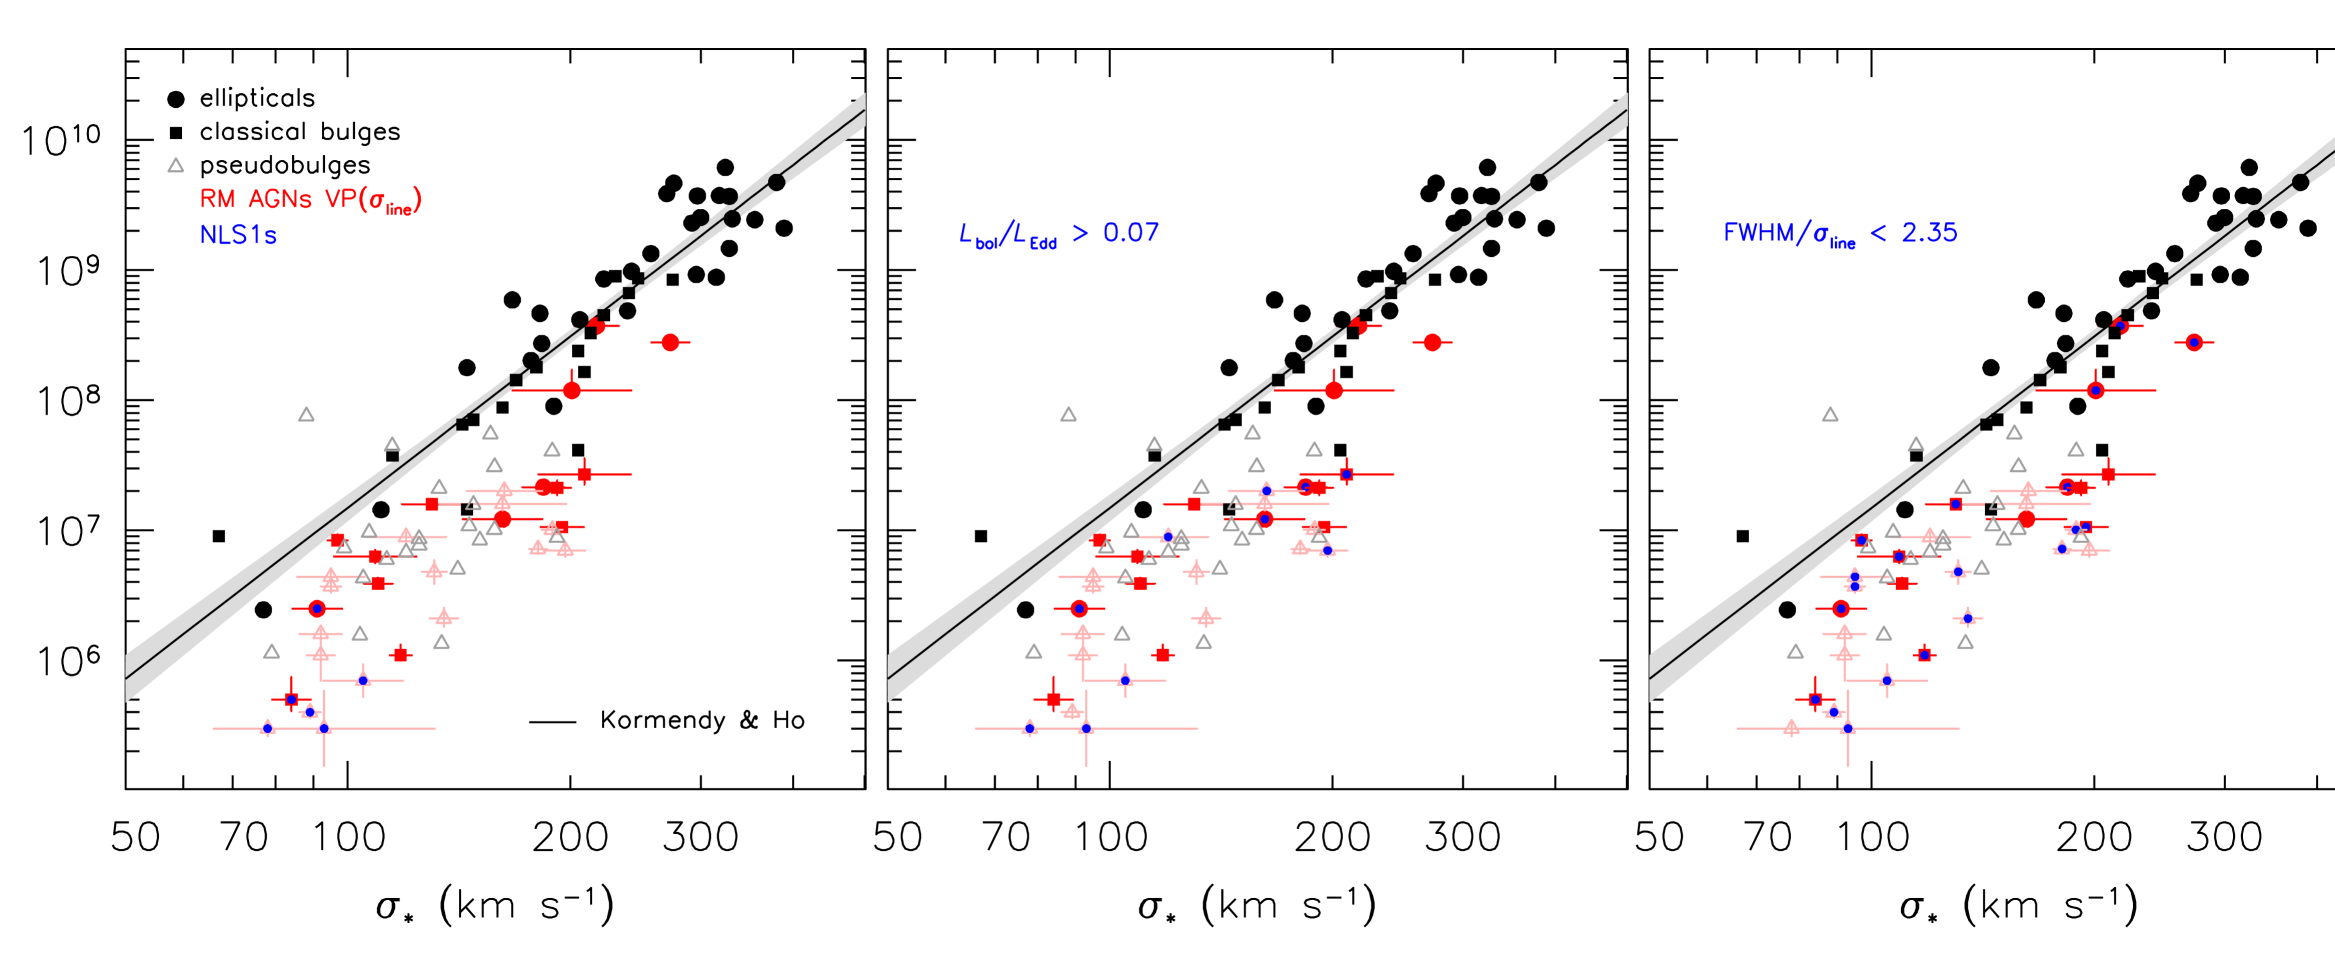
Figure 4 shows that the factor may also depend mildly on Eddington ratio. The statistics are poor, but the evidence is suggestive. Objects crudely222We do not have access to other additional commonly used criteria that include Fe II and [O III] 5007 strength. classified as narrow-line Seyfert 1 galaxies (NLS1s; blue points in left panel) according to FWHM(H) 2000 km s-1, typically regarded as highly accreting systems (e.g., Boroson 2002), lie systematically offset toward lower at a given than those with larger line widths. The middle panel separates the objects by Eddington ratio to illustrate this effect more clearly. The RM sample has a median Eddington ratio of = 0.07, calculated from the bolometric luminosity (5100 Å) (McLure & Dunlop 2004), with (5100 Å) given in Table 2, erg s-1, and derived assuming a fiducial from Woo et al. (2010). Splitting the sample in half at this median value, objects with larger (blue points) lie displaced toward lower at a given than those with smaller . The magnitude of the offset is dex in log , or, equivalently, in . The trend seems to hold separately for both pseudobulges and classical bulges alike.
Collin et al. (2006) note that the shape of the H profile, as gauged by FWHM/, varies systematically with line width and Eddington ratio. Sources with NLS1-like velocity widths and high tend to have H profiles with narrower cores, which these authors suggest arise, at least in part, from inclination effects. They further argue that this systematic effect can be mitigated by using instead of FWHM when computing VP. Thus, it appears unlikely that the effect seen in Figure 4 can be attributed to inclination alone. Indeed, the right panel of the figure shows that the distribution of points does not depend on FWHM/. Interpreted literally, the structure and kinematics of the BLR, as crudely imprinted in the factor, correlate with Eddington ratio: higher accretion rates result in larger values of .
5.3 Evidence of Young Stars in AGN Hosts
As a by-product of the structural decomposition of the host galaxies needed for classifying the bulge types, we have a uniform set of accurately determined -band luminosities for the bulge. Unfortunately, we do not yet have sufficient color information to transform the luminosities into reliable stellar masses. As an initial estimate, we assume (Bell et al. 2003), which, for = 1.57 mag appropriate for an evolved elliptical galaxy (Fukugita et al. 1995), implies . We adopt mag for the Sun333mips.as.arizona.edu/cnaw/sun.html.
Figure 5 shows the relation for inactive galaxies from Kormendy & Ho and for the 43 RM AGNs with bulge stellar masses crudely estimated as described above. As in Figure 3, we scale the virial products by the relevant factor (determined through the relation) according to bulge type. Three things are immediately obvious, especially when we restrict our attention to the classical bulges and ellipticals that form an intrinsically well-defined and tight scaling relation among inactive galaxies. First, the AGN hosts lie systematically displaced from the inactive galaxies; at fixed , is 0.4 dex lower, or, equivalently, is 0.35 dex higher at fixed . Second, active hosts show greater intrinsic scatter ( dex) than inactive systems ( dex; Kormendy & Ho 2013). And third, the largest offsets are confined preferentially to sources with the highest Eddington ratios (highlighted in blue). Dividing the sample by the median value of = 0.07, objects above this limit have a median dex whereas those below this division have only dex.
The offset between active and inactive galaxies in the plane lends itself to two possible explanations. One possibility is that active galaxies genuinely have systematically lower BH masses than inactive galaxies, or their BH masses have been systematically underestimated. This was the interpretation offered by Kim et al. (2008a) to account for a similar result seen in a sample of low-redshift quasars with available single-epoch BH masses and HST photometry for the host. This explanation can be ruled out for the current sample of RM AGNs, whose BH masses have been explicitly and independently calibrated through the relation. As discussed in Section 5.3, there might be a modest dependence of the factor on Eddington ratio, but this contributes only at the level of dex, not enough to account for the 0.4 dex offset seen in Figure 5. The second possibility is that the offset comes from a systematic overestimation of the stellar mass of the bulge due to the presence of young stars. While the evidence for ongoing star formation in luminous AGNs remains controversial (e.g., Ho 2005; Kim et al. 2006; Shi et al. 2009; Mullaney et al. 2012), the association between nuclear activity and recent star formation is more secure (e.g., Cid Fernandes et al. 2001; Kauffmann et al. 2003). To explain the shift of 0.4 dex in for the AGN population in Figure 5, we need to reduce the mass-to-light ratio by a factor of compared to the value we adopted for an evolved elliptical galaxy. This implies that the integrated light of the stellar population of the bulges of AGN hosts resembles that of an Sbc or Sc spiral (Fukugita et al. 1995). A qualitatively similar luminosity enhancement has been seen in other samples of local active galaxies (e.g., Nelson et al. 2004; Bennert et al. 2011; Busch et al. 2014).
6 Summary and Future Directions
Kormendy & Ho (2013) recently show that the and relations of nearby inactive galaxies depend strongly on bulge type. Only classical bulges and elliptical galaxies obey these correlations tightly; pseudobulges show markedly different correlations characterized by a lower zero point and larger intrinsic scatter. The virial mass estimators widely used to derive BH masses for broad-line AGNs require a zero point determination of the so-called factor that is established by scaling the virial product, VP = , derived from reverberating mapping, to the relation of inactive galaxies. Previous studies, while recognizing the possible importance of distinguishing between pseudo and classical bulges, have not explicitly attempted to take this into account.
This paper remedies this situation by performing a comprehensive classification of the bulge type of the host galaxies of the latest sample of reverberation-mapped AGNs, through careful assessment of all available high-resolution ground-based and space-based images and other ancillary data. A total of 44 sources are included, of which 31 (16 pseudobulges and 15 classical bulges and ellipticals) have reliable stellar velocity dispersion measurements. We demonstrate, for the first time, that classical and pseudo bulges in active galaxies—as in inactive systems—obey distinctly different relations. At the same time, the slopes of the respective relations for the two bulge types are, within the relatively large uncertainties, compatible between AGN and non-AGN hosts. This justifies the use of the inactive galaxy sample to fix the zero point of the virial coefficient for RM AGNs.
Using the relation of Kormendy & Ho as the fiducial reference, we derive an updated factor appropriate for AGNs hosted by classical bulges and ellipticals. We extend the calibration to pseudobulge AGN hosts using an approximate extrapolation of the relation for inactive galaxies to pseudobulges systems. In the case of virial products based on (H) measured from rms spectra, for classical bulges and for pseudobulges. While the factor for classical bulges is not substantially different from (Onken et al. 2004) or (Woo et al. 2010) commonly adopted in recent years, the value for pseudobulges is notably lower.
Our analysis shows that the factor, and, by implication, the structure and kinematics of the BLR, correlates with the large-scale properties of the host galaxy bulge. While the two bulge types signify different evolutionary pathways (Kormendy & Kennicutt 2004; Kormendy & Ho 2013)—rapid formation via major mergers for classical bulges versus slow, secular evolution for pseudobulges—it is puzzling that the global conditions of the host connect to the physical properties of the nucleus on ultra-small scales. Within each bulge type there is also tentative evidence that the BLR structure changes systematically with Eddington ratio.
Building on earlier work, this paper follows the conventional strategy of calibrating the average factor by scaling the VP of RM AGNs so that statistically they match the relation of local inactive galaxies. However, in spite of a decade of observational effort (e.g., Ferrarese et al. 2001; Nelson et al. 2004; Onken et al. 2004; Dasyra et al. 2007; Watson et al. 2008; Woo et al. 2010, 2013), the number of RM AGNs with measured (31) remains frustratingly small, especially that now, as we advocate, the sample must be subdivided into two groups according to bulge type. The problem is particularly acute at the upper end of the mass distribution, which is most relevant for the quasar regime. For example, of the 12 objects in the RM sample with BH masses formally (adopting ), only three (3C 390.3, PG 1617+175, and PG 1426+015) have measured. The region of the relation for AGNs with 200 km s-1 is dangerously underpopulated (Figure 3). We are not optimistic that the situation will improve any time soon, as the most recent efforts to address this subject (e.g., Grier et al. 2013b) have already pushed 8–10 m class telescopes to their practical limits. Dynamical modeling of velocity-resolved RM data may eventually yield robust individual BH masses without the need to invoke , but this method is still in its infancy (Brewer et al. 2011; Pancoast et al. 2012; Li et al. 2013).
Where do we go from here?
We suggest that the relation offers a promising substitute for the relation. As discussed in Kormendy & Ho and in Section 2, the intrinsic scatter of both scaling relations is essentially indistinguishable. Thus, either one can serve as an effective anchor to calibrate . The stellar light of AGN host galaxies is generally much easier to measure photometrically than spectroscopically. This can be seen from a simple comparison of the number of objects in Figure 5 versus Figure 3. However, a couple of caveats should be borne in mind. First, although high-resolution imaging can routinely detect host galaxy emission in relatively nearby AGNs (e.g., Kim et al. 2008a; Bentz et al. 2009a, 2013; Bennert et al. 2010), a variety of systematic uncertainties often makes quantitative measurements tricky (see Appendix A), especially as they pertain to the bulge component that is maximally affected by the central point source (Kim et al. 2008b). The Sérsic index, a key ingredient to classify the bulge type, is particularly hard to determine accurately. Second, we measure not stellar mass but light. Figure 5 reminds us that AGN hosts often contain nonnegligible quantities of young stars, and these must be properly quantified with multi-band colors and stellar population models before the relation can be used as a tool to constrain .
References
- (1) Barth, A. J., Pancoast, A., Thorman, S. J., et al. 2011, ApJ, 743, L4
- (2) Bell, E. F., McIntosh, D. H., Katz, N., & Weinberg, M. D. 2003, ApJS, 149, 289
- (3) Bennert, V. N., Auger, M. W., Treu, T., Woo, J.-H., & Malkan, M. A. 2011, ApJ, 726, 59
- (4) Bennert, V. N., Treu, T., Woo, J.-H., et al. 2010, ApJ, 708, 1507
- (5) Bentz, M. C., Denney, K. D., Cackett, E. M., et al. 2006, ApJ, 651, 775
- (6) Bentz, M. C., Denney, K. D., Grier, C. J., et al. 2013, ApJ, 767, 149
- (7) Bentz, M. C., Peterson, B. M., Netzer, H., Pogge, R. W., & Vestergaard, M. 2009a, ApJ, 697, 160
- (8) Bentz, M. C., Walsh, J. L., Barth, A. J., et al. 2009b, ApJ, 705, 199
- (9) Blandford, R. D., & McKee, C. F. 1982, ApJ, 255, 419
- (10) Boroson, T. A. 2002, ApJ, 565, 78
- (11) Brewer, B. J., Treu, T., Pancoast, A., et al. 2011, ApJ, 733, L33
- (12) Busch, G., Zuther, J., Valencia-S., M., et al. 2014, A&A, 561, A140
- (13) Calzetti, D., Kinney, A. L., & Storchi-Bergmann, T. 1994, ApJ, 429, 582
- (14) Chatzichristou, E. T. 2000, ApJS, 131, 71
- (15) Cid Fernandes, R., Heckman, T. M., Schmitt, H. R., et al. 2001, ApJ, 558, 81
- (16) Collin, S., Kawaguchi, T., Peterson, B., & Vestergaard, M. 2006, A&A, 456, 75
- (17) Crenshaw, D. M., Kraemer, S. B., & Gabel, J. R. 2003, AJ, 126, 1690
- (18) Dasyra, K. M., Tacconi, L. J., Davies, R. I., et al. 2007, ApJ, 657, 102
- (19) Davies, R. I., Thomas, J., Genzel, R., et al. 2006, ApJ, 646, 754
- (20) Denney, K. D., Bentz, M. C., Peterson, B. M., et al. 2006, ApJ, 653, 152
- (21) Denney, K. D., Peterson, B. M., Pogge, R. W., et al. 2010, ApJ, 721, 715
- (22) Deo, R. P., Crenshaw, D. M., & Kraemer, S. B. 2006, AJ, 132, 321
- (23) de Vaucouleurs, G., de Vaucouleurs, A., Corwin Jr., H. G., et al. 1991, Third Reference Catalogue of Bright Galaxies (New York: Springer) (RC3)
- (24) Dibai, E. A. 1977, Sov. Astron. Lett., 3, 1
- (25) Dibai, E. A. 1984, Sov. Astron., 28, 245
- (26) Dietrich, M., Peterson, B. M., Grier, C. J., et al. 2012, ApJ, 757, 53
- (27) Fanaroff, B. L., & Riley, J. M. 1974, MNRAS, 167, 31P
- (28) Ferrarese, L., & Merritt, D. 2000, ApJ, , 539, L9
- (29) Ferrarese, L., Pogge, R. W., Peterson, B. M., et al. 2001, ApJ, 555, L79
- (30) Fischer, S., Iserlohe, C., Zuther, J., et al. 2006, A&A, 452, 827
- (31) Fisher, D. B., & Drory, N. 2008, AJ, 136, 773
- (32) Fukugita, M., Shimasaku, K., & Ichikawa, T. 1995, PASP, 107, 945
- (33) Gadotti, D. A. 2009, MNRAS, 393, 1531
- (34) Gebhardt, K., Bender, R., Bower, G., et al. 2000a, ApJ, 539, L13
- (35) Gebhardt, K., Kormendy, J., Ho, L. C., et al. 2000b, ApJ, 543, L5
- (36) Graham, A. W., Onken, C. A., Athanassoula, E., & Combes, F. 2011, MNRAS, 412, 2211
- (37) Greene, J. E., & Ho, L. C. 2006, ApJ, 641, L21
- (38) Greene, J. E., Ho, L. C., & Barth, A. J. 2008, ApJ, 688, 159
- (39) Grier, C. J., Martini, P., Watson, L. C., et al. 2013b, ApJ, 773, 90
- (40) Grier, C. J., Peterson, B. M., Horne, K., et al. 2013a, ApJ, 764, 4
- (41) Grier, C. J., Peterson, B. M., Pogge, R. W., et al. 2012, ApJ, 755, 60
- (42) Gültekin, K., Richstone, D. O., Gebhardt, K., et al. 2009, ApJ, 698, 198
- (43) Guyon, O., Sanders, D. B., & Stockton, A. 2006, ApJS, 166, 89
- (44) Häring, N., & Rix, H.-W. 2004, ApJ, 604, L89
- (45) Hicks, E. K. S., & Malkan, M. A. 2008, ApJS, 174, 31
- (46) Ho, L. C. 1999, in Observational Evidence for Black Holes in the Universe, ed. S. K. Chakrabarti (Dordrecht: Kluwer), 157
- (47) Ho, L. C. 2005, ApJ, 629, 680
- (48) Hutchings, J. B., & Crampton, D. 1990, AJ, 99, 37
- (49) Jiang, Y.-F., Greene, J. E., Ho, L. C., Xiao, T., & Barth, A. J. 2011, ApJ, 742, 68
- (50) Kaspi, S., Smith, P. S., Netzer, H., et al. 2000, ApJ, 533, 631
- (51) Kauffmann, G., Heckman, T. M., Tremonti, C., et al. 2003, MNRAS, 346, 1055
- (52) Kim, M., Ho, L. C., & Im, M. 2006, ApJ, 642, 702
- (53) Kim, M., Ho, L. C., Peng, C. Y., et al. 2008a, ApJ, 687, 767
- (54) Kim, M., Ho, L. C., Peng, C. Y., Barth, A. J., & Im, M. 2008b, ApJS, 179, 28
- (55) Kim, M., Ho, L. C., Peng, C. Y., Barth, A. J., & Im, M. 2014, in preparation (K14)
- (56) Kinney, A. L., Calzetti, D., Bohlin, R. S., et al. 1996, ApJ, 467, 38
- (57) Komatsu, E., Dunkley, J., Nolta, M. R., et al. 2009, ApJS, 180, 330
- (58) Kormendy, J., Bender, R., & Cornell, M. E. 2011, Nature, 469, 374
- (59) Kormendy, J., & Gebhardt, K. 2001, in The 20th Texas Symposium on Relativistic Astrophysics, ed. H. Martel & J. C. Wheeler (Melville: AIP), 363
- (60) Kormendy, J., & Ho, L. C. 2013, ARA&A, 51, 551
- (61) Kormendy, J., & Kennicutt, R. C. 2004, ARA&A, 42, 603
- (62) Kormendy, J., & Richstone, D. O. 1995, ARA&A, 33, 581
- (63) Koss, M., Mushotzky, R., Veilleux, S., et al. 2011, ApJ, 739, 57
- (64) Kotilainen, J. K., Ward, M. J., & Williger, G. M. 1993, MNRAS, 263, 655
- (65) Krolik, J. H. 2001, ApJ, 551, 72
- (66) Laing, R. A., Riley, J. M., & Longair, M. S. 1983, MNRAS, 204, 151
- (67) Li, Y.-R., Wang, J.-M., Ho, L. C., Du, P., & Bai, J.-M. 2013, ApJ, 779, 110
- (68) MacKenty, J. W. 1990, ApJS, 72, 231
- (69) Magorrian, J., Tremaine, S., Richstone, D., et al. 1998, AJ, 115, 2285
- (70) McConnell, N. J., & Ma, C.-P. 2013, ApJ, 764, 184
- (71) McConnell, N. J., Ma, C.-P., Gebhardt, K., et al. 2011, Nature, 480, 215
- (72) McLeod, K. K., & McLeod, B. A. 2001, ApJ, 546, 782
- (73) McLure, R. J., & Dunlop, J. S. 2004, MNRAS, 352, 1390
- (74) Mullaney, J. R., Pannella, M., Daddi, E., et al. 2012, MNRAS, 419, 95
- (75) Negrete, C. A., Dultzin, D., Marziani, P., & Sulentic, J. 2013, ApJ, 771, 31
- (76) Nelson, C. H., Green, R. F., Bower, G., Gebhardt, K., & Weistrop, D. 2004, ApJ, 615, 652
- (77) Nelson, C. H., & Whittle, M. 1995, ApJS, 99, 67
- (78) Ohta, K., Aoki, K., Kawaguchi, T., & Kiuchi, G. 2007, ApJS, 169, 1
- (79) Onken, C. A., Ferrarese, L., Merritt, D., et al. 2004, ApJ, 615, 645
- (80) Onken, C. A., Valluri, M., Peterson, B. M., et al. 2007, ApJ, 670, 105
- (81) Orban de Xivry, G., Davies, R., Schartmann, M., et al. 2011, MNRAS, 417, 2721
- (82) Osterbrock, D. E., & Pogge, R. W. 1985, ApJ, 297, 166
- (83) Owen, F. N., & Laing, R. A. 1989, MNRAS, 238, 357
- (84) Pancoast, A., Brewer, B. J., Treu, T., et al. 2012, ApJ, 754, 49
- (85) Park, D., Kelly, B. C., Woo, J.-H., & Treu, T. 2012a, ApJS, 203, 6
- (86) Park, D., Woo, J.-H., Treu, T., et al. 2012b, ApJ, 747, 30
- (87) Peterson, B. M. 1993, PASP, 105, 247
- (88) Peterson, B. M., Ferrarese, L., Gilbert, K. M., et al. 2004, ApJ, 613, 682
- (89) Press, W. H., Teukolsky, S. A., Vetterling, W. T., & Flannery, B. P. 1992, Numerical Recipes in C: The Art of Scientific Computing (2nd ed.; Cambridge: Cambridge Univ. Press)
- (90) Schade, D. J., Boyle, B. J., & Letawsky, M. 2000, MNRAS, 315, 498
- (91) Schmitt, H. R., & Kinney, A. L. 2000, ApJS, 128, 479
- (92) Sergeev, S. G., Pronik, V. I., Sergeeva, E. A., & Malkov, Yu. F. 1999, AJ, 118, 2658
- (93) Sérsic, J. L. 1968, Atlas de Galaxias Australes (Córdoba: Obs. Astron., Univ. Nac. Córdoba)
- (94) Shi, Y., Rieke, G. H., Ogle, P., Jiang, L., & Diamond-Stanic, A. M. 2009, ApJ, 703, 1107
- (95) Simien, F., & de Vaucouleurs, G. 1986, ApJ, 302, 564
- (96) Sincell, M. W., & Krolik, J. H. 1998, ApJ, 496, 737
- (97) Slavcheva-Mihova, L., & Mihov, B. 2011, A&A, 526, A43
- (98) Sluse, D., Hutsemékers, D., Courbin, F., Meylan, G., & Wambsganss, J. 2012, A&A, 544, A62
- (99) Sun, W.-H., & Malkan, M. A. 1989, ApJ, 346, 68
- (100) Surace, J. A., Sanders, D. B., & Evans, A. S. 2001, AJ, 122, 2791
- (101) Tremaine, S., Gebhardt, K., Bender, R., et al. 2002, ApJ, 574, 740
- (102) Vanden Berk, D. E., Richards, G. T., Bauer, A., et al. 2001, AJ, 122, 549
- (103) Veilleux, S., Kim, D.-C., Rupke, D. S. N., et al. 2009, ApJ, 701, 587
- (104) Virani, S., De Robertis, M. M., & VanDalfsen, M. L. 2000, AJ, 120, 1739
- (105) Wandel, A., Peterson, B. M., & Malkan, M. A. 1999, ApJ, 526, 579
- (106) Watson, L. C., Martini, P., Dasyra, K. M., et al. 2008, ApJ, 682, L21
- (107) Wilson, A. S., Helfer, T. T., Haniff, C. A., & Ward, M. J. 1991, ApJ, 381, 79
- (108) Woo, J.-H., Schulze, A., Park, D., et al. 2013, ApJ, 772, 49
- (109) Woo, J.-H., Treu, T., Barth, A. J., et al. 2010, ApJ, 716, 269
- (110) Xanthopoulos, E. 1996, MNRAS, 280, 6
- (111) Xiao, T., Barth, A. J., Greene, J. E., et al. 2011, ApJ, 739, 28
- (112) York, D. G., Adelman, J., Anderson Jr., J. E., et al. 2000, AJ, 120, 1579
- (113) Zu, Y., Kochanek, C. S., & Peterson, B. M. 2011, ApJ, 735, 80
Appendix A Notes on Individual Objects
This section gives comments on the morphological characteristics of individual sources that are pertinent to classification of their bulge type.
3C 120 — This Fanaroff-Riley (1974) class I radio galaxy (Owen & Laing 1989) is classified as an S0 in the Third Reference Catalogue of Bright Galaxies (RC3; de Vaucouleurs et al. 1991) and in Slavcheva-Mihova & Mihov (2011), based on ground-based CCD images. Analysis of an HST ACS/HRC F550M image by Bentz et al. (2009a) shows that the bulge has a modest luminosity fraction of only and a low Sérsic index of . Unfortunately, neither result is unambiguous. An independent study by K14, using an ACS/HRC F702W image, yields a consistent value of , but a single-component model (i.e. ) cannot be excluded; the Sérsic index could not be well constrained and was fixed to . Bennert et al. (2010) also conclude that . 3C 120 is either an elliptical or a classical bulge, and, for concreteness, we choose the former.
3C 390.3 — As in Bennert et al. (2010), K14 describe this Fanaroff-Riley class II radio galaxy (Laing et al. 1983) as an elliptical, consistent with . Bentz et al. (2009a) conclude that a disk component is present (), although they also find a large Sérsic index of . For concreteness, we assign a classification of elliptical.
Ark 120 — Ground-based morphological classifications of Ark 120 are uncertain, ranging from “S?” in RC3, “Sb pec” in Chatzichristou (2000), and E in Hyperleda. Xanthopoulous (1996) finds from decomposition of an -band image. All extant studies based on HST images agree that the galaxy contains a substantial disk component, with ranging from (K14), to 0.35 (Bennert et al. 2010), to 0.49 (Bentz et al. 2009a). The relatively large , coupled with (Bentz et al. 2009a; K14) suggests that Ark 120 has a classical bulge.
Arp 151 — Any formal classification of this object is made uncertain by the fact that the galaxy is stretched into a long tidal feature (Bentz et al. 2013; K14). Although the bulge light accounts for only % of the total light, the bulge component formally has a fairly large Sérsic index of (K14). We classify the bulge as classical.
Fairall 9 — Kotilainen et al. (1993) obtain from -band imaging with 127 seeing. Using HST photometry, Bentz et al. (2009a) and K14 also find the galaxy to be bulge-dominated, with and , respectively; both find a large Sérsic index, . We classify the bulge as classical.
Mrk 50 — All ground-based studies concur that Mrk 50 is bulge-dominated (McKenty 1990; Koss et al. 2011), in agreement with the visual appearance of its Sloan Digital Sky Survey (SDSS; York et al. 2000) image. K14 obtain a good fit with and . We classify the bulge as classical.
Mrk 79 — A bar is prominently visible in large-scale, ground-based optical images (MacKenty 1990; Schmitt & Kinney 2000; SDSS), and RC3 classifies the galaxy as an SBb. Bennert et al. (2010) derive from decomposition of an HST image; somewhat lower values are found by Bentz et al. (2009a; ) and K14 (), both of whom agree that . In view of the relatively large value of , we classify the bulge as classical.
Mrk 202 — Although suspected to be an elliptical in HyperLeda, the SDSS image suggests that Mrk 202 is more likely a nearly face-on early-type disk galaxy. No obvious large-scale spiral arms are visible in the WFC3 F547M image of Bentz et al. (2013); instead, the central region contains a prominent circumnuclear ring. Excluding the circumnuclear ring, the bulge accounts for 35% of the total light of the host. The Sérsic index of the bulge is model-dependent and somewhat uncertain, lying in the range . We tentatively classify Mrk 202 as hosting a pseudobulge.
Mrk 509 — Motivated by the detection of a 4–5 kpc diameter ring-like feature, K14 fit the PC F547M image of Mrk 509 using a two-component, bulge plus disk model. The best fit formally yields , but it is highly unreliable because the bulge is barely resolved ( = 013010), very faint relative to the nucleus (by mag), and suspiciously low in luminosity ( ) for its BH mass of . The Sérsic index could not be independently constrained and was fixed to . By contrast, Bentz et al. (2009a) conclude that , although their best fit indicates that . Evidence for an E-like morphology also comes from the ground-based work of MacKenty (1990) and Fischer et al. (2006). We agree with Bentz et al. and classify Mrk 509 as an elliptical.
Mrk 590 — Images at ground-based resolution indicate that Mrk 590 is a bulge-dominated, early-type (Sa) spiral (MacKenty 1990; Kotilainen et al. 1993; Xanthopoulous 1996; SDSS). HST-based decompositions yield more modest bulge fractions, from (; Bentz et al. 2009a) to ( fixed to 4; Bennert et al. 2010). K14 quote and . The near-exponential profile of the bulge formally designates it as a pseudobulge.
Mrk 1310 — With the Sérsic index fixed to , Schade et al. (2000) derive and, using the same WFPC2 F814W image, K14 find . Very faint spiral arms can be seen in the residual image of K14. Bentz et al. (2013) analyze a higher-resolution ACS/HRC F547M image and find and . In light of the large Sérsic index and relatively large , we classify the bulge of Mrk 1310 as classical.
NGC 3227 — Classified as SAB(s)a in the RC3, Kormendy & Ho regard NGC 3227 as having a pseudobulge because of the evidence of circumnuclear star formation (Davies et al. 2006). They obtain a low value of in the band, consistent with the value of based on the -band decomposition of Virani et al. (2000). Interestingly, the bulge is significantly more prominent in HST-based decompositions. Bentz et al. (2009a) use an ACS/HRC F550M image to find and , while K14’s analysis of an ACS/HRC F606W image finds and . The large discrepancy between the HST and ground-based results most likely stems from the small field-of-view (FOV = 29′′26′′) of the ACS/HRC images, which only cover the central region of this large galaxy ( = 39). We tentatively follow Kormendy & Ho and classify the bulge as a pseudobulge, and we adopt their ground-based -band bulge luminosity and convert it to the band assuming = 2.37 [from (Kormendy & Ho 2013) and (Fukugita et al. 1995)].
NGC 3516 — Classified as (R)SB(s)0 in the RC3, NGC 3516 has according to the -band ground-based decomposition of Virani et al. (2000). Bentz et al. (2009a) obtain and from analysis of an ACS/HRC F550M image and ground-based images; K14’s analysis of a WFPC2 F814W image finds and . The near-exponential profile of the bulge formally designates it as a pseudobulge.
NGC 3783 — As with NGC 3227, the HST decomposition of NGC 3783 [RC3 type (R′)SB(r)ab; = 21] is highly unreliable because of the small FOV of the ACS/HRC. Bentz et al. (2009a) and K14 analyze the same F550M image. While both studies agree that is low (), the bulge luminosities are highly discrepant: Bentz et al. (2009a) get , while K14 quote . The low Sérsic index formally designates it as a pseudobulge.
NGC 4051 — As with NGC 3227, the HST decomposition of NGC 4051 [RC3 type SAB(rs)bc; = 49] is also highly unreliable because of the small ACS/HRC field. The decompositions of Bentz et al. (2009a) and K14 are in relatively good agreement, both finding and . The ground-based decomposition of Virani et al. (2010) requires a bulge only 25% as luminous, suggesting that the HST-based bulge luminosity may be biased too high as a result of the small FOV of the HRC. [Note, however, that Bentz et al. (2009a) did incorporate a larger FOV ground-based image into their fit.] If the Sérsic index can be trusted, its low value formally designates NGC 4051 as having a pseudobulge.
NGC 4151 — The main bulge component of NGC 4151 accounts for 60% of the total host galaxy light in the ACS/HRC F550M filter, but the formal Sérsic index is only (Bentz et al. 2009a). Bentz et al. introduce an additional inner bulge component that seems to make up another 15% of the light; their fit includes large-FOV ground-based data. K14 look at the same HRC data and conclude that the Sérsic index could not be fit reliably independently; fixing , they derive . With = 29, it is likely that this (R′)SAB(rs)ab galaxy cannot be reliably fit using the small-FOV HRC image alone. The ground-based -band decomposition of Virani et al. (2000) gives . Despite these uncertainties, it seems clear that NGC 4151 is a fairly bulge-dominated system, and thus that it probably has a classical bulge.
NGC 4253 — K14 obtain a reliable decomposition of NGC 4253 (Mrk 766) using the full mosaic of WFPC2 in F606W: and . These parameters are in good agreement with the results of Orban de Xivry et al. (2011), who, using the same dataset, find and . They are also consistent with the analysis of Bentz et al. (2013) based on WFC3 F547M: and (their “simple” model). In view of the low and , we classify the bulge of NGC 4253 as a pseudobulge.
NGC 4593 — Bentz et al. (2009a) derive and from modeling an HRC F550M image in combination with a larger FOV ground-based image. The ground-based image is crucial because Mrk 1330 is large ( = 24). The same HRC dataset, analyzed by K14 without the aid of ground-based imaging, yields vastly different parameters for the bulge (; . We adopt the results of Bentz et al. (2009a), and given that the Sérsic index is formally, albeit marginally, less than 2, we classify the bulge as a pseudobulge.
NGC 4748 — The decomposition of this interacting early-type spiral is very complicated because it contains both a bar and a star-forming nuclear ring (Deo et al. 2006; Bentz et al. 2013). Orban de Xivry et al. (2011) analyze a WFPC2 F606W image and find and = 1.93. However, the more complex model of Bentz et al. (2013), based on WFC3 F547M data, gives and (their “optimal” model). In spite of the large Sérsic index suggested by Bentz et al.’s analysis, we favor a pseudobulge classification for NGC 4748 because of its low and the presence of a nuclear ring.
NGC 5548 — The ground-based decomposition of Virani et al. (2000) yields in the band. This is consistent with the work of Bentz et al. (2009a), who, combining ground-based and HRC F550M data, report and . K14 analyze the same HRC dataset but find and ; the parameters of this component agree quite well with those of the “inner bulge” component in Bentz et al. (2009a). However, the latter authors detect an additional, larger component with 2.3 times the flux that they also attribute to the “bulge”. In spite of the uncertainty on , the large strongly suggests that NGC 5548 contains a classical bulge. We adopt , the sum of the “bulge” and “inner bulge” components given in Bentz et al. (2009a).
NGC 6814 — The ground-based decomposition of Virani et al. (2000) yields in the band. Bentz et al. (2013) model a WFC3 F550M image with two bulge components, a bar, and a disk. The two bulge components were fit with a Sérsic index of and 1.2, respectively, and they both account for % of the total host galaxy light. In view of the low values of and , we classify NGC 6814 as having a pseudobulge.
NGC 7469 — This (R′)SAB(rs)a galaxy contains a well-known starburst circumnuclear ring (e.g., Wilson et al. 1991; Deo et al. 2006). This characteristic, in conjunction with the fairly low Sérsic index of found by Bentz et al. (2009a), suggests that the galaxy contains a pseudobulge, even though the bulge is quite prominent ().
PG 0003+199 — All extant HST-based decompositions find that PG 0003+199 (Mrk 335) is best fit with a bulge and disk with (Bentz et al. 2009a; Bennert et al. 2010), although K14 note that a single-component fit is also acceptable. The host galaxy, whatever its form, is quite featureless (Crenshaw et al. 2003; K14). The bulge component appears to have a fairly large, if poorly determined, Sérsic index. We adopt K14’s parameters, and , and we classify the bulge as a classical bulge.
PG 0026+129 — All high-resolution studies agree that PG 0026+129 is hosted by an elliptical galaxy (McLeod & McLeod 2001; Guyon et al. 2006; Bentz et al. 2009a; Veilleux et al. 2009; K14). Bentz et al. (2009a) find a best-fitting Sérsic index of , but K14 could not reliably constrain it and fix it to . In any case, the status of the host as an elliptical is not in doubt.
PG 0052+251 — This quasar has nearby neighbors and evident spiral structure (Dunlop et al. 2003; K14). Single-component models for the host galaxy (e.g., Bennert et al. 2010) are thus disfavored. Bentz et al. (2009a) obtain and (HRC F550M). K14 conclude that the Sérsic index cannot be well constrained; fixing , they find (WF2 chips, F675W). This is in excellent agreement with derived by Dunlop et al. (2003) in the band. We classify the bulge as classical.
PG 0804+761 — Guyon et al. (2006) observed this source with ground-based near-infrared imaging assisted by adaptive optics. They find the host to be strongly bulge-dominated: and 0.68 in the and band, respectively. The three HST studies of Bentz et al. (2009a), Bennert et al. (2010), and K14 all agree that the host is an elliptical (), although curiously the host seems to have an exponential profile ().
PG 0844+349 — As with PG 0052+251, PG 0844+349 contains very complex spiral structure (Hutchings & Crampton 1990; Guyon et al. 2006; Veilleux et al. 2009), which is visible even in SDSS. Thus, an elliptical galaxy model (Bennert et al. 2010) is inappropriate. Bentz et al. (2009a) use an HRC F550M image to derive and ; K14 analyze the same data and find, fixing to 4, , consistent with obtained from adaptive optics-based -band observations (Guyon et al. 2006). We classify the bulge as classical.
PG 0921+525 — Both Bentz et al. (2009a) and Bennert et al. (2010) fit the host with a two-component model, finding that and 0.31, respectively. The relatively low bulge fraction and low Sérsic index () led Bentz et al. to conclude that the host has a morphological type Sc. However, no spiral structure is visible. While a two-component model is acceptable, K14 obtained a good fit of the host with a single component with fixed to 4. We tentatively conclude that PG 0921+525 is an elliptical.
PG 0953+414 — All recent high-resolution studies agree that the host is an elliptical (Dunlop et al. 2003; Kim et al. 2008a; Bentz et al. 2009a), or at least a strongly bulge-dominated (Guyon et al. 2006), galaxy. Bentz et al. (2009a) find a surprisingly low Sérsic index of . K14 conclude from their decomposition that the Sérsic index is difficult to constrain robustly. The residual image from K14 shows evidence for a shell-like structure reminiscent of a tidal feature.
PG 1022+519 — Also known as Mrk 142, this system has a very strong bar that clearly shows up even in ground-based images (Ohta et al. 2007; SDSS). Its bulge, if present at all, is undetectable in the WFC3 F550W image of Bentz et al. (2013). These authors further note that this object has a poorly determined RM lag. We thus exclude it from our final analysis.
PG 1211+143 — Both Bentz et al. (2009a) and Bennert et al. (2010) analyze an ACS/HRC F550M image and conclude that , with the former further noting that . K14 study an ACS/WFC F625W image and find a consistently large bulge () but a significantly larger Sérsic index (). We classify the bulge as classical.
PG 1226+023 — This well-studied quasar, 3C 273, is without a doubt hosted by an elliptical (Bentz et al. 2009a; Bennert et al. 2010; K14).
PG 1229+204 — The host appears to be barred (Surace et al. 2001) and may contain a faint tidal tail (K14) and other signs of asymmetries (Veilleux et al. 2009). The galaxy has a modest bulge, with and (Bentz et al. 2009a; Bennert et al. 2010; K14). We classify the bulge as a pseudobulge.
PG 1307+085 — The host is symmetric and featureless (Veilleux et al. 2009) and well fit with a single-component E-like model (Bentz et al. 2009a; K14).
PG 1351+695 — The galaxy, also known as Mrk 279, has a modest bulge with and (Bentz et al. 2009a; Bennert et al. 2010; Orban de Xivry et al. 2011; K14). Faint spiral features are visible in the residual map of K14. We classify the bulge as a pseudobulge.
PG 1411+442 — Both Bentz et al. (2009a) and Bennert et al. (2010) fit the host with a single-component, E-like model. This model, however, is inappropriate, as PG 1411+442 is clearly a highly distorted spiral galaxy (Guyon et al. 2006; Veilleux et al. 2009) with an extended tidal loop (Surace et al. 2001) and nearby companions (K14). K14’s analysis of an ACS/WFC F606W image finds ; the Sérsic index could not be well constrained and was fixed to . Guyon et al. (2006) find and 0.96 for the and band, respectively. In light of the relatively large , we classify the bulge as classical.
PG 1426+015 — The overall morphology of the host is strongly disturbed and asymmetric (Guyon et al. 2006; Veilleux et al. 2009; SDSS), rendering any detailed decomposition somewhat difficult to interpret. While the global profile is consistent with a single, E-like component (Guyon et al. 2006; Bentz et al. 2009a), a bulge+disk decomposition is also acceptable. Assuming , Schade et al. (2000) obtain in F814W, while K14, analyzing the same data, find and . We believe that the “disk” component is actually tidally distorted material drawn from the main body of an elliptical host.
PG 1434+590 — The host, also known as Mrk 817, shows a clear bar and spiral arms (Crenshaw et al. 2003; Deo et al. 2006). The bulge is tiny, comprising only % to 10% of the total light of the host (Bentz et al. 2009a; Bennert et al. 2010; K14). Bentz et al. (2009a) quote a Sérsic index of , but K14 find a much smaller value of . Despite this inherent uncertainty, it seems safe to conclude that the host contains a pseudobulge.
PG 1534+580 — The host galaxy of Mrk 290 is quite featureless at HST resolution (Deo et al. 2006), but, with the sole exception of Bennert et al. (2011), most studies conclude that the best-fitting model for the host requires a bulge and a disk component. Published fits include those of Orban de Xivry et al. (2011; , ), Bentz et al. (2013; , ), and K14 (, ). We adopt the parameters of K14 and classify the bulge as classical.
PG 1613+658 — The host galaxy of this infrared-excess quasar (Mrk 876) is a highly asymmetric, advanced merger remnant (McLeod & McLeod 2001; Surace et al. 2001; Guyon et al. 2006; Kim et al. 2008a) with two visible nuclei (K14). Despite the significant residuals that remain, the azimuthally average global profile of the system is consistent with that of a giant elliptical galaxy (Guyon et al. 2006; Bentz et al. 2009a). As in PG 1426+015, it seems likely that the tidal features will eventually relax and be incorporated into the main body of the remnant. Thus, despite the fact that K14 formally find , we classify the host as an elliptical.
PG 1617+175 — The overall structure of the host is consistent with that of a relatively smooth elliptical (Guyon et al. 2006; Kim et al. 2008a; Bentz et al. 2009a; Veilleux et al. 2009; K14).
PG 1700+518 — The overall structure of the host is consistent with that of a highly disturbed elliptical or at least a strongly bulge-dominated system (Guyon et al. 2006; Kim et al. 2008a; Bentz et al. 2009a; Veilleux et al. 2009; Bennert et al. 2010; K14). We classify the host as an elliptical or as having a classical bulge.
PG 2130+099 — This moderately inclined spiral has an outer ring (Slavcheva-Mihova & Mihov 2011) and an asymmetric outer disk (K14). Published bulge-to-disk decompositions span (Guyon et al. 2006; Kim et al. 2008a; Bentz et al. 2009a; Bennert et al. 2010; K14). The Sérsic index of the bulge appears to be very low, (Bentz et al. 2009a; K14). We adopt the parameters from K14 and classify the bulge as a pseudobulge. Bentz et al. (2013) note that the RM lag for this source may be unreliable; we flag this object in our analysis.
SBS 1116+583A — Bentz et al. (2013) fit this barred spiral with a model consisting of a small bulge, bar, lens, and exponential disk. In their optimal model, and . We classify the bulge as a pseudobulge.