Supernova SN 2012dn: A spectroscopic clone of SN 2006gz
Abstract
We present optical and UV analysis of the luminous type Ia supernova SN 2012dn covering the period 11 to +109 days with respect to the band maximum, that occurred on JD 2456132.89 0.19, with an apparent magnitude of = 14.38 0.02. The absolute magnitudes at maximum in and bands are and , respectively. SN 2012dn is marginally luminous compared to normal type Ia supernovae. The peak bolometric luminosity of erg s-1 suggests that M⊙ of 56Ni was synthesized in the explosion. The decline rate mag is lower than that of normal type Ia supernovae, and similar to the luminous SN 1991T. However, the photometric and spectroscopic behaviour of SN 2012dn is different from that of SN 1991T. Early phase light curves in and bands are very broad. The band peak has a plateau-like appearance similar to the super-Chandra SN 2009dc. Pre-maximum spectra show clear evidence of C ii 6580 Å line, indicating the presence of unburned materials. The velocity evolution of C ii line is peculiar. Except for the very early phase (13 d), the C ii line velocity is lower than the velocity estimated using the Si ii line. During the pre-maximum and close to maximum phase, to reproduce observed shape of the spectra, the synthetic spectrum code syn++ needs significantly higher blackbody temperature than those required for normal type Ia events. The photospheric velocity evolution and other spectral properties are similar to those of the carbon-rich SN 2006gz.
keywords:
supernovae: general – supernovae: individual: SN 2012dn – galaxies: individual: ESO 462-16 – techniques: photometric – techniques: spectroscopic1 Introduction
Type Ia supernovae (SNe Ia), characterized by the presence of the Si ii 6355 Å absorption feature, are believed to be thermonuclear explosions of carbon/oxygen (C/O) white dwarf (WD) either accreting matter from its companion in a binary system, or merging with another white dwarf (Hillebrandt & Niemeyer, 2000; Leibundgut, 2000; Filippenko, 1997). A majority of these objects, known as ‘normal’ type Ia SNe, (Branch et al., 2006) form a remarkably homogeneous class with similar light curve shape and spectral evolution. The high and uniform peak luminosity makes them powerful distance indicators. SNe Ia have been used to measure the cosmic expansion history, leading to the discovery of accelerating universe and existence of dark energy (Riess et al., 1998; Perlmutter et al., 1999). The key fact behind this is that the light curves of normal SNe Ia can be normalized to a common light curve using empirical relations between light curve width and peak luminosity (Phillips, 1993; Riess, Press & Kirshner, 1996; Perlmutter et al., 1997; Phillips et al., 1999; Goldhaber et al., 2001).
The observed homogeneity in SNe Ia is linked with the commonly accepted theory that the explosion of WD occurs at a mass close to the Chandrasekhar mass limit (Chandrasekhar, 1931) of 1.4 M⊙. However, the detailed explosion mechanism and the nature of progenitors are still under investigation. With the availability of good quality data of SNe Ia in the recent years, deviation from the observed homogeneity, and the occurrence of peculiar and exceptional events is quite evident. A recent study by Li et al. (2011) has revealed that a majority of SNe Ia ( 70%) belong to a fairly homogeneous class – ‘normal’ type Ia, while 9% are overluminous – SN 1991T-like events (Filippenko et al., 1992a; Phillips et al., 1992), 15% are underluminous – 1991bg-like events (Filippenko et al., 1992b; Leibundgut et al., 1993) and 5% are peculiar – SN 2002cx-like events (Jha et al., 2006; Sahu et al., 2008; Foley et al., 2013).
The discovery of the extremely luminous type Ia supernova SN 2003fg (SNLS-03D3bb: Howell et al., 2006) and the subsequent discoveries of SN 2006gz, SN 2007if and SN 2009dc challenge the existing theory of type Ia SN explosion of Chandrasekhar mass WD (Hicken et al., 2007; Yamanaka et al., 2009; Scalzo et al., 2010; Silverman et al., 2011; Taubenberger et al., 2011, and references therein). Assuming the luminosity of SNe Ia is powered by radioactive decay of 56Ni synthesized in the explosion, the mass of 56Ni required to produce the observed luminosity of this class of objects exceeds 1 M⊙. Within the spherically symmetric explosion scenario, the existing models of SN Ia explosion of Chandrasekhar mass WD cannot produce the required 56Ni. The inferred mass of 56Ni can be produced only with a progenitor more massive than a Chandrasekhar mass WD. Hence, these extremely luminous type Ia SNe have been termed as ‘super-Chandrasekhar-mass’, or ‘super-Chandra’ type Ia. They have very bright peak at maximum 20 mag and the early post-maximum decline is very slow. Apart from moderately low ejecta velocity and presence of unburned carbon, the near-maximum spectra of these objects are similar to those of normal SNe Ia. At nebular phase these SNe exhibit a photometric and spectroscopic behaviour diverse from normal SNe Ia. They show enhanced fading in the light-curve with a possible break at 150–200 d, and very weak/absence of [Fe iii] emission in their nebular spectra (Maeda et al., 2009; Taubenberger et al., 2013). The luminous and broad light curves of the super-Chandra SNe do not follow the Phillips luminosity-decline relation (Phillips, 1993; Phillips et al., 1999) and may lead to wrong conclusions if included in cosmological studies (Taubenberger et al., 2011).
To explain the observed properties of different classes of SNe Ia, a variety of theoretical models, incorporating both single-degenerate (SD), and double-degenerate (DD) progenitors, with their masses ranging from sub-Chandrasekhar to super-Chandrasekhar, and propagation of the thermonuclear burning front via deflagration (subsonic) to detonation (supersonic) have been proposed (Howell, 2011, and references therein). Detonation models produce mostly Iron Group Elements (IGEs), while deflagration models produce both Intermediate Mass Elements (IMEs) and IGEs, consistent with the observed spectra of SNe Ia. Deflagration models leave most of the materials unburned, and are unable to produce high velocity features. The delayed detonation model (Khokhlov et al., 1991; Gamezo, Khokhlov & Oran, 2005), in which a deflagration to detonation transition occurs at some stage of the thermonuclear explosion, is however, successful in reproducing the observed characteristics of SNe Ia. Models incorporating broken symmetries (Kasen, Röpke & Woosley, 2009) and asymmetric explosion (Maeda & Iwamoto, 2009; Maeda et al., 2010) have also been proposed to account for the observed diversity among SNe Ia.
In a sample of 29 objects, Hamuy et al. (1996) found that most of the luminous SNe Ia were found in galaxies with young stellar environments. With a larger sample of SNe Ia, Sullivan et al. (2010) have shown that their light curve width closely tracks the specific star formation rate (sSFR) and stellar mass of the host galaxies – massive and/or low sSFR galaxies host SNe with lower stretches (narrow light curves or higher ). Super-Chandra SNe Ia are also suggested to occur preferentially in young stellar and low metallicity environments (Taubenberger et al., 2011; Khan et al., 2011). Differential rotation and merging mechanisms may play key roles in increasing the progenitor mass suitable for these objects. A rotating WD can support more mass than the classical Chandrasekhar mass limit of non rotating WD, with differentially rotating WDs being more massive than the rigidly rotating WDs (Yoon & Langer, 2005).
In this paper, we present optical and UV data of the luminous type Ia supernova SN 2012dn observed with 2-m Himalayan Chandra Telescope (HCT), Hanle and Swift UVOT. Section 2 describes the observation and data reduction techniques. Photometric and spectroscopic results are presented in Section 3 and 4. We discuss and summarize the paper in Section 5.
2 Observation and Data reduction
| SN 2012dn | Ref. | |
| (J2000) | 202336.26 | 1 |
| (J2000) | 28∘16′43′′.40 | 1 |
| SN offset from galaxy nucleus | 35′′ W, 3′′ S | 1 |
| SN type | Ia | 1 |
| 0.12 | 2 | |
| 0.06 | 3 | |
| Discovery date (UT) | 2012 July 08.52 | 1 |
| Discovery JD | 2456116.52 | 1 |
| Discovery magnitude | 16.3 | 1 |
| JD | 2456132.89 | 2 |
| 0.92 | 2 | |
| 14.38 | 2 | |
| () | 19.52 | 2 |
| Mass of 56Ni | 0.82 M⊙ | 2 |
| ESO 462-16 | ||
| PGC name | PGC 64605 | 3 |
| Galaxy type | SA(s)cd | 3 |
| (J2000) | 202338.9 | 3 |
| (J2000) | 28∘16′40′′ | 3 |
| Redshift (z) | 0.010 | 3 |
| Extn. Corr. app. B mag. | 13.05 | 4 |
| Absolute B mag () | 20.10 | 4,5 |
| Diameter | 1.7′ 1.2′ | 3 |
| 3070 km s-1 | 3 | |
| 33.15 | 5 | |
| 0.06 | 3 | |
|
Ref.: 1. Bock et al. (2012); 2. this paper
3. NED (http://nedwww.ipac.caltech.edu) 4. LEDA (http://leda.univ-lyon1.fr) 5. using = 72 km s-1 Mpc-1 on |
||
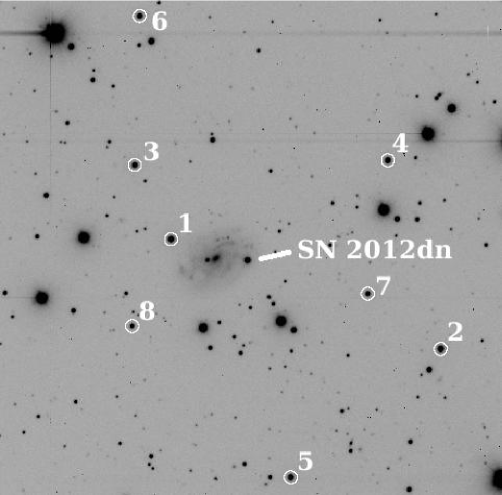
SN 2012dn (PSN J20233626-2816434) was discovered by Stuart Parker on 2012 July 08.52 (UT) at a red magnitude of 16.3 in the SA(s)cd type galaxy ESO 462-G16 (PGC 64605), at a redshift of = 0.010 (Theureau et al., 1998, source NED). The supernova was located (Fig. 1) at = 202336.26 (J2000) and = 28∘16′43′′.40 (J2000), 35′′ west and 3′′ south of the nucleus of the host galaxy (Bock, Parrent & Howell, 2012). Based on a spectrum obtained on July 10.2 (UT) with the 8-m Gemini South Telescope, Parrent & Howell (2012) classified it as a type Ia supernova, approximately a week before maximum light. The blueshift of the Si ii absorption minimum was measured as 12000 km s-1. A strong C ii 6578 Å absorption feature, blueshifted by 12200 km s-1 was detected in the spectrum. Based on the similarity of the spectrum of SN 2012dn with the pre-maximum spectra of SN 2006gz (Hicken et al., 2007), SN 2007if (Scalzo et al., 2010) and SN 2009dc (Yamanaka et al., 2009), it was suggested to be a possible super-Chandra event (Parrent & Howell, 2012). Analyzing the spectrum obtained on July 11.5 (UT) with the 2-m telescope of University of Hawaii, Copin et al. (2012) confirmed it to be a peculiar type Ia event, similar to SN 2009dc around 10 d before peak brightness. The velocity and spectral slopes were found to be very similar to SN 2006gz at a similar epoch. Some basic information of SN 2012dn and its host galaxy ESO 462-G16 are listed in Table 1.
2.1 Photometry
2.1.1 Optical Photometry using 2-m HCT
Observations of SN 2012dn were carried out using the Himalaya Faint Object Spectrograph Camera (HFOSC) mounted on the 2-m Himalayan Chandra Telescope (HCT) of the Indian Astronomical Observatory (IAO111www.iiap.res.in/centers/iao), Hanle, India. HFOSC is equipped with a 2K 4K pixels, SITe CCD chip. The central 2K 2K pixels of the chip was used for imaging, which corresponds to a field of view of 10 10 arcmin2 at an image scale of 0.296 arcsec pixel-1. The gain and readout noise of the CCD camera are 1.22 electrons ADU-1 and 4.87 electrons, respectively. Photometric monitoring of SN 2012dn in the Bessell’s , , , and filters, available with the HFOSC began on 2012 July 12 (JD 2456121.28), shortly after discovery. The observations were continued till 2012 November 10 (JD 2456242.05), until the supernova went behind the Sun. Photometric standard star fields from Landolt (Landolt, 1992) were observed during photometric nights on 2012 July 16, 23 and October 13 for calibration of a sequence of secondary standard stars in the field of SN 2012dn. Several bias images were taken on each night during the observation. Flat-field sky images in the bands were obtained during evening and morning twilight hours.
The data were processed in the standard manner, using various tasks available within the Image Reduction and Analysis Facility (iraf222iraf is distributed by the National Optical Astronomy Observatories, which are operated by the Association of Universities for Research in Astronomy, Inc., under cooperative agreement with the National Science Foundation) software package. The data were bias corrected with a master bias frame, which is median of all the bias frames taken throughout the night. Median combined normalized flat-field images of the twilight sky were used for flat field corrections. After this, cosmic ray hits were removed.
| ID | U | B | V | R | I |
|---|---|---|---|---|---|
| 1 | 15.039 0.007 | 14.949 0.017 | 14.313 0.014 | 13.982 0.011 | 13.578 0.005 |
| 2 | 15.092 0.007 | 15.031 0.023 | 14.433 0.015 | 14.110 0.011 | 13.711 0.007 |
| 3 | 16.431 0.008 | 15.674 0.010 | 14.779 0.018 | 14.310 0.011 | 13.809 0.011 |
| 4 | 17.766 0.014 | 16.371 0.023 | 15.088 0.008 | 14.339 0.011 | 13.614 0.011 |
| 5 | 16.995 0.016 | 15.970 0.023 | 14.957 0.019 | 14.455 0.012 | 13.948 0.005 |
| 6 | 16.160 0.008 | 15.785 0.014 | 14.930 0.016 | 14.484 0.004 | 13.926 0.022 |
| 7 | 15.610 0.021 | 15.692 0.023 | 15.229 0.024 | 14.978 0.006 | 14.630 0.021 |
| 8 | 16.173 0.012 | 16.280 0.017 | 15.757 0.015 | 15.467 0.010 | 15.116 0.010 |
| Date | J.D. | Phase* | U | B | V | R | I |
|---|---|---|---|---|---|---|---|
| (days) | |||||||
| 12/07/2012 | 2456121.28 | 11.61 | 14.863 0.030 | 15.447 0.013 | 15.378 0.011 | 15.271 0.006 | 15.182 0.028 |
| 14/07/2012 | 2456123.30 | 09.59 | 14.383 0.038 | 15.021 0.024 | 14.962 0.011 | 14.892 0.026 | 14.835 0.027 |
| 16/07/2012 | 2456125.28 | 07.61 | 14.257 0.060 | 14.747 0.008 | 14.706 0.015 | 14.667 0.016 | 14.640 0.010 |
| 17/07/2012 | 2456126.31 | 06.58 | 14.071 0.024 | 14.660 0.020 | 14.602 0.014 | 14.574 0.019 | 14.578 0.026 |
| 19/07/2012 | 2456128.30 | 04.59 | 13.969 0.033 | 14.498 0.017 | 14.443 0.020 | 14.436 0.019 | 14.438 0.026 |
| 23/07/2012 | 2456132.26 | 00.62 | 13.954 0.027 | 14.386 0.013 | 14.312 0.013 | 14.285 0.015 | 14.343 0.010 |
| 27/07/2012 | 2456136.30 | 03.41 | 14.070 0.037 | 14.429 0.010 | 14.306 0.006 | 14.248 0.013 | 14.307 0.014 |
| 29/07/2012 | 2456138.26 | 05.37 | 14.499 0.024 | 14.338 0.028 | 14.274 0.025 | 14.318 0.022 | |
| 03/08/2012 | 2456143.24 | 10.35 | 14.567 0.178 | 14.862 0.038 | 14.425 0.019 | 14.356 0.028 | 14.320 0.012 |
| 19/08/2012 | 2456159.22 | 26.33 | 16.490 0.015 | 15.202 0.007 | 14.823 0.013 | 14.397 0.021 | |
| 20/08/2012 | 2456160.16 | 27.27 | 16.598 0.028 | 15.259 0.022 | 14.843 0.011 | 14.465 0.014 | |
| 14/09/2012 | 2456185.18 | 52.29 | 17.485 0.012 | 16.199 0.015 | 15.836 0.016 | 15.359 0.009 | |
| 15/09/2012 | 2456186.13 | 53.24 | 17.465 0.044 | 17.505 0.018 | 16.257 0.010 | 15.884 0.014 | 15.398 0.015 |
| 16/09/2012 | 2456187.13 | 54.24 | 17.522 0.026 | 17.546 0.017 | 16.283 0.019 | 15.915 0.014 | 15.415 0.009 |
| 24/09/2012 | 2456195.07 | 62.18 | 17.823 0.023 | 16.573 0.019 | 16.261 0.013 | 15.794 0.024 | |
| 25/09/2012 | 2456196.06 | 63.17 | 17.849 0.047 | 17.815 0.064 | 16.596 0.018 | 16.301 0.031 | 15.864 0.035 |
| 30/09/2012 | 2456201.10 | 68.21 | 17.964 0.030 | 16.806 0.013 | 16.521 0.013 | 16.085 0.015 | |
| 01/10/2012 | 2456202.07 | 69.18 | 17.962 0.026 | 16.815 0.022 | 16.533 0.020 | 16.142 0.008 | |
| 02/10/2012 | 2456203.06 | 70.17 | 18.043 0.042 | 17.985 0.014 | 16.846 0.015 | 16.553 0.012 | 16.160 0.016 |
| 13/10/2012 | 2456214.06 | 81.17 | 18.281 0.016 | 17.306 0.011 | 17.102 0.013 | 16.704 0.017 | |
| 17/10/2012 | 2456218.04 | 85.15 | 18.422 0.014 | 17.451 0.016 | 17.256 0.017 | 16.886 0.011 | |
| 19/10/2012 | 2456220.08 | 87.20 | 18.495 0.014 | 17.540 0.012 | 17.343 0.011 | 16.987 0.017 | |
| 27/10/2012 | 2456228.04 | 95.15 | 18.687 0.028 | 17.860 0.016 | 17.707 0.016 | 17.351 0.022 | |
| 30/10/2012 | 2456231.05 | 98.16 | 18.742 0.030 | 17.939 0.020 | 17.792 0.022 | 17.474 0.016 | |
| 10/11/2012 | 2456242.05 | 109.16 | 18.968 0.074 | 18.342 0.027 | 18.200 0.021 | 17.976 0.026 | |
| * Observed phase with respect to the epoch of band maximum: JD = 2456132.89. | |||||||
Aperture photometry was performed on the standard stars with daophot package of iraf at an optimal aperture determined by the aperture growth curve. Using the bright stars in the field, an aperture correction was estimated by measuring the magnitude difference at optimal aperture and at an aperture close to full width half maximum (FWHM) of stellar profile. This correction was applied to the magnitude obtained at smaller aperture. Instrumental magnitudes obtained this way were corrected for atmospheric extinction using the average value of extinction coefficients for the site (Stalin et al., 2008). The average colour terms for the system were used to determine the photometric zero points on photometric nights. These zero points and average colour terms were then used to calibrate a sequence of secondary standards in the supernova field observed on the same nights as the standard fields. Calibrated magnitudes of the secondary standards, averaged over 3 nights are given in Table 2 and have been marked in Fig. 1. These magnitudes were used to calibrate the supernova magnitude obtained on other nights.
The magnitudes of supernova and the secondary standards in the supernova frames were obtained using point spread function (PSF) fitting technique, with a fitting radius equal to the FWHM of the stellar profile. The magnitudes of secondary standards were also estimated using aperture photometry. Magnitude difference between the aperture and profile fitting techniques was obtained using bright secondary standards. This correction was applied to the supernova magnitude. Zero-points on each night were determined using the secondary standards in the supernova field and finally supernova magnitudes were calibrated differentially with respect to the secondary standards. The final calibrated supernova magnitudes and errors in , , , and bands are listed in Table 3.
2.1.2 UV-Optical Photometry using UVOT
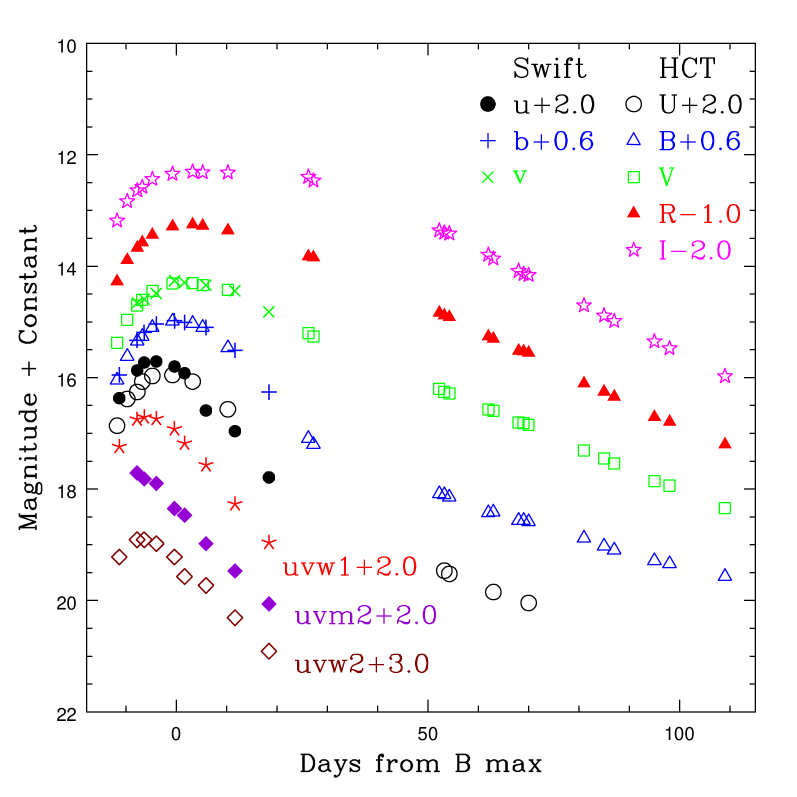
Supernova SN 2012dn was monitored with the Ultra Violet Optical Telescope (UVOT) on board the Swift satellite during 2012 July 13 (JD 2456121.57) to August 11 (JD 2456151.30). The observations were made in the 3 broad-band UV filters, ( : 1928 Å, : 2246 Å, : 2600 Å) and three broad-band optical filters ( : 3465 Å, : 4392 Å : 5468 Å). The Swift UVOT data of SN 2012dn available at Swift archive are used in this study. The data reduction was carried out using various packages in the heasoft (the High Energy Astrophysics Software) following methods of Poole et al. (2008) and Brown et al. (2009). Aperture photometry was performed using uvotsource program to extract apparent magnitude of the supernova. During the early phase when supernova was bright an aperture size of 5 arcsec was used while in the late phase smaller aperture of 3.5 arcsec was used to estimate supernova magnitude and aperture correction as listed by Poole et al. (2008) was applied. Sky in the nearby region was estimated using an aperture as was used for the supernova. The Swift UVOT magnitudes of SN 2012dn is listed in Table 4.
| Date | JD | Phase* | ||||||
|---|---|---|---|---|---|---|---|---|
| (days) | ||||||||
| 13/07/2012 | 2456121.57 | 11.32 | 16.220.06 | 15.240.05 | 14.370.04 | 15.350.04 | ||
| 16/07/2012 | 2456125.10 | 7.79 | 15.910.06 | 15.710.06 | 14.750.05 | 13.870.04 | 14.730.04 | 14.660.06 |
| 18/07/2012 | 2456126.51 | 6.38 | 15.910.05 | 15.820.05 | 14.710.05 | 13.730.04 | 14.590.04 | 14.590.05 |
| 20/07/2012 | 2456128.92 | 3.97 | 15.980.06 | 15.900.06 | 14.740.05 | 13.710.04 | 14.440.04 | 14.490.05 |
| 24/07/2012 | 2456132.53 | 0.36 | 16.220.07 | 16.350.07 | 14.920.05 | 13.800.04 | 14.380.04 | 14.260.05 |
| 26/07/2012 | 2456134.53 | 1.64 | 16.570.07 | 16.470.07 | 15.180.05 | 13.920.04 | 14.410.04 | 14.290.05 |
| 30/07/2012 | 2456138.79 | 5.90 | 16.730.06 | 16.980.12 | 15.570.05 | 14.590.04 | 14.500.04 | 14.340.04 |
| 05/08/2012 | 2456144.55 | 11.66 | 17.310.10 | 17.470.13 | 16.270.08 | 14.960.05 | 14.910.04 | 14.440.05 |
| 11/08/2012 | 2456151.30 | 18.41 | 17.910.14 | 18.060.23 | 16.960.10 | 15.790.06 | 15.660.05 | 14.820.05 |
| * Observed phase with respect to the epoch of band maximum: JD = 2456132.89. | ||||||||
2.2 Spectroscopy
Spectroscopic observations of SN 2012dn were made in Gr#7 (wavelength range 3500–7800 Å) and Gr#8 (wavelength range 5200–9250 Å) using HFOSC at a spectral resolution of 7 Å. Sixteen spectra, covering the phase 11.58 d (JD 2456121.31) to +98.18 d (JD 2456231.07) relative to the band maximum were obtained. A journal of spectroscopic observation is given in Table 5. Arc lamp spectra of FeNe (in Gr#8) and FeAr (in Gr#7) were obtained for wavelength calibration. Spectrophotometric standard stars were observed for flux calibration. Data reduction was done in the standard manner using various tasks within iraf. One-dimensional spectra were extracted using the optimal extraction method. The extracted spectra were wavelength calibrated using the arc lamp spectra. The instrumental response was removed from the wavelength calibrated spectra using spectra of spectrophotometric standard stars, preferably observed on the same night. In case of non-availability of standard star observation on a particular night, the standard stars observed during nearby nights were used. The spectra obtained in two wavelength regions were combined by scaling to a weighted mean to get the final spectrum on a relative flux scale. The spectra were then brought to an absolute flux scale by applying zero point corrections obtained from photometry. A redshift correction of z = 0.010 (adopted from NED) and total reddening correction of = 0.18 mag (refer section 3.4) were applied to the final supernova spectra. The telluric lines have not been removed from the spectra.
| Date | J.D. | Phase* | Range |
|---|---|---|---|
| days | Å | ||
| 12/07/2012 | 2456121.31 | 11.58 | 3500-7800; 5200-9250 |
| 16/07/2012 | 2456125.29 | 7.60 | 3500-7800; 5200-9250 |
| 18/07/2012 | 2456127.29 | 5.60 | 3500-7800; 5200-9250 |
| 23/07/2012 | 2456132.29 | 0.60 | 3500-7800; 5200-9250 |
| 28/07/2012 | 2456137.30 | 4.41 | 3500-7800; 5200-9250 |
| 29/07/2012 | 2456138.28 | 5.39 | 3500-7800; 5200-9250 |
| 03/08/2012 | 2456143.26 | 10.37 | 3500-7800; 5200-9250 |
| 19/08/2012 | 2456159.23 | 26.34 | 3500-7800 |
| 14/09/2012 | 2456185.21 | 52.32 | 3500-7800; 5200-9250 |
| 15/09/2012 | 2456186.18 | 53.29 | 3500-7800; 5200-9250 |
| 16/09/2012 | 2456187.15 | 54.26 | 3500-7800 |
| 24/09/2012 | 2456195.10 | 62.21 | 3500-7800; 5200-9250 |
| 01/10/2012 | 2456202.08 | 69.19 | 3500-7800; 5200-9250 |
| 13/10/2012 | 2456214.10 | 81.21 | 3500-7800; 5200-9250 |
| 19/10/2012 | 2456220.10 | 87.21 | 3500-7800; 5200-9250 |
| 30/10/2012 | 2456231.07 | 98.18 | 3500-7800; 5200-9250 |
| * Relative to the epoch of band maximum. | |||
3 Light curve analysis
3.1 Light curves and colour curves
The light curves of SN 2012dn in the , , , and bands are plotted in Fig. 2. The UVOT magnitudes are also plotted in the same figure. There is a good agreement between the UVOT magnitudes in and bands and the and magnitudes obtained with the HCT. The observed data set is used to derive various photometric parameters of SN 2012dn, which are tabulated in Table 6. The date of maximum light and brightness at maximum light were estimated by fitting a cubic spline to the points around maximum. The band light curve reached a maximum brightness of 14.38 0.01 mag on JD 2456132.89 0.19. The post-maximum decline rate during the first 15 days, , is estimated to be 0.90 0.04. The reddening corrected decline rate parameter (), estimated using the relation by Phillips et al. (1999) is 0.92. The of SN 2012dn is comparable to those of SN 1991T (Lira et al., 1998), SNF 20080723-012 (Scalzo et al., 2012), slower than normal SNe Ia SN 2003du (Anupama, Sahu & Jose, 2005), SN 2005cf (Pastorello et al., 2007) and faster than the super-Chandra SNe Ia SN 2006gz (Hicken et al., 2007), SN 2007if (Scalzo et al., 2010), and SN 2009dc (Yamanaka et al., 2009; Silverman et al., 2011; Taubenberger et al., 2011).
| Band | JD (Max) | Decline rate* | Colours at max | |||
|---|---|---|---|---|---|---|
| during (50–100 d) | ||||||
| 2456130.42 0.06 | 13.936 0.030 | 20.094 0.155 | 0.80 0.04 | 3.786 | ||
| 2456132.89 0.19 | 14.384 0.017 | 19.516 0.152 | 0.90 0.04 | 2.764 | = 0.620 0.002 | |
| 2456134.52 0.10 | 14.295 0.016 | 19.417 0.152 | 0.36 0.02 | 3.824 | = 0.100 0.002 | |
| 2456135.46 0.06 | 14.245 0.018 | 19.328 0.152 | 0.31 0.03 | 4.327 | = 0.044 0.002 | |
| 2456136.16 0.17 | 14.307 0.020 | 19.114 0.153 | 4.674 | = 0.195 0.003 | ||
| * in unit of mag (100 d)-1 and epoch is relative to band maximum. | ||||||
The maximum in band (13.936 0.030 mag) occurred on JD 2456130.42 0.06, 2.5 d before the band maximum, while the supernova reached maximum in , and bands at 1.6 d (JD 2456134.52 0.10), 2.6 d (JD 2456135.46 0.06) and 3.3 d (JD 2456136.16 0.17) after band maximum, respectively. In a recent study using the Swift UVOT data, Brown et al. (2014) have reported as 1.080.03. The date of maximum and magnitude at maximum estimated in this work are consistent with those reported by Brown et al. (2014). The difference in the value of may be due to the methods adopted for its estimation. Brown et al. (2014) have determined it by stretching a template light curve (from MLCS2k2: Jha, Riess & Krishner, 2007) to the data between 2 days before and 15 days after maximum light and interpolating from the stretched template, whereas we have determined it by fitting a cubic spline to the observed data points around maximum.
In normal and luminous SNe Ia, the maximum in band always precedes that of band. For example, in SN 1991T, band light curve reached maximum at 0.4 d with respect to band maximum, in SN 1990N the maximum occurred at 2.0 d (Lira et al., 1998) and in SN 2003du the maximum in band occurred at 1.9 d (Anupama et al., 2005). However, in SN 2012dn the maximum occurred 3.3 days after band maximum. For SN 2012dn, the delay in band maximum with respect to band is not in accordance with the observed trend for normal and luminous SNe Ia. A similar behaviour was also observed in SN 2009dc (Taubenberger et al., 2011). Delayed band maximum with respect to band maximum has been observed in subluminous SN 1991bg-like objects (Taubenberger et al., 2008) and the peculiar subluminous supernova SN 2005hk (Sahu et al., 2008).
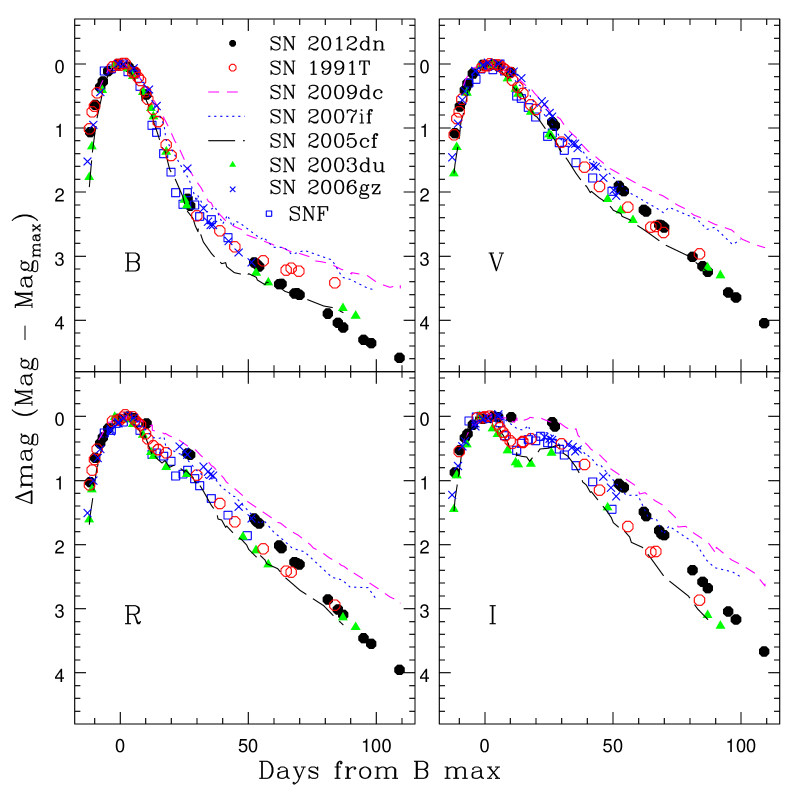
In Fig. 3, the light curves of SN 2012dn are compared with those of the well studied normal SNe Ia: SN 2003du ( = 1.04; Anupama et al. 2005), SN 2005cf ( = 1.12; Pastorello et al. 2007), the luminous SNe Ia: SN 1991T ( = 0.95; Lira et al. 1998), SNF20080723-012 ( = 0.93; Scalzo et al. 2012) and super-Chandra SNe Ia: SN 2009dc ( = 0.71; Taubenberger et al. 2011), SN 2007if ( = 0.71; Scalzo et al. 2010), SN 2006gz ( = 0.69; Hicken et al. 2007). All the light curves in each band have been shifted to match their peak magnitudes and to the epoch of band maximum. From Fig. 3, we find that the light curve width of SN 2012dn is intermediate between normal and super-Chandra SNe Ia. In the early phase, the band light curve of SN 2012dn is similar to that of SN 1991T, however, during late phase, SN 2012dn declines faster than SN 1991T. A similar trend is seen in the band also.
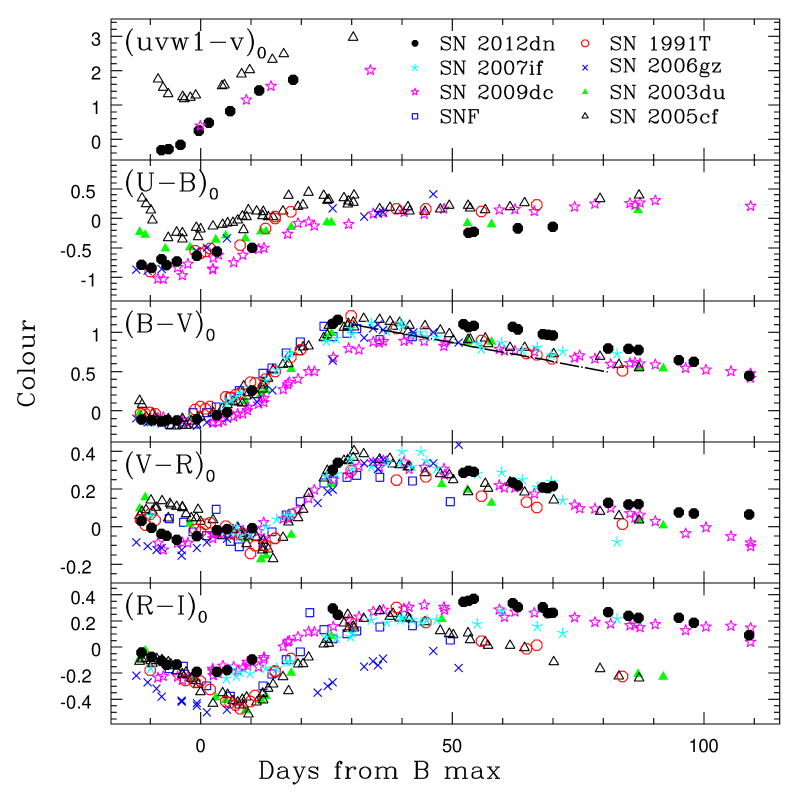
The reddening corrected , , , and colour curves of SN 20012dn are plotted in Fig. 4 and their values at the time of band maximum are listed in Table 6. Colour curves of some well studied SNe Ia (used for comparing the light curves) have also been plotted in the same figure for comparison. Following extinction law of Cardelli, Clayton & Mathis (1989), all the colour curves have been dereddened. The total reddening of = 0.18 was used for SN 2012dn (refer section 3.4) and for other SNe the reddening values were taken from their respective references.
The colour of SN 2012dn is bluer as compared to the normal type Ia SNe SN 2003du and SN 2005cf. In the pre-maximum phase colour evolution of SN 2012dn is similar to SN 2006gz and marginally redder than SN 2009dc, but during the post-maximum phase it is significantly bluer. Brown et al. (2014) have noted that during pre-maximum phase SN 2012dn has bluer colour as compared to other spectroscopically normal SNe Ia (refer Fig 3. of Brown et al., 2014). In spectroscopically normal SNe Ia the and colours evolve from red to blue, reaching a minimum colour a few days before the optical maximum and then becoming redder again. The and colour evolution of SN 2012dn donot follow this trend of normal SNe Ia.
From pre-maximum phase to 30 d after band maximum, the colour evolution of SN 2012dn is similar to the normal type Ia SNe 2003du, 2005cf, overluminous SN 1991T and super-Chandra SN 2007if. During 50–80 d after maximum SN 2012dn shows redder colour and 100 d after band maximum colour of SN 2012dn comes close to normal type Ia SNe as well as super-Chandra SNe. The colour evolution of SN 2012dn follows those of normal and super-Chandra SNe. The colour evolution of SN 2012dn closely follows SN 2009dc and SN 2007if and is different from that of SN 1991T and other normal SNe Ia, which may be due to difference in the strength of the band secondary maximum in these events.
3.2 Luminous secondary maximum in and bands
The band light curve of normal and SN 1991T-like SNe Ia shows secondary maximum around 21 to 30 d after band maximum (Leibundgut, 2000), with a pronounced minima in between the peaks. Around this epoch, a shoulder/rebrightening is also seen in the band light curve. In Fig. 5, we have compared early phase and band light curves of SN 2012dn with the light curves of SNe used for comparison in Fig. 3. Our imaging data does not have very good coverage during early post-maximum phase. However, it is evident from Fig. 5 that the minima between the primary and secondary peak is absent/very weak in the band light curve of SN 2012dn, different from those of normal SNe Ia and SN 1991T-like objects. In SN 2009dc, the minima between primary and secondary maxima was not so pronounced and the early post-maximum and light curves flatten to give a plateau-like appearance (Silverman et al., 2011; Taubenberger et al., 2011).
It is apparent from Fig. 5 that in the band, normal SNe Ia SN 2003du and SN 2005cf show deep minimum between primary and secondary maxima. The depth of minimum with respect to primary maximum is 0.7 mag for normal SNe Ia (used here) while in SN 1991T it is 0.4 mag. As compared to the primary maximum, the secondary maximum is fainter by 0.5 mag and 0.3 mag in normal and SN 1991T-like luminous events, respectively. In SN 2009dc, the primary and secondary maxima are almost equally bright and minimum seems to be unnoticeable. This gives a broader, plateau-like appearance to the band light curve around maximum light. The band light curve of SN 2006gz and SN 2007if appears to have linear decline during the early post-maximum phase. From Fig. 5, it is clear that in the early post-maximum phase, band light curve of SN 2012dn appears to be very similar to that of SN 2009dc. The strength of secondary maximum in both these objects is similar. Light curve of SN 2012dn in band during the early post-maximum decline is similar to SN 2006gz and SN 2007if, showing a stronger bump compared to normal SNe Ia, but weaker than SN 2009dc.
Early phase post-maximum ( 50 d) decline rates () for SN 2012dn and other SNe in comparison have been calculated in the bands and are listed in Table 7. From this analysis and from Fig. 5, it is clear that the sequence of rebrightening/broadening of and band light curves of SNe in comparison is: normal (SN 2003du, SN 2005cf) luminous (SNF, SN 1991T) super-Chandra (SN 2006gz, SN 2007if) (SN 2012dn) super-Chandra (SN 2009dc). SN 2009dc appears to have the most rebrightening/broadening during this epoch.
| SNe | |||||||||
|---|---|---|---|---|---|---|---|---|---|
| * Decline rate during 50–100 d | |||||||||
| SN 2012dn | 3.786 | 2.764 | 3.824 | 4.327 | 4.674 | 3.05 | 1.88 | 1.62 | 1.11 |
| SN 2009dc | 1.950 | 1.452 | 2.094 | 2.703 | 3.034 | 2.66 | 1.68 | 1.38 | 0.91 |
| SN 2007if | - | 1.863 | 1.918 | 2.740 | 3.104 | - | - | - | - |
| SN 1991T | 1.831 | 1.399 | 2.718 | 3.335 | 4.346 | 2.98 | 2.14 | 1.89 | 1.37 |
| SN 2005cf | 2.198 | 1.580 | 2.581 | 3.184 | 4.132 | 3.29 | 2.31 | 2.08 | 1.50 |
| SN 2003du | 2.363 | 1.652 | 2.649 | 3.110 | 3.979 | 3.18 | 2.22 | 1.98 | 1.46 |
| * in unit of mag (100 d)-1 and epoch is relative to band maximum. | |||||||||
The secondary maximum in the through band light curves are thought to be associated with the ionization state of the ejecta (Pinto & Eastman, 2000; Li et al., 2003; Kasen, 2006). Based on numerical simulations, Kasen (2006) has shown that the secondary maximum of SNe Ia is directly related to the ionization evolution of IGEs in the ejecta. It is identified with the onset and recession of the 2 1 (transition from doubly to singly ionized states) ionization front into iron-rich ejecta. Other factors such as change in flux mean opacity, mass of 56Ni and mixing of 56Ni into the ejecta affect the occurrence and strength of secondary maxima. Mixing of 56Ni outward into the region of IMEs advances the secondary maximum, causing it to merge with the first maximum. This also results in broadening the peak in and band light curves, and the disappearance of the secondary maximum. The strength of the secondary maximum is found to be a good measure of the amount of IGEs synthesized in the explosion.
In subluminous SNe Ia, because of the small amount of 56Ni, the secondary maximum occurs at early times and merges with the first maximum, leading to an absence of the secondary maximum. In the case of the low luminosity, peculiar SN Ia SN 2002cx, the broad peak in the band and the nearly constant, plateau phase for 20 d in the band, seen around maximum, were suggested, by Li et al. (2003), to be a result of the rapid change in the ionization stage (from Fe iii to Fe ii). According to Li et al. (2003), this change in the ionization stage causes an early release of the residual stored energy, resulting in the merger of the primary and secondary peak, giving rise to a broadened peak in the band and a plateau phase in the band light curves.
The observed absolute magnitude of SN 2012dn clearly indicates the supernova is not subluminous. Hence the apparent absence of a secondary maximum, is not due to low production of 56Ni. As suggested earlier, the secondary maximum in the band is luminous, giving it a broad, plateau appearance. This hints towards a larger production of IGEs. The large production of IGEs and their mixing to higher velocities in the explosion thus appears to be the cause of luminous secondary maximum in SN 2012dn.
3.3 Enhanced fading in the late phase
During late phase ( 50–100 d after band maximum), evolution of light curves of SN 2012dn is different from other well studied events (refer Fig. 3 and Fig. 6). The late phase decline rate of SN 2012dn and other events is estimated by a least square fit to the observed data in , , , , bands and is listed in Table 7. The late phase decline rate of SN 2012dn is faster than that of other objects in comparison.
Steepening in the light curve has also been observed in the super-Chandra SNe Ia SN 2006gz and SN 2009dc, but at much later phases. Observation of SN 2006gz a year after the band maximum revealed that it was fainter than the normal type Ia SN 2003du by a factor of 4. SN 2006gz faded dramatically sometime between the peak phase and the nebular phase (Maeda et al., 2009). Likewise, SN 2009dc showed an increase in the decline rate +200 d, and at +400 d, it was no longer luminous than SN 2003du (Taubenberger et al., 2013). Though the peak luminosity of SNF20080723-012 was similar to SN 2006gz and SN 1991T, it also showed signature of rapid decline and 200 d after maximum it was fainter than SN 1991T. Among the super-Chandra SNe Ia SN 2007if showed the least steepening in the light curve. It had a nearly constant decline rate during 50–300 d.
Various mechanisms, such as positron escaping, infra-red catastrophe (IRC), dust formation and reprocessing of optical light to longer wavelengths, have been proposed to explain the observed departure in the late phase decline rate from the expected one due to 56Co56Fe decay.
Positrons are produced in the ejecta of SNe Ia by 56Co56Fe decay. Around 50 d after explosion, the energy deposition is dominated by the interaction involving decay products of the 56Co56Fe chain, namely, gamma-ray photons and positrons. Because of the significantly high energy available with photons per decay than positrons, during the early phase, energy deposition is dominated by photons. At later phase ( 100 d after explosion), the energy deposition is dominated by positrons. At low ejecta density, positron may escape depending on the nature of the magnetic field (Milne, The & Leising, 2001). The escape of positron causes reduction in the energy deposition rates to the ejecta, which in turn leads to fainter light curves. This effect is found to be very low even at very late phase; at 400 d, it can account for at the most 0.5 mag drop in the light curve (Maeda et al., 2009). Hence, the observed early steepening ( 60 d after band maximum) in the light curve of SN 2012dn can not be a consequence of escape of positrons. Taubenberger et al. (2013) have suggested that the observed luminosity drop is probably the outcome of the flux distribution into infra-red, which could be accomplished by an early infra-red catastrophe (IRC) or by dust formation.
The IRC causes shift of bulk emission from optical to infra-red wavelengths at late phases (Axelrod, 1988), resulting in significant drop in the late time optical light curves. This occurs when the density and temperature of the ejecta fall below a critical value during the expansion of ejecta. However, there is no indication of occurrence of IRC in SNe Ia (see also Maeda et al., 2009; Taubenberger et al., 2013).
Dust formation in the ejecta of SNe Ia has been explored theoretically by Nozawa et al. (2011). They have shown that similar to core-collapse SNe, dust can form in the ejecta of SNe Ia also. Because of low gas density in the ejecta of SNe Ia, the gas temperature decreases rapidly, resulting in much earlier condensation of dust ( 100–300 d) than those in type IIP SNe ( 300 d).
The pre-maximum spectra of SN 2012dn show signature of C ii 6580 feature (refer section 4.1), indicating the presence of unburned C. Nozawa et al. (2011) have shown that the C present in the ejecta can lead to formation of graphite dust in the supernova ejecta. The unburned C in the ejecta may also combine with O to form CO molecules affecting the composition, size and mass of dust grain. Further, radioactivity due to 56Ni produced in the explosion, destroys the molecules making C free for dust formation. The slow expansion velocity of the ejecta results in comparatively high densities at late phases, which may also promote formation of dust in the supernova ejecta.
It thus appears that the observed fast decline in SN 2012dn might be due to dust formation. The onset of dust formation in the ejecta should also increase the luminosity in the near-infrared (NIR) bands. However, due to non-availability of the NIR data we are unable to confirm. For super-Chandra objects, the observed differences in the onset of steepening in the light curve and magnitude drop can be understood in terms of different time-scales and intensities of dust formation (Taubenberger et al., 2013).
3.4 Reddening and Absolute magnitudes
Dust map of Schlegel, Finkbeiner & Davis (1998) gives colour excess of = 0.06 mag towards SN 2012dn due to the ISM within the Milky Way. Narrow Na i D absorption lines from the Milky Way and the host galaxy are seen in our medium resolution spectra of SN 2012dn obtained near maximum light, with an equivalent width of 0.69 Å and 0.75 Å , respectively. The empirical relation between reddening and equivalent width of Na i D line (Turatto, Benetti & Cappellaro, 2003) gives colour excess of = 0.12 mag from the host. For normal SNe Ia, the extinction within the host galaxy can also be estimated using the Lira-Phillips relation (Phillips et al., 1999). In Fig. 4 we have plotted the Lira-Phillips relation along with the colour evolution during 30–90 d after maximum light. The Lira-Phillips relation gives the colour excess within the host as = 0.43 mag, which is much higher than the reddening value estimated using the Na i D lines. Similar discrepancy between the reddening estimates from the Na i D lines and Lira-Phillips relation is noticed for SN 2009dc (Yamanaka et al., 2009) and SN 2007if (Scalzo et al., 2010) also. Further, the colour evolution of SN 2012dn appears to be slower than that expected from the Lira-Phillips relation (refer Fig. 4), indicating that Lira-Phillips relation may not hold for these objects.
Host galaxy reddening can be estimated using the observed colour at maximum and decline rate parameter (Phillips et al., 1999; Altavilla et al., 2004). It gives colour excess of = 0.12 for the host galaxy, which is similar to that obtained using Na i D lines. The observed discrepancy between Lira’s method and Phillips/Altavilla’s method may be due to difference in the colour evolution of SN 2012dn and normal SNe Ia. For further analysis we have adopted total reddening = 0.18 mag.
Recession velocity of host galaxy ESO 462-16 (PGC 64605), corrected for infall of the Local Group towards Virgo Cluster is = 3070 km s-1 (NED). Using = 72 km s-1 Mpc-1 (Freedman et al., 2001) we obtained distance modulus of host galaxy of SN 2012dn to be = 33.15 0.15 mag. Following reddening law of Cardelli et al. (1989) and , the peak absolute magnitude of SN 2012dn in , , , and bands are calculated and given in Table 6.
The use of as 3.1 has been debated in the recent past. There are studies indicating value of lower than 3.1 for SNe Ia host galaxies (Altavilla et al., 2004; Reindl et al., 2005; Wang et al., 2006; Amanullah et al., 2014). It is shown by Jha et al. (2007) and Folatelli et al. (2010) that value of lower than 3.1 is preferred by SNe Ia significantly reddened by dust in their host galaxies. In another study Chotard et al. (2011) have also shown that the empirical reddening law, derived using optical spectrophotometric data of SNe Ia is compatible with the classical extinction law with = 2.8 0.3. However, for the sake of completeness, the peak absolute magnitude of SN 2012dn is also estimated with a lower value of = 2.3 (Wang et al., 2006). With = 2.3, the absolute magnitude of SN 2012dn will be fainter by 0.151, 0.128, 0.096, 0.072 and 0.046 mag, in , , , and bands, respectively, which does not change our conclusion. For rest of the analysis we have used as 3.1.
The absolute band light curves of SN 2012dn and other well studied SNe used for comparison in section 3.1 are plotted in Fig. 7. It is evident that in early phase SN 2012dn is marginally brighter than normal SNe Ia SN 2003du, SN 2005cf and less luminous than SN 1991T and other super-Chandra events. Though in optical bands SN 2012dn is marginally bright than the normal type Ia events, in the UVOT and bands it is one and two magnitudes brighter than normal events, respectively (Brown et al., 2014). During 20–65 d after band maximum, in optical bands SN 2012dn is considerably brighter than normal SNe Ia and comparable to that of SN 1991T. Later on SN 2012dn declines faster and at 100 d its luminosity is similar to the normal SNe Ia.
In Fig. 8, absolute band magnitude at maximum is plotted against decline rate parameter for SN 2012dn and other well studied SNe Ia used for comparison in section 3.1. To have the observed range of for SNe Ia, some more objects, SN 2001ay (Krisciunas et al., 2011), SN 2002hu (Sahu, Anupama & Prabhu, 2006), SN 2003gs (Krisciunas et al., 2009), SN 2003fg (Howell et al., 2006), SN 2005bl, SN 1999gh, SN 2000dk and SN 1991bg (Taubenberger et al., 2008) are included in the figure. For comparison, absolute magnitude corresponding to = 3.1 (as estimated by authors of the original papers) is taken. For SN 2001ay was taken as 2.4 (Krisciunas et al. 2011), we recalculated its absolute magnitude for = 3.1 The luminosity decline rate relation of Phillips et al. (1999) is also shown in the same figure as solid line. Normal SNe Ia with close to 1.1 follow Phillip’s relation (Phillips et al., 1999). SNe Ia having on the extreme ends (overluminous/super-Chandra and underluminous objects) deviate from Phillips relation. SN 2012dn also lies away from Phillip’s relation, although, the deviation is not as significant as is seen in the case of other super-Chandra objects.
3.5 Bolometric light curve
The observed , , , and magnitudes and UVOT , , magnitudes have been used for deriving the bolometric light curve of SN 2012dn. The optical and UVOT magnitudes are corrected for total reddening of = 0.18 mag using the reddening law of Cardelli et al. (1989) with = 3.1. A distance modulus of = 33.15 0.15 mag is used. On a few nights when there is no band observation, data points are obtained by interpolating the neighbouring points. Reddening corrected optical magnitudes were converted to corresponding flux following Bessell, Castelli & Plez (1998). First we have estimated quasi-bolometric fluxes using the optical bands only, by fitting spline curve to the , , , and fluxes and integrating over the wavelength range 3100 Å to 10600 Å determined by the response of the optical filters used for the observation.
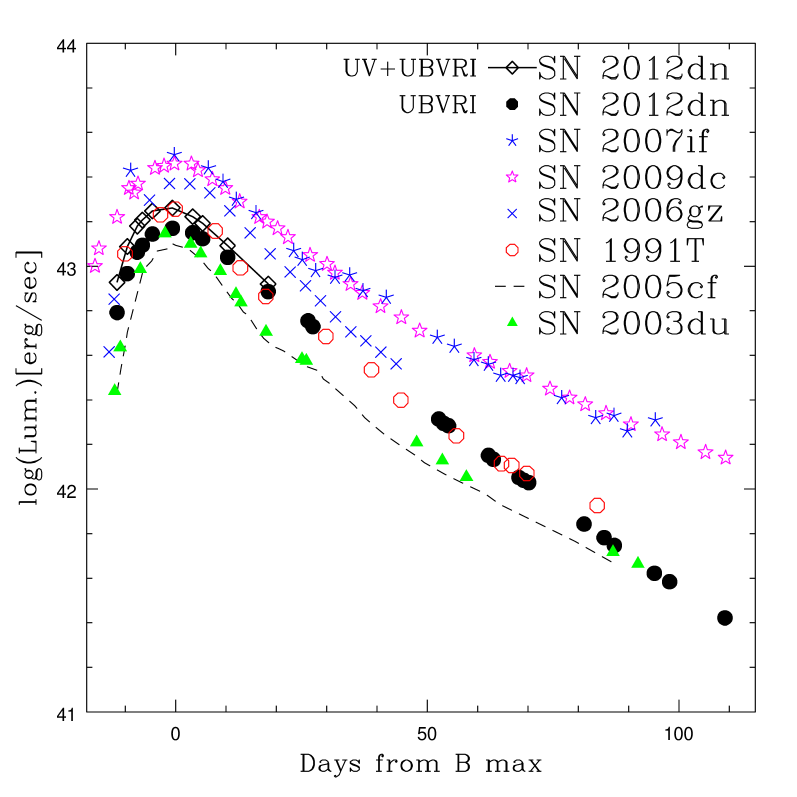
The quasi-bolometric light curve of SN 2012dn along with the bolometric light curve of SN 2006gz, SN 2007if, SN 2009dc, SN 1991T, SN 2005cf and SN 2003du is plotted in Fig. 9. The bolometric light curve of SN 1991T, SN 2003du and SN 2005cf are computed in a similar fashion as described for SN 2012dn. The bolometric light curve of SN 2006gz is taken from Hicken et al. (2007), SN 2007if is taken from Scalzo et al. (2010), and SN 2009dc is taken from Taubenberger et al. (2011). From the figure it is evident that the peak bolometric luminosity of SN 2012dn is greater than those of the normal SNe Ia, comparable to SN 1991T and less than the super-Chandra SNe Ia SN 2006gz, SN 2007if and SN 2009dc.
In the next step we have included the UVOT fluxes also for estimating the quasi-bolometric flux. The extinction in the Swift UVOT bands have been estimated using the empirical relation and the co-efficients provided by Brown et al. (2010). The zero points for converting the UV magnitudes to fluxes have been taken from Poole et al. (2008). The UV-optical quasi-bolometric flux of SN 2012dn was estimated by integrating the monochromatic flux over the wavelength range 1600Å to 10600Å, and is plotted in Fig. 9 with open diamond symbol connected by solid line.
The peak quasi bolometric luminosity of SN 2012dn using only optical bands is = 43.17 0.06 erg s-1, while after including the Swift UV flux the peak quasi-bolometric luminosity increases by 20% and it goes to 43.25 0.06 erg s-1. To obtain the (UV-Optical-IR) bolometric luminosity, correction should be made to account for flux in NIR passbands. Suntzeff (1996) estimated that contribution from NIR band is at most 10% at early times. For SN 2005cf, Wang et al. (2009) showed that the NIR contribution declines initially with a minimum of 5% (see Fig. 23 in Wang et al., 2009) at 4 d after the band maximum and later it rises linearly reaching to a peak of 20% at 30 d (during secondary maximum). At nebular phases, the NIR contribution was found to decline gradually reaching below 10% at 80 d. For SN 2009dc, Taubenberger et al. (2011) estimated the NIR contribution of 10% to the bolometric flux around maximum light. The NIR correction for SN 2007if was less than 5% around band maximum (Scalzo et al., 2010). Adding 5% contributions to account for the missing NIR flux at peak luminosity, we find peak bolometric luminosity of = 43.27 0.06 erg s-1 for SN 2012dn.
3.6 Mass of 56Ni
Light curve of SNe Ia is powered by the radioactive decay of 56Ni synthesized in the explosion. The 56Ni decays to 56Co, which subsequently decays to 56Fe. Mass of 56Ni can be estimated using Arnett’s rule (Arnett, 1982), which states that the peak bolometric luminosity of a type Ia SN is proportional to the instantaneous rate of energy release from radioactive decay chain 56Ni 56Co 56Fe. This can be written in the mathematical form as
where is the ratio of bolometric to radioactive luminosities (near unity) and is the radioactivity luminosity per unit nickel mass evaluated for the rise time . From Nadyozhin (1994), can be written as
where 8.8 and 111.3 d are e-folding lifetimes () of 56Ni and 56Co, respectively.
SN 2012dn was discovered on 2012 July 08.52 (UT) which is 15.87 d before band maximum. This provides a lower limit to the rise time. We do not have good constrain on the upper limit as non-detection is reported on 2011 April 01, much before the discovery (Bock et al., 2012). The typical SNe Ia have band rise time of 19 d (Conley et al., 2006). For super-Chandra SNe Ia, there is a considerable variation in the rise time e.g. 22 d for SN 2003fg (Howell et al., 2006), 18.5 d for SN 2006gz (Hicken et al., 2007), 24.2 d for SN 2007if (Scalzo et al., 2010) and 23 d for SN 2009dc (Silverman et al., 2011). Ganeshalingam, Li & Filippenko (2011) found band rise time of 18 d for spectroscopically normal SNe Ia and longer rise time for slow-declining, luminous SN 1991T-like objects. Their sample of 1991T-like SNe Ia shows rise time distribution near 21 d. Scalzo et al. (2012) also found similar result for luminous objects. The bolometric light curve of SN 2012dn peaks 1 d before the band light curve. Hence, we use rise time of 20 d for SN 2012dn, and find M = M⊙ for peak bolometric luminosity of = 43.27 erg s-1. Arnett’s rule uses = 1 exactly. However, depending on the explosion model the value of may range from 0.8 to 1.4, with 1.2 as most applicable value (Branch, 1992). Using = 1.2, for SN 2012dn, we find M = 0.82 0.12 M⊙. The derived mass of 56Ni is on the higher side of those observed in normal SNe Ia.
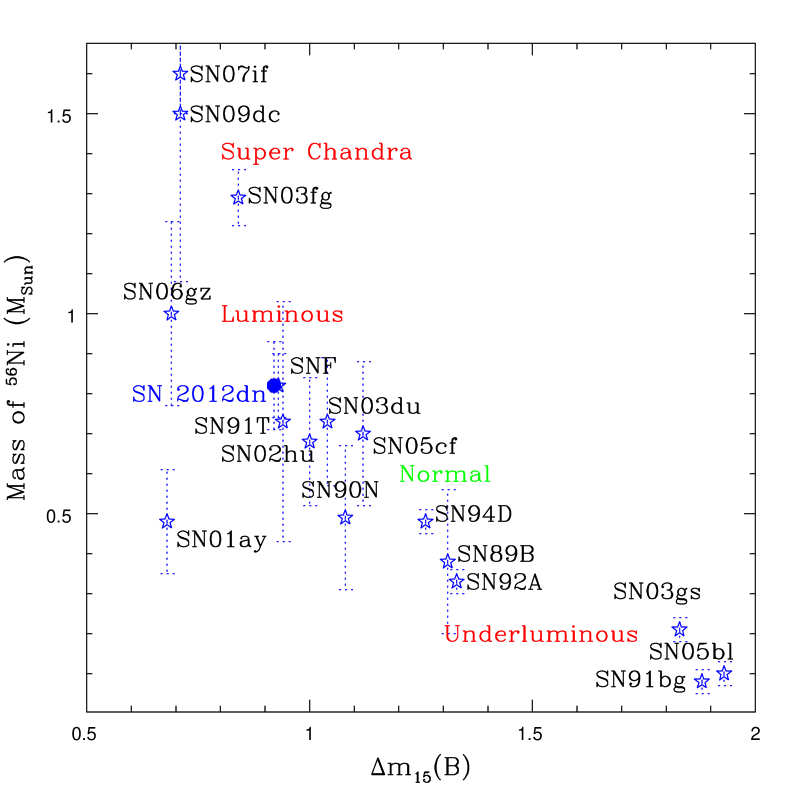
In Fig. 10, mass of 56Ni is plotted against for SN 2012dn and other well studied SNe Ia used in section 3.4 and Fig. 8. For the sake of completeness SN 1989B, SN 1990N, SN 1991T, SN 1991bg, SN 1992A and SN 1994D were included in this figure, and mass of 56Ni for these events were taken from Stritzinger et al. (2006). For some of the SNe, mass of 56Ni was arrived at by modelling of nebular spectra/light curves as well as by the Arnett’s rule. In such cases we have used the mass of 56Ni estimated using Arnett’s rule. Whenever required the reported mass of 56Ni was scaled for = 1.2. It is found that SN 2012dn lies in the luminous SNe Ia group, consistent with its other observed properties.
4 Spectral evolution
Medium resolution spectra of SN 2012dn observed during 11.6 d to +98.2 d with respect to band maximum are presented in Fig. 11, 13, 16 and 18. The spectra have been corrected for redshift (z = 0.01) and total reddening of = 0.18 as described in sections 2.2 and 3.4.
4.1 Pre-maximum
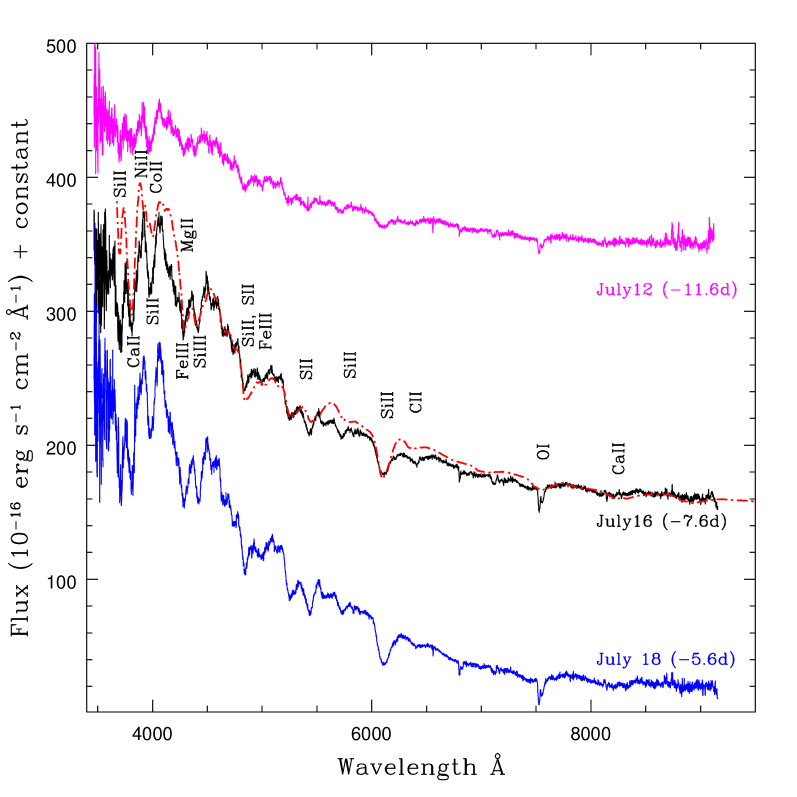
The pre-maximum spectra of SN 2012dn obtained at 11.6, 7.6 and 5.6 d with respect to band maximum are plotted in Fig. 11. The first spectrum obtained on 11.6 d, has blue continuum with relatively narrow absorption lines. The characteristic absorption features of SNe Ia due to Si ii 6355, 5972, 4130 and 3858, S ii lines at 5454, 5640 and narrow Ca ii H&K lines are clearly seen. The blueshift of the Si ii 6355 line is 11900 km s-1. There is a broad absorption redward of Si ii 6355 line, which is associated with the C ii 6580 line (Parrent & Howell, 2012). This line is blueshifted by 9500 km s-1. Other lines due to C ii at 7234 and 4267 are marginally detected in this spectrum. The other two spectra at 7.6 and 5.6 d are similar to that of 11.6 d. The absorption lines have become stronger. The C ii 6580 line is detected in all the pre-maximum spectra with reducing strength while the other C ii lines are not seen in 7.6 and 5.6 d spectra. The Ca ii NIR triplet is becoming stronger. The Si iii 4560 line is very strong and its strength is comparable to Mg ii line in the pre-maximum spectra.
Pre-maximum spectrum at 7.6 d is fit with the synthetic spectrum generated using the syn++333https://c3.lbl.gov/es/ code and plotted in Fig. 11. The syn++ code is a rewrite and enhanced version of original parametrized supernova synthetic spectrum code synow (Fisher, 2000), with more complete atomic data files (Thomas, Nugent & Meza, 2011). The synow code is based on basic assumption of spherical symmetry where velocity of ejecta is proportional to radius (). Line formation is treated using the Sobolev approximation (Sobolev, 1957; Jeffery & Branch, 1990) and occurs purely due to resonant scattering outside a sharp photosphere that emits blackbody continuum at a given temperature. Profile of a reference line of an ion is determined by optical depth which is a function of velocity. Relative strengths of other lines of the same species are calculated assuming Boltzmann statistics at an excitation temperature.
The 7.6 d spectrum of SN 2012dn matches well with the synthetic spectrum having photospheric velocity of 11800 km s-1 and blackbody temperature of 26000 K. The synthetic spectrum with lower temperature ( 12000 K), used for normal SNe Ia (Branch et al., 2005) does not fit the bluer part (below 5500Å) of the spectrum. An excess emission is noticed in the bluer part of the spectrum, consistent with the very blue and colours of SN 2012dn in the pre-maximum phase. The synthetic spectrum includes ions of O i, Mg ii, Si ii, Si iii, S ii, Ca ii, Fe ii, Fe iii, Co ii and Ni ii. Optical depths of all the lines were set to decrease exponentially with velocity, keeping e-folding velocity at 1000 km s-1. An excitation temperature of 10000 K was used for all ions except C ii, for which it was taken as 17000 K to match with the relative line strength in the observed spectrum. This is similar to the case of SN 2009dc and SN 2003fg wherein higher excitation temperatures of 20000 K and 35000 K were used (Silverman et al., 2011; Howell et al., 2006). The lines identified with the help of synthetic spectrum are marked in Fig. 11. Inclusion of Co ii and Ni ii improves the fit at Si ii 4130.
The feature at emission part of W shaped S ii and blueward to Si ii 5972 in the observed spectrum could not be reproduced in the synthetic spectrum. A similar mismatch was also noted by Taubenberger et al. (2011) for SN 2009dc at +7 d. A blend of Na i D with Si ii 5972 was suggested to be responsible for this feature (Taubenberger et al., 2011). To associate this feature with Na i D in SN 2012dn, relatively high ejecta velocity is required. Si iii with significantly lower photospheric velocity could also give rise to this feature. However, with the lower photospheric velocity, lines due to other ions become much stronger than seen in the observed spectrum.
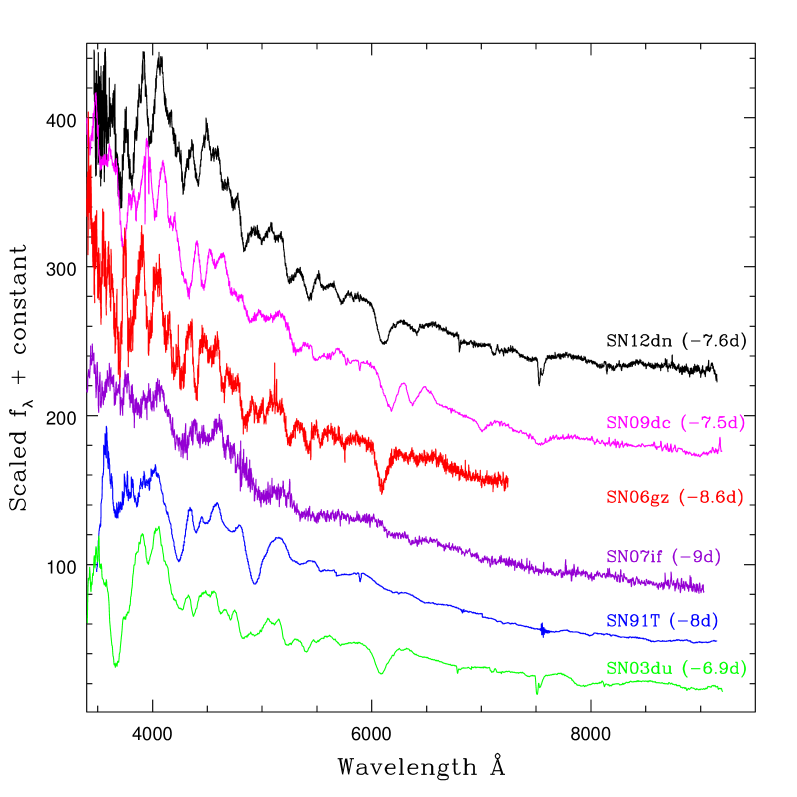
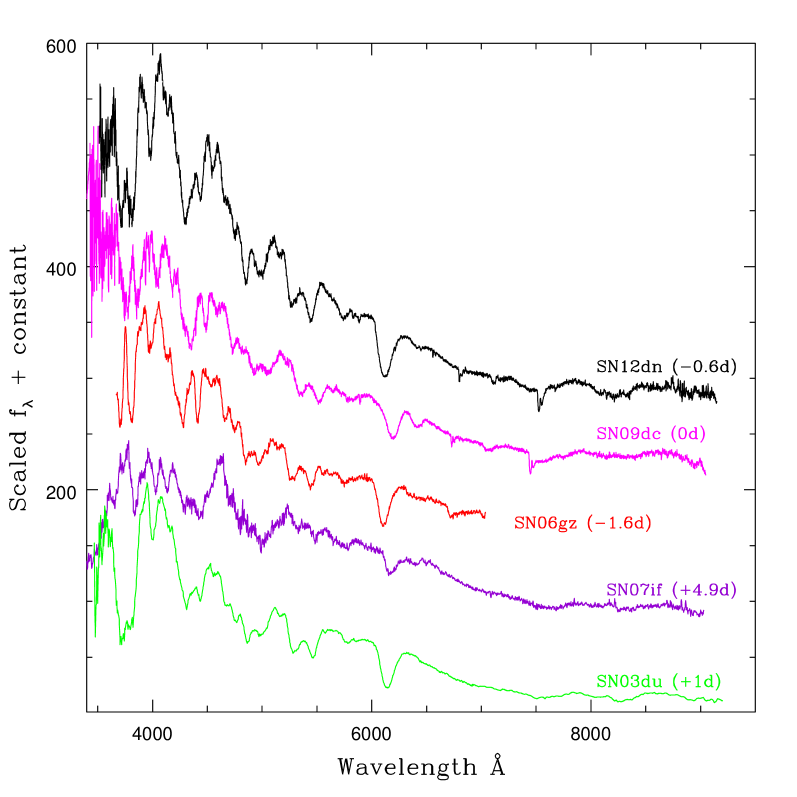
The 7.6 d spectrum of SN 2012dn is plotted in Fig. 12 with spectra of SN 2009dc (Taubenberger et al., 2011), SN 2006gz (Hicken et al., 2007), SN 2007if (Scalzo et al., 2010), SN 1991T (Jeffery et al., 1992; Schmidt et al., 1994) and SN 2003du (Anupama et al., 2005) taken around similar epoch. The spectra of SN 2009dc (used in this figure only) and SN 2007if are taken from Weizmann Interactive Supernova Data Repository (WISeREP444http://www.weizmann.ac.il/astrophysics/wiserep/). Spectra of SN 2006gz have been obtained from CfA Supernova Data Archive555http://www.cfa.harvard.edu/supernova/SNarchive.html while spectra of SN 1991T are obtained from CfA and SUSPECT666http://www.nhn.ou.edu/~suspect/ Supernova Spectrum Archive. Spectra of SN 2009dc except at 7 d are from our own observations with the HCT. A close resemblance between the spectrum of SN 2012dn and SN 2006gz is very clear. Spectra of both the objects are characterized by well developed Si ii 6355, strong Si iii 4560, weak C ii 6580 and very narrow lines due to other IMEs. Spectrum of SN 2003du at 7 d shows lines due to the species seen in the spectra of SN 2012dn and SN 2006gz, however, the relative line strength and the line widths are different from those in SN 2012dn. In SN 2003du the lines are broader and blended more. Though, the decline rate parameter of SN 2012dn and SN 1991T are similar, they show considerable difference in the pre-maximum spectral evolution. Spectrum of SN 1991T at 8 d doesnot show the Si ii 6355 line, instead it shows prominent Fe iii lines. SN 2007if seems to have featureless spectrum similar to SN 1991T. The Fe iii lines are even weaker in the spectrum of SN 2007if as compared to SN 1991T.
4.2 Maximum to early nebular phase
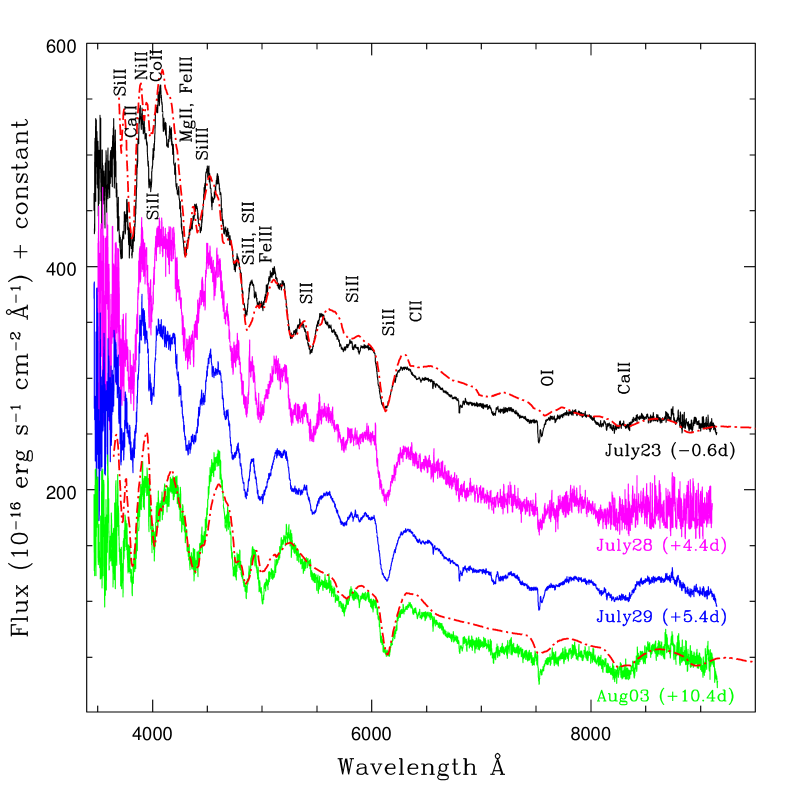
The spectral evolution during early post-maximum phase (close to maximum to 10 d after maximum) is displayed in Fig. 13. As compared to the 5.6 d, the spectrum close to maximum has redder continuum, which becomes increasingly redder at later epochs. The narrow Si ii 4130 and Ca ii H&K lines are well resolved and a small notch with decreasing strength at the position of C ii 6580 is seen till +10.4 d. The strong Si iii 4560 line in the pre-maximum spectra starts blending with the Mg ii line and disappears 5 d after band maximum. The S ii lines weaken and disappear in +10.4 d spectrum. The blend of Na i with Si ii at 5800 Å and Ca ii NIR triplet start becoming stronger.
In Fig. 13 spectra of SN 2012dn close to band maximum and at +10.4 d, are compared with the synthetic spectra obtained with syn++. As noted with the spectrum at 7.6 d, the synthetic spectrum with the blackbody temperature ( 13000 K) used for normal SNe Ia does not fit the bluer part of the observed spectrum at maximum. A synthetic spectrum with photospheric velocity of 11000 km s-1 and blackbody temperature of 20000 K reproduces the shape and features seen in the observed spectrum reasonably well. The ions included and their lines are marked in Fig. 13. The observed spectrum at +10.4 d is found to match well with the synthetic spectrum having photospheric velocity of 10500 km s-1 and blackbody temperature of 12000 K, similar to normal SNe Ia at similar epoch. An excitation temperature of 7000 K was used for all the ions. The synthetic spectrum at +10.4 d includes contributions from O i, Na i, Mg ii, Si ii, Ca ii, Fe ii and Co ii ions.
The spectra of SN 2012dn and other well studied SNe around maximum are compared in Fig. 14. Spectra of SN 2012dn, SN 2006gz appear very similar with narrow lines of IMEs. However, they differ considerably from the spectrum of SN 2009dc. The C ii 6580 line is prominent in SN 2009dc, whereas it is marginally seen in the spectra of SN 2012dn and SN 2006gz. The lines due to Si ii 6355, Ca ii H&K and Ca ii NIR triplet are weak in SN 2009dc as compared to SN 2012dn and SN 2006gz. Lines in the spectrum of SN 2003du continues to be broader than those in SN 2012dn. In SN 2007if the Si ii and other spectral features of IMEs start developing around +5 d. In Fig. 15, spectrum of SN 2012dn at +10.4 d is plotted with those of other SNe at similar epoch. The spectral similarity of SN 2012dn, SN 2009dc and SN 2006gz is apparent, they all show narrow lines. As compared to SN 2009dc, Si ii line is deeper in SN 2012dn and SN 2006gz. Spectral features of SN 2007if are shallower than all the SNe in comparison.
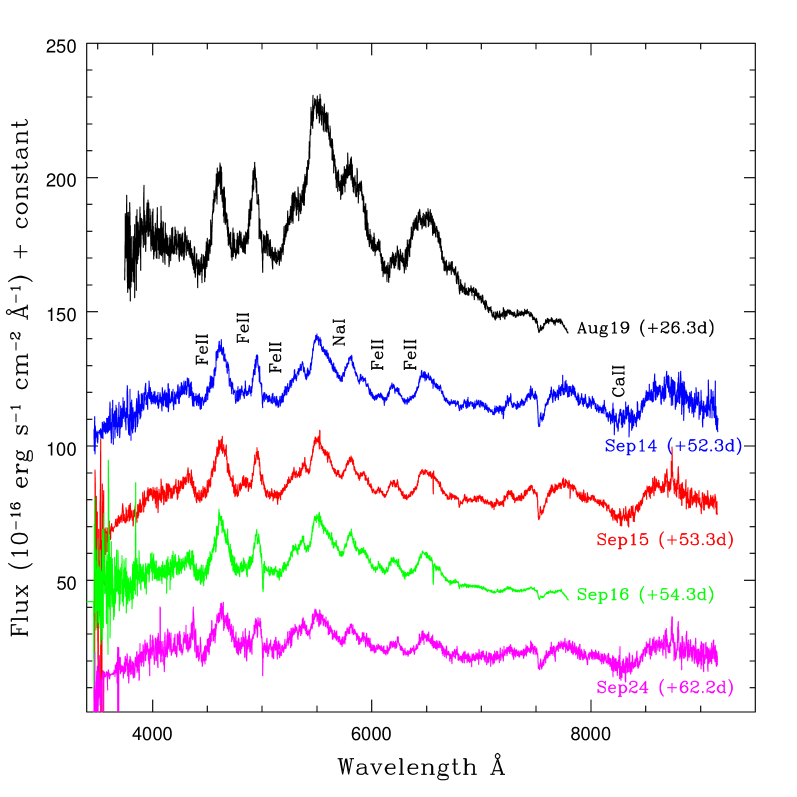
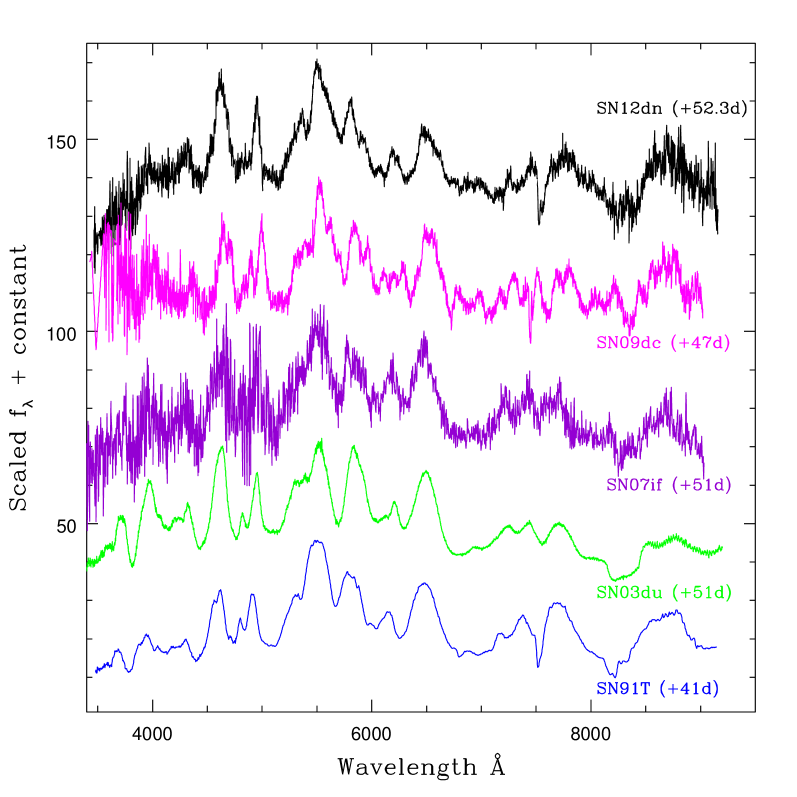
The spectral evolution of SN 2012dn during 1 to 2 months after band maximum is displayed in Fig. 16. The Si ii 6355 feature is replaced by developing Fe ii lines in spectrum of SN 2012dn obtained at +26.3 d. The Na i has also strengthened by this time. The spectra around 50 d after band maximum lack in Si ii, it is now dominated by Fe ii. The other strong features are due to Na i and Ca ii NIR triplet. Spectrum of SN 2012dn at +52.3 d is compared with spectra of other SNe at similar epoch in Fig. 17. Similar to SN 2009dc, the spectral features of SN 2012dn are relatively narrow than those of SN 2003du and SN 1991T. As compared to SN 2003du, the Ca ii H&K and Ca ii NIR triplet are weaker in SN 2012dn.
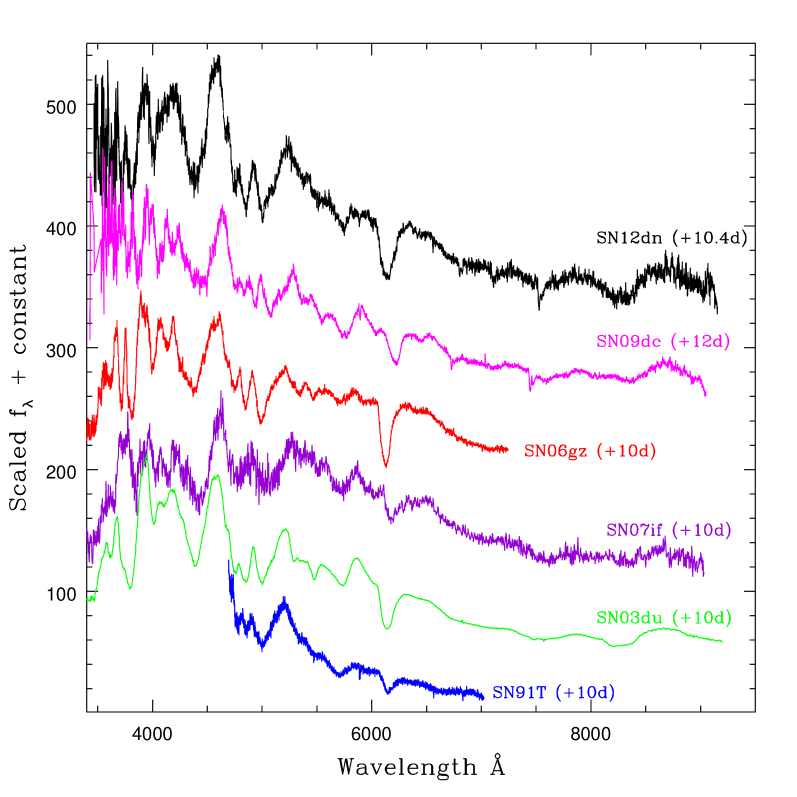
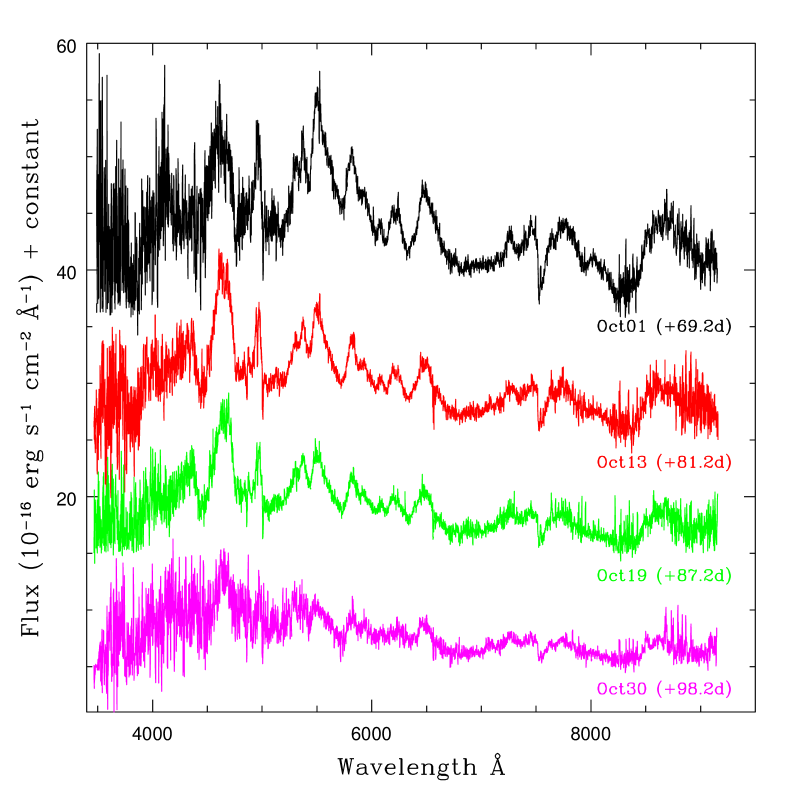
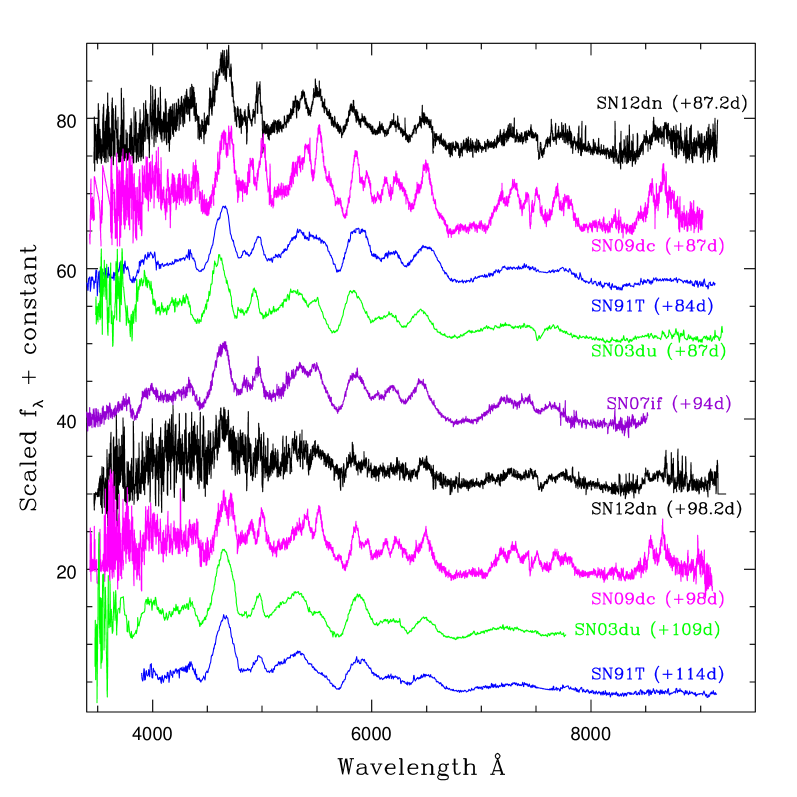
The spectral evolution of SN 2012dn in early nebular phase during +69.2 to +98.2 d is shown in Fig. 18. There is no appreciable change in the shape of spectra. Spectra are dominated by forbidden emission lines [Fe ii], [Fe iii] and [Co iii]. Spectra of SN 2012dn at +87.2 and +98.2 d are compared with those of SN 2009dc, SN 2007if, SN 1991T and SN 2003du at similar epoch in Fig. 19. With narrow lines, spectrum of SN 2012dn at +87.2 d shows similarity with that of SN 2009dc, whereas other SNe in comparison show broad features. Further, in the red region (beyond 7000 Å) SN 2012dn shows emission features which are absent in the spectra of SN 1991T and SN 2003du. The emission features in the region 7300–7800 Å and Ca ii NIR triplet emission are stronger in SN 2009dc. The emission features around 7500 Å are attributed to [Fe ii]/[Ni ii] and [Ca ii] in SN 2009dc (Taubenberger et al., 2013). These emission lines are seen in the spectrum of SN 2012dn also but with lower strength, similar to SN 2007if. The emission feature around 5500 Å generally assigned to [Fe iii] and [Fe ii] lines are well separated in the spectra of SN 2012dn and SN 2009dc, it is marginally separated in the spectra of SN 2003du and SN 2007if, whereas in SN 1991T a flat top blend is seen.
Nebular spectra (t 300 d) of super-Chandra SNe Ia SN 2006gz, SN 2007if and SN 2009dc have been discussed by Maeda et al. (2009) and Taubenberger et al. (2013). The strong [Fe III] emission around 4700 Å seen in the nebular spectra of normal and SN 1991T-like objects was found to be very weak or absent in the spectra of super-Chandra objects. In the late nebular phase ( 300 d), the flux ratio [Fe III] / [Fe II] of emission lines near 4700 and 5200 Å was found in the range 1.0–1.1 for super-Chandra SNe, while for normal and SN 1991T-like objects this ratio ranges between 1.3–1.9. Suppression of [Fe III] emission lines was also apparent in the spectrum of SN 2009dc taken at +165.1 d (Taubenberger et al., 2011). Our last spectrum of SN 2012dn at +98.2 d is too noisy below 5000 Å to estimate flux ratios.
4.3 Velocity evolution of the supernova ejecta
The expansion velocity of SN 2012dn measured using minimum of the Si ii 6355 absorption line at different epochs, is plotted in Fig. 20. The first data point in the plot is from the early velocity measurement by Parrent & Howell (2012). Velocity evolution of other well studied SNe Ia have also been plotted for comparison in the same figure. During the pre-maximum phase, till one week before band maximum, the Si ii velocity of normal SNe Ia shows a rapid decline, which is not seen in case of SN 2012dn and other super-Chandra SNe Ia. The Si ii velocity of SN 2012dn declines linearly. Though the Si ii line velocity evolution of SN 2012dn is similar to other super-Chandra SNe Ia, the measured velocities are significantly different. The Si ii line velocity of SN 2012dn is higher than that of super-Chandra SNe Ia SN 2009dc, SN 2007if, SN 2003fg and marginally lower than SN 2006gz.
At 11.6 d the Si ii velocity for SN 2012dn is 11900 km s-1 which reduced to 10900 km s-1 at band maximum. Around maximum SN 2006gz has Si ii velocity 11500 km s-1, similar to that of a typical type Ia supernova. The Si ii velocity of SN 2007if remained 9000 km s-1 from pre-maximum phase to one week after maximum, exhibiting a plateau-like feature in velocity evolution. A small plateau phase during 14 to 13 d was observed in SN 2006gz (Hicken et al., 2007). We donot see any plateau-like feature in Si ii velocity evolution of SN 2012dn, it declines linearly with a slope similar to SN 2006gz. Slow velocity evolution with plateau like feature and presence of unburned materials observed in super-Chandra SNe Ia have been interpreted as a result of envelope/shell or clumpy structure in their ejecta (Scalzo et al., 2010).
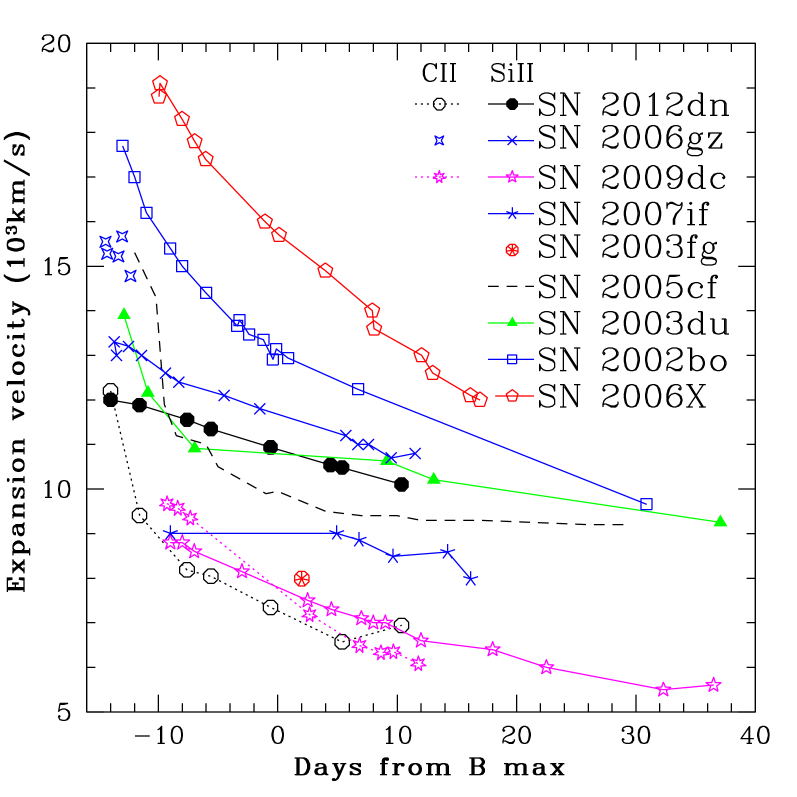
The C ii 6580 line velocity of SN 2012dn along with those of SN 2006gz and SN 2009dc is also plotted in the same figure. The first measurement of C ii line velocity is taken from Parrent & Howell (2012), wherein they have measured a velocity of 12200 km s-1, marginally higher than the velocity of Si ii line ( 12000 km s-1). In SN 2006gz, C ii line was detectable only during the pre-maximum phase with expansion velocity always higher than that of Si ii line. The C ii velocity in SN 2009dc was 800 km s-1 more than Si ii velocity around 9 d before maximum. Around maximum light C ii and Si ii velocities were comparable and afterwards C ii velocity was lower than Si ii velocity. In SN 2012dn C ii velocity evolution appears peculiar as compared to SN 2006gz and SN 2009dc. Except at 13 d (when C ii velocity is marginally higher than Si ii velocity), C ii velocity is always lower than Si ii velocity. The C ii velocity decreases rapidly from 12000 km s-1 to 9500 km s-1 in just 2 days. Afterwards the difference in velocity estimated using Si ii and C ii is 3000 km s-1.
Folatelli et al. (2012) have shown that for normal SNe Ia the velocity evolution of C ii is parallel to that of Si ii with an offset of +1000 km s-1. In another study of carbon features in SNe Ia, the ratio of Doppler velocities v (C ii 6580)/v (Si ii 6355) has been explored and for majority of SNe Ia it is found to be close to 1 (Parrent et al., 2011). For SN 2006bt and SN 2008ha, this ratio is 0.5 suggesting that the carbon clumps are ejected away from the line of sight of the observer. Parrent et al. (2011) have shown that any observed discrepancy between and could be explained if the actual velocity of C ii is same as but instead of forming in a shell at the observed velocity, the carbon is in a clump at and offset by an angle from the line of sight. It is possible that the observed discrepancy in the Si ii and C ii 6580 velocity in SN 2012dn may be due to clumping and projection effect of carbon rich material, however, detailed modelling is required to confirm it.
5 Discussion and summary
The properties exhibited by SN 2012dn makes it an interesting object. SN 2012dn is a slow-declining ( = 0.92) and marginally luminous type Ia supernova. The peak and band absolute magnitudes are = 19.52 and = 19.42, respectively. The light curve evolution of SN 2012dn is different from normal SNe Ia in the following way: (i) the light curve in band peaks after maximum in band, which is opposite to the observed trend for normal type Ia events, (ii) the strength of the primary and secondary maximum is almost similar in SN 2012dn, whereas, in normal SNe Ia the secondary maximum in is found to be 0.5 mag fainter than the primary maximum and (iii) the late phase decline of SN 2012dn in all the bands is faster. Though, it is marginally luminous in the optical bands, it is one magnitude and two magnitudes brighter than normal SNe Ia in UVOT and bands, respectively. It shows very blue and colours. The contribution of UV bands to the bolometric flux is quite high, it evolves from 37% (at 12 days) to 8% (+18 days). At maximum 20% of the bolometric flux is emitted in UV bands, similar to SN 2009dc (Silverman et al., 2011). The peak bolometric luminosity of = 43.27 erg s-1 indicates that 0.82 M⊙ of 56Ni was synthesized in the explosion. The mass of 56Ni for SN 2012dn is on the higher side of 56Ni mass distribution for normal type Ia events.
SN 2012dn shows spectral features characteristic of normal SNe Ia, but with relatively narrow absorption lines. Presence of unburned materials in the ejecta is evident from the C ii 6580 Å absorption feature seen in the pre-maximum spectra. During the pre-maximum and close to maximum phase, to reproduce observed shape of the spectra, the synthetic spectrum code syn++ needs significantly higher blackbody temperature, than those required for normal type Ia events. However, during the post-maximum phase, synthetic spectrum with blackbody temperature similar to normal type Ia fits the observed spectrum well. Photospheric velocity of SN 2012dn, inferred from Si ii 6355 Å absorption line, is marginally greater than those of the super-Chandra SNe: SN 2003fg, SN 2007if, SN 2009dc and lower than SN 2006gz and normal type Ia events. Similar to super-Chandra events, SN 2012dn has slow velocity evolution which is almost parallel to that of SN 2006gz.
Normal SNe Ia are expected to produce only weak emission in the far-UV, but interaction of the supernova ejecta with an extended progenitor such as red-giant star can produce excess of UV photons (Kasen, 2010). Based on the smoothness of the UV light curves and their qualitative similarity to the optical light curves, the higher luminosity of SN 2012dn is associated with photospheric origin (Brown et al., 2014). Further, the presence of stronger features in MUV (below 2700 Å) and optical spectra also supports the photospheric origin for the excess emission, as flux from a hot shock would be relatively smooth and would dilute the photospheric features (Brown et al., 2014; Hamuy et al., 2003). Hence, it is suggested that a higher temperature and lower opacity may contribute to the UV excess rather than a hot, smooth blackbody from shock interaction (Brown et al., 2014). However, the possibility of a structured spectrum with emission and absorption arising due to reprocessing of shock emission or originating from a different composition, is not ruled out. They have emphasized the need for higher quality UV spectra at the earliest possible epochs to probe the mechanism responsible for the excess UV emission. The syn++ fit of the pre-maximum spectra with very high blackbody temperature also supports the photospheric origin for excess luminosity in the early phase.
The light generation by significant interaction of the ejecta with a CSM can also result in increased luminosity of super-Chandra SNe (Taubenberger et al., 2011; Hachinger et al., 2012). Usually presence of CSM around SNe Ia is inferred through either temporal variability (Patat et al., 2007) or statistical analysis of the velocity of narrow absorption features (Sternberg et al., 2011). Supernovae with relatively narrow hydrogen emission lines that are linked to SNe Ia are labelled as “Ia-CSM” objects. Silverman et al. (2013) have investigated the observable signatures of SNe Ia-CSM and argued that at least some SNe Ia arise from the SD channel, since a hydrogen rich CSM is most likely the result of SD scenario. These are the extreme cases of interaction of supernova ejecta with the CSM. The absence of any variable narrow absorption lines and narrow hydrogen emission lines in our medium resolution spectra indicates that appreciable amount of CSM may not be present around SN 2012dn to give rise to higher luminosity.
The decline in the magnitude in 50 days after maximum listed in the Table 7 shows that SN 2012dn has slower decline than normal SNe Ia and SN 1991T and faster than SN 2009dc in all the bands (in band SN 1991T and SN 2012dn have comparable decline rates). Scalzo et al. (2014) have demonstrated that despite having significantly different peak magnitudes, shape of the post-maximum light curve in band of supernova LSQ12gdj, SN 2007if and SN 1991T-like SN 2005M are similar and different from the Ia-CSM objects (refer Fig. 10 of Scalzo et al., 2014). However, presence of blueshifted Na iD and Ca ii H&K absorption in the high resolution spectrum of supernova LSQ12gdj led Scalzo et al. (2014) to postulate that some CSM may be present around LSQ12gdj while its contribution to the luminosity is negligible. Hachinger et al. (2012) have discussed the possibility of the CSM consists of C, O or heavier elements, sufficiently close to the progenitor. The tamped detonation, in which a white dwarf surrounded by an extended envelope explodes (Khokhlov, Müller E. & Höflich, 1993, and references therein), presents a possible progenitor system with CSM. It produces luminous events with longer rise time, which appear much like normal type Ia supernova after maximum. The extended envelope may come from an accreted binary companion. The presence of C feature in the spectra of SN 2012dn till 10 days after maximum indicates possibility of explosion in a C rich environment. The presence of C in the CSM would also provide conducive environment for dust formation, which may explain the observed steepening in the light curve 50 days after maximum. A detailed model is required to check these possibilities.
Acknowledgment
We acknowledge insightful comments from the anonymous referee that helped in improving the paper. NKC is thankful to Indian National Science Academy (INSA), New Delhi for giving an opportunity to work under INSA Visiting Fellowship Scheme (Sanction no. SP/VF-3/2013-14/353) at Indian Institute of Astrophysics (IIA), Bangalore. NKC would like to thank the Director and Dean of IIA for local hospitality and facilities provided. We are thankful to the staff at IIA for their assistance during the observations and to all the observers of the 2-m HCT (IAO-IIA), who kindly provided part of their observing time for supernova observations. This work has made use of public data in the Swift data archive and the NASA/IPAC Extragalactic Database (NED) which is operated by Jet Propulsion Laboratory, California Institute of Technology, under contract with the National Aeronautics and Space Administration. We have also made use of the Lyon-Meudon Extragalactic Database (LEDA), supplied by the LEDA team at the Centre de Recherche Astronomique de Lyon, Observatoire de Lyon. We acknowledge the use of CfA Supernova Archive, which is funded in part by the National Science Foundation through grant AST 0907903; the Online Supernova Spectrum Archive (SUSPECT), initiated and maintained at the Homer L. Dodge Department of Physics and Astronomy, University of Oklahoma; and Weizmann Interactive Supernova Data Repository (WISeREP) maintained by the Weizmann Institute of Science computing center.
References
- Altavilla et al. (2004) Altavilla G. et al., 2004, MNRAS, 349, 1344
- Amanullah et al. (2014) Amanullah R. et al., 2014, ApJ, 788, L21
- Anupama et al. (2005) Anupama G. C., Sahu D. K., Jose J., 2005, A&A, 429, 667
- Arnett (1982) Arnett W. D., 1982, ApJ, 253, 785
- Axelrod (1988) Axelrod T. S., 1988, in Nomoto K., eds, IAU Colloq. 108, Atmospheric Diagnostics in Stellar Evolution: Chemical Peculiarity, Mass Loss and Explosion (Lecture Notes in Physics, 305). Springer, Berlin, p. 375
- Bessell et al. (1998) Bessell M. S., Castelli F., Plez B., 1998, A&A, 333, 231
- Bock et al. (2012) Bock G., Parrent J. T., Howell, D. A., 2012, CBET, 3174, 1
- Branch (1992) Branch D., 1992, ApJ, 392, 35
- Branch et al. (2005) Branch D., Baron E., Hall N., Melakayil M., Parrent J., 2005, PASP, 117, 545
- Branch et al. (2006) Branch D. et al., 2006, PASP, 118, 560
- Brown et al. (2009) Brown P. J. et al., 2009, AJ, 137, 4517
- Brown et al. (2010) Brown P. J. et al., 2010, ApJ, 721, 1608
- Brown et al. (2014) Brown P. J. et al., 2014, ApJ, 787, 29
- Cardelli et al. (1989) Cardelli J. A., Clayton G. C., Mathis J. S., 1989, ApJ, 345, 245
- Chandrasekhar (1931) Chandrasekhar S., 1931, ApJ, 74, 81
- Chotard et al. (2011) Chotard N. et al., 2011, A&A, 529, L4
- Conley et al. (2006) Conley A. et al., 2006, AJ, 132, 1707
- Copin et al. (2012) Copin Y. et al., 2012, Astron. Telegram, 4253, 1
- Filippenko et al. (1992a) Filippenko A. V. et al., 1992a, ApJ, 384, L15
- Filippenko et al. (1992b) Filippenko A. V. et al., 1992b, AJ, 104, 1543
- Filippenko (1997) Filippenko A. V., 1997, ARA&A, 35, 309
- Fisher (2000) Fisher A., 2000, PhD thesis, Univ. Oklahoma
- Folatelli et al. (2010) Folatelli G. et al., 2010, AJ, 139, 120
- Folatelli et al. (2012) Folatelli G. et al., 2012, ApJ, 745, 74
- Foley et al. (2013) Foley R. J. et al., 2013, ApJ, 767, 57
- Freedman et al. (2001) Freedman W. L. et al., 2001, ApJ, 553, 47
- Gamezo et al. (2005) Gamezo V. N., Khokhlov A. M., Oran E. S., 2005, ApJ, 623, 337
- Ganeshalingam et al. (2011) Ganeshalingam M., Li W., Filippenko A. V., 2011, MNRAS, 416, 2607
- Goldhaber et al. (2001) Goldhaber G. et al., 2001, ApJ, 558, 359
- Hachinger et al. (2012) Hachinger S., Mazzali P., Taubenberger S., Fink M., Pakmor R., Hillebrandt W., Seitenzahl R., 2012, MNRAS, 427, 2057
- Hamuy et al. (1996) Hamuy M., Phillips M. M., Suntzeff N. B., Schommer R. A., Maza J., Aviles R., 1996, AJ, 112, 2391
- Hamuy et al. (2003) Hamuy M. et al., 2003, Nature, 424, 651
- Hicken et al. (2007) Hicken M., Garnavich P. M., Prieto J. L., Blondin S., DePoy D. L., Kirshner R. P., Parrent J., 2007, ApJ, 669, L17
- Hillebrandt & Niemeyer (2000) Hillebrandt W., Niemeyer J. C., 2000, ARA&A, 38, 191
- Howell et al. (2006) Howell D. A. et al., 2006, Nature, 443, 308
- Howell (2011) Howell D. A., 2011, Nature Com, 2, 350
- Jeffery & Branch (1990) Jeffery D. J., Branch D., 1990, in Wheeler J. C., Piran T., Weinberg S., eds, Jerusalem Winter School for Theoretical Physics Vol. 6, Supernovae. World Scientific, Singapore, p. 149
- Jeffery et al. (1992) Jeffery D. J., Leibundgut B., Kirshner R. P., Benetti S., Branch D., Sonneborn G., 1992, ApJ, 397, 304
- Jha et al. (2006) Jha S. et al., 2006, AJ, 132, 189
- Jha et al. (2007) Jha S., Riess A. G., Krishner R. P., 2007, ApJ, 659, 122
- Kasen (2006) Kasen D., 2006, ApJ, 649, 939
- Kasen et al. (2009) Kasen D., Röpke F. K., Woosley S. E., 2009, Nature, 460, 869
- Kasen (2010) Kasen D., 2010, ApJ, 708, 1025
- Khan et al. (2011) Khan R., Stanek K. Z., Stoll R., Prieto J. L., 2011, ApJ, 737, L24
- Khokhlov et al. (1991) Khokhlov A., 1991, A&A, 245, 114
- Khokhlov et al. (1993) Khokhlov A., Müller E., Höflich P., 1993, A&A, 270, 223
- Krisciunas et al. (2009) Krisciunas K. et al., 2009, AJ, 138, 1584
- Krisciunas et al. (2011) Krisciunas K. et al., AJ, 2011, 142, 74
- Landolt (1992) Landolt A. U., 1992, AJ, 104, 340
- Leibundgut et al. (1993) Leibundgut B. et al., 1993, AJ, 105, 301
- Leibundgut (2000) Leibundgut B., 2000, A&ARv, 10, 179
- Li et al. (2003) Li W. et al., 2003, PASP, 115, 453
- Li et al. (2011) Li W. et al., 2011, MNRAS, 412, 1441
- Lira et al. (1998) Lira P. et al., 1998, AJ, 115, 234
- Maeda & Iwamoto (2009) Maeda K., Iwamoto K., 2009, MNRAS, 394, 239
- Maeda et al. (2009) Maeda K., Kawabata K., Li W., Tanaka M., Mazzali P. A., Hattori T., Nomoto K., Filippenko A. V., 2009, ApJ, 690, 1745
- Maeda et al. (2010) Maeda K. et al., 2010, Nature, 466, 82
- Milne et al. (2001) Milne P. A., The L.-S., Leising M. D., 2001, ApJ, 559, 1019
- Nadyozhin (1994) Nadyozhin D. K., 1994, ApJS, 92, 527
- Nozawa et al. (2011) Nozawa T., Maeda K., Kozasa T., Tanaka M., Nomoto K., Umeda H., 2011, ApJ, 736, 45
- Parrent et al. (2011) Parrent J. T. et al., 2011, ApJ, 732, 30
- Parrent & Howell (2012) Parrent J. T., Howell D. A., 2012, CBET, 3174, 2
- Pastorello et al. (2007) Pastorello A. et al., 2007, MNRAS, 376, 1301
- Patat et al. (2007) Patat F. et al., 2007, Science, 317, 924
- Perlmutter et al. (1997) Perlmutter S. et al., 1997, ApJ, 483, 565
- Perlmutter et al. (1999) Perlmutter S. et al., 1999, ApJ, 517, 565
- Phillips et al. (1992) Phillips M. M., Wells L. A., Suntzeff N. B., Hamuy M., Leibundgut B., Kirshner R. P., Foltz C. B., 1992, AJ, 103, 1632
- Phillips (1993) Phillips M. M., 1993, ApJ, 413, L105
- Phillips et al. (1999) Phillips M. M., Lira P., Suntzeff N. B., Schommer R. A., Hamuy M., Maza J., 1999, AJ, 118, 1766
- Pinto & Eastman (2000) Pinto P. A., Eastman R. G., 2000, ApJ, 530, 757
- Poole et al. (2008) Poole T. S. et al., 2008, MNRAS, 383, 627
- Riess et al. (1996) Riess A. G., Press W. H., Kirshner R. P., 1996, ApJ, 473, 88
- Riess et al. (1998) Riess A. G. et al., 1998, AJ, 116, 1009
- Reindl et al. (2005) Reindl B., Tammann G. A., Sandage A., Saha A., 2005, ApJ, 624, 532
- Sahu et al. (2006) Sahu D. K., Anupama G. C., Prabhu, 2006, MNRAS, 366, 682
- Sahu et al. (2008) Sahu D. K. et al., 2008, ApJ, 680, 580
- Scalzo et al. (2010) Scalzo R. A. et al., 2010, ApJ, 713, 1073
- Scalzo et al. (2012) Scalzo R. A. et al., 2012, ApJ, 757, 12
- Scalzo et al. (2014) Scalzo R. A. et al. 2014, arXiv:1404.1002
- Schlegel et al. (1998) Schlegel D. J., Finkbeiner D. P., Davis M., 1998, ApJ, 500, 525
- Schmidt et al. (1994) Schmidt B. P., Kirshner R. P., Leibundgut B., Wells L. A., Porter A. C., Ruiz-Lapuente P., Challis P., Filippenko A. V., 1994, ApJ, 434, L19
- Silverman et al. (2011) Silverman J. M., Ganeshalingam M., Li W., Filippenko A. V., Miller A. A., Poznanski D., 2011, MNRAS, 410, 585
- Silverman et al. (2013) Silverman J. M. et al., 2013, ApJS, 207, 3
- Sobolev (1957) Sobolev V. V., 1957, SvA, 1, 678
- Stalin et al. (2008) Stalin C. S., Hegde M., Sahu D. K., Parihar P. S., Anupama G. C., Bhatt B. C., Prabhu T. P., 2008, BASI, 36, 111
- Sternberg et al. (2011) Sternberg A. et al., 2011, Science, 333, 856
- Stritzinger et al. (2006) Stritzinger M., Mazzali P. A., Sollerman J., Benetti S., 2006, 460, 793
- Sullivan et al. (2010) Sullivan M. et al., 2010, MNRAS, 406, 782
- Suntzeff (1996) Suntzeff N. B., 1996, in McCray R., Wang Z., eds, Supernovae and Supernovae Remnants. Cambridge Univ. Press, Cambridge, p. 41
- Taubenberger et al. (2008) Taubenberger S. et al., 2008, MNRAS, 385, 75
- Taubenberger et al. (2011) Taubenberger S. et al., 2011, MNRAS, 412, 2735
- Taubenberger et al. (2013) Taubenberger S. et al., 2013, MNRAS, 432, 3117
- Theureau et al. (1998) Theureau G. et al., 1998, A&AS, 130, 333
- Thomas, Nugent & Meza (2011) Thomas R. C., Nugent P. E., Meza J. C., 2011, PASP, 123, 237
- Turatto et al. (2003) Turatto M., Benetti S., Cappellaro E., 2003, in Hillebrandt W., Leibundgut B., eds, Proc. ESO/MPA/MPE Workshop, From Twilight to Highlight: The Physics of Supernovae. Springer, Berlin, p. 200
- Yamanaka et al. (2009) Yamanaka M. et al., 2009, ApJ, 707, L118
- Yoon & Langer (2005) Yoon S. C., Langer N., 2005, A&A, 435, 967
- Wang et al. (2006) Wang X., Wang L., Pain R., Zhou X., Li Z., 2006, ApJ, 645, 488
- Wang et al. (2009) Wang X. et al., 2009, ApJ, 697, 380