MINERvA Collaboration
Charged pion production in interactions
on hydrocarbon at = 4.0 GeV
Abstract
Charged pion production via charged-current interactions on plastic scintillator (CH) is studied using the MINERvA detector exposed to the NuMI wideband neutrino beam at Fermilab. Events with hadronic invariant mass GeV and GeV are selected in separate analyses: the lower cut isolates single pion production, which is expected to occur primarily through the resonance, while results from the higher cut include the effects of higher resonances. Cross sections as functions of pion angle and kinetic energy are compared to predictions from theoretical calculations and generator-based models for neutrinos ranging in energy from 1.5–10 GeV. The data are best described by calculations which include significant contributions from pion intranuclear rescattering. These measurements constrain the primary interaction rate and the role of final state interactions in pion production, both of which need to be well understood by neutrino oscillation experiments.
pacs:
13.15.+g, 25.80.-e, 13.75.GxI Introduction
Charged-current pion production by few-GeV neutrinos interacting with nuclei (e.g. carbon, oxygen, and argon) is an important process for current and future long baseline neutrino oscillation experiments Abe et al. (2011); Ayres et al. (2004); Adams et al. (2013). Recent measurements highlight the important role that the nuclear medium plays in the production and propagation of hadrons produced in neutrino-nucleus interactions Fiorentini et al. (2013); Fields et al. (2013); Aguilar-Arevalo et al. (2010, 2013a). These experiments find cross section distortions which are absent in scattering from free nucleons and affect both event rates and final state kinematics. These effects impact oscillation experiments, such as T2K Abe et al. (2014a) and MiniBooNE Aguilar-Arevalo et al. (2013b), that rely on the charged-current quasielastic (CCQE) interaction on bound neutrons, , to reconstruct the neutrino energy. Although this is a relatively well-understood reaction with simple kinematics, the reconstruction and interpretation of events that appear quasielastic are complicated by the presence of the nuclear medium. For example, if a charged-current interaction produces a single (CC1), e.g., , and the pion is absorbed by the target nucleus in a Final State Interaction (FSI), the event will mimic the quasielastic topology. In such a case, the reconstructed neutrino energy may be significantly underestimated Lalakulich et al. (2012) and, in the absence of an accurate FSI model, this will lead to a bias in the measured oscillation parameters. Therefore, both pion production and the effect of the nuclear environment on that production must be accurately determined.
In addition to being absorbed, pions may undergo elastic, inelastic, or charge-exchange scattering before exiting the nucleus. Neutrino experiments model these processes with Monte Carlo event generators that use particle cascade algorithms constrained by cross section measurements of pion absorption and scattering on various target nuclei. This technique assumes that interactions of pions created within a nucleus are identical to those of accelerator beam pions, an assumption which can be probed by measurements of pion production in electron- and neutrino-scattering experiments. The only existing electron-scattering experiment on heavy nuclei Qian et al. (2010) examined the “color transparency” of pion production, but was done at higher energies than those that are relevant to neutrino oscillation experiments; hadronic invariant masses (pion kinetic energies) accessed were greater than 2.1 GeV (2 GeV).
The earliest neutrino CC1 measurements used hydrogen or deuterium targets Bell et al. (1978); Radecky et al. (1982); Kitagaki et al. (1986); Allen et al. (1986); Allasia et al. (1990) or reported neutrino-nucleon cross sections extracted from nuclear target data by model-dependent corrections Block et al. (1964); Budagov et al. (1969); Grabosch et al. (1989). These data, particularly the ANL Radecky et al. (1982) and BNL Kitagaki et al. (1986) data, are used to constrain the neutrino-nucleon pion production models contained in event generators, but these constraints are fairly weak because the ANL and BNL measurements differ by up to 40% in normalization. A recent re-analysis of the two experiments prefers the ANL measurement Wilkinson et al. (2014).
There are a few measurements of CC1 on nuclear targets, which provide insight into the nuclear effects important to neutrino oscillation experiments. The K2K Rodriguez et al. (2008) and MiniBooNE Aguilar-Arevalo et al. (2009a) collaborations measured the CC1 to CCQE cross section ratio on carbon and mineral oil (CH2) targets, respectively. MiniBooNE also reported an absolute cross section measurement of CC1 on a nuclear target (CH2) for GeV Aguilar-Arevalo et al. (2011). This measurement is primarily sensitive to pions with kinetic energies from 20 to 400 MeV produced by decays. The kinetic energy spectrum of charged pions reported by MiniBooNE does not show the suppression of pions predicted by beam-based models of FSI O. Lalakulich and U. Mosel (2013); E. Hernández, J. Nieves, and M.J. Vicente Vacas (2013); Rodrigues (2015), particularly around 160 MeV where the total pion-carbon cross section peaks and pion absorption is greatest. At present, oscillation experiments must account for this discrepancy by assigning large systematic errors on the size of pion FSI Abe et al. (2014b).
The analyses presented here measure flux-integrated differential cross sections in pion kinetic energy and pion angle with respect to the neutrino direction . The signal is defined to be a charged-current interaction in the MINERvA tracking detector (mostly CH). The CC1 (CCN) measurement signal definition requires that exactly one (at least one) charged pion exits the target nucleus. There is no restriction on neutral pions or other mesons. The CC1 (CCN) signal is also restricted to and hadronic invariant mass () GeV. Charged-current coherent pion production is included in the signal definitions.
These are the first such measurements on a nuclear target in the few-GeV energy range that is important for the NOvA Ayres et al. (2004) and DUNE Adams et al. (2013) oscillation experiments. The CC1 measurement is dominated by the excitation of the P33 resonance, which facilitates comparison to theoretical calculations, neutrino event generators, and the MiniBooNE measurement. The CCN measurement, of which the CC1 events are a subset, is complementary since it samples about six resonances and additional nonresonant processes.
The remainder of this paper is organized as follows. Section II describes the MINERvA experiment and the NuMI beam line. Section III discusses the simulations used to analyze data. The event reconstruction, including track reconstruction, particle identification, and the hadronic recoil energy measurement, is described in Section IV. The event selection criteria for both analyses are provided in Section V. Section VI describes the procedure used to extract cross sections from the selected events. Finally, Section VII presents and discusses the measured cross sections, and Section VIII summarizes this paper.
II MINERvA Experiment
The MINERvA experiment combines a fine-grained tracking detector with the high-intensity NuMI beam line Anderson et al. (1998) and the MINOS near detector Michael et al. (2008). The neutrino beam is created by directing 120 GeV protons onto a graphite target, producing charged particles (mostly pions and kaons) which are focused into a beam by two magnetic horns. Downstream of the horns, most of the pions and kaons decay within the 675 m helium-filled decay pipe to produce neutrinos. Approximately 97% of the muon neutrinos that enter MINERvA are produced by pion decay, with the remainder produced from kaon decay.
The MINERvA detector consists of a central tracking volume preceded by nuclear targets, which are not used in this analysis, and surrounded by electromagnetic and hadronic calorimeters. In the tracking volume, triangular polystyrene scintillator strips with a 1.7 cm strip-to-strip pitch are arranged into planes arrayed perpendicularly to the horizontal axis, which is inclined by 3.4∘ relative to the beam direction. Three plane orientations, at and relative to the vertical axis, enable unambiguous 3-dimensional reconstruction of the neutrino interaction point and charged particle tracks. Each scintillator strip contains a wavelength-shifting fiber that is read out by a multi-anode photomultiplier tube. The 3.0 ns timing resolution of the readout electronics is adequate for separating multiple interactions within a single beam spill. The MINOS near detector, located 2 m downstream of the MINERvA detector, is used to reconstruct muon momentum and charge. More information on the design, calibration, and performance of the MINERvA detector, including the elemental composition of the tracking volume, is provided in Ref. Aliaga et al. (2014).
The data for this measurement were collected between March 2010 and April 2012 and correspond to an integrated protons on target (POT). For these data the horn current was configured to produce a muon neutrino beam, and the MINOS detector’s magnet polarity was set to focus negative muons.
III Experiment Simulation
The neutrino beam is simulated by a GEANT4-based model Agostinelli et al. (2003); Allison et al. (2006) that is tuned to agree with hadron production measurements on carbon Alt et al. (2007); Lebedev (2007) by the procedure described in Ref. Fields et al. (2013). Uncertainty on the neutrino flux is determined by the precision in these measurements, uncertainties in the beam line focusing system and alignment Pavlovic (2008), and comparisons between different hadron production models in regions not covered by the hadron production data referenced above. The integrated neutrino flux over the range GeV is estimated to be . Table 1 lists the flux as a function of energy.
| (GeV) | |||||||||
|---|---|---|---|---|---|---|---|---|---|
| Flux (/cm2/POT ()) | |||||||||
| (GeV) | |||||||||
| Flux (/cm2/POT ()) |
The MINERvA detector response is also simulated by a GEANT4-based model. The muon energy loss scale of the detector is known to within 2% by requiring agreement between data and simulation of both the photon statistics and the reconstructed energy deposited by momentum-analyzed throughgoing muons. Calorimetric corrections used to reconstruct the energy of hadronic showers are determined from the simulation by the procedure described in Ref. Aliaga et al. (2014). The uncertainties on the hadron interaction models in GEANT4 are determined to be 10% by external data Ashery et al. (1981); Allardyce et al. (1973); Saunders et al. (1996); T.S.H. Lee and R.P. Redwine (2002). The tracking efficiency and energy response of single hadrons, as well as the scintillation Birks constant, are determined from measurements made with a scaled-down replica of the MINERvA detector in a low energy hadron test beam Aliaga et al. (2015). The response of the MINOS near detector to muons is determined by a tuned GEANT-based simulation Michael et al. (2008).
Neutrino interactions are simulated using the GENIE 2.6.2 neutrino event generator Andreopoulos et al. (2010). Non-coherent interactions are treated as neutrino-nucleon scattering within a relativistic Fermi gas. The nucleon momentum distribution is modified with a high-energy tail to account for nucleon-nucleon interactions, but interactions with correlated nucleon pairs are not included in the simulation. Pauli-blocking is applied to quasielastic and elastic scattering, but not to resonance baryon production. The structure functions in the deep inelastic scattering (DIS) model are modified to reproduce the shadowing, anti-shadowing, and EMC effects observed in charged-lepton nuclear scattering data.
Almost all pion-production events observed in MINERvA are due to baryon resonance production, nonresonant pion production (including DIS), and coherent pion production. For baryon resonance production at GeV, the formalism of Rein-Sehgal Rein and Sehgal (1981) is used with modern resonance properties Beringer et al. (2012) and an axial mass GeV. However, GENIE differs from Rein-Sehgal in a couple ways. Resonance interference and lepton mass terms in the cross section calculation are not included. Most signficantly, the angular spectrum of the decay is nominally isotropic in GENIE; this analysis instead reweights GENIE such that the decay angular anisotropy is half that predicted by Rein-Sehgal. Excursions from isotropic to the full Rein-Sehgal anisotropic prediction are included as a systematic uncertainty. Nonresonant pion production is simulated using the Bodek-Yang model Bodek et al. (2005) and is constrained below GeV by neutrino-deuterium bubble chamber data. Coherent pion production is described according to the model of Rein-Sehgal modified with lepton mass terms D. Rein and L.M. Sehgal (2007). Uncertainties on the components of the neutrino-interaction model are provided by GENIE.
Pion and nucleon FSI processes are modeled in GENIE using an effective intranuclear cascade model Dytman and Meyer (2011), called the “hA” model, that simulates the full cascade as a single interaction and tunes the overall interaction rate to hadron-nucleus total reaction cross section data. For light nuclei such as carbon, a single interaction happens for a large fraction of the events. The final state particle multiplicity and kinematic distributions are also tuned to data. This model has good agreement with a wide range of data from hadron-nucleus scattering experiments for many targets. Uncertainties in the FSI model are evaluated by varying its parameters within measured uncertainties T.S.H. Lee and R.P. Redwine (2002); Ashery et al. (1981).
IV Event Reconstruction
Track reconstruction and the calorimetric energy measurement are the most important components of CCN event reconstruction. The reconstruction techniques are fully described in Refs. Aliaga et al. (2014); Eberly (2014); the most important details are presented here. Before any reconstruction is performed, the calibrated energy deposits within the scintillator strips are grouped into objects called clusters according to timing and spatial proximity.
IV.1 Track Reconstruction
Charged particle tracks are reconstructed by applying two pattern recognition algorithms to the clusters found within the tracking volume and downstream calorimeters. The first algorithm finds lines separately in each of the three plane orientations (views), then attempts to merge one line from each view into a three dimensional track. Once all accepted three-view combinations are found, additional tracks are made from compatible two-view combinations if there are overlapping clusters within the unused view. All tracks are fit with a Kalman filter that includes multiple scattering. The tracks found by this algorithm are limited to a polar angle and must traverse at least nine scintillator planes, which corresponds to a threshold of about 80 MeV.
In order to lower the pion energy tracking threshold, a second track pattern recognition algorithm is employed. First, all possible combinations of four clusters located within consecutive scintillator planes are formed into track seeds. Next, two seeds are merged into a longer seed if they share at least one cluster, have similar polar angles, fit well to a straight line, and pass a Kalman filter fit. Merged seeds may be merged with additional seeds, and merging continues until all possible merges are exhausted. All merged seeds are retained as reconstructed tracks. This algorithm is unable to find tracks with a polar angle , but can reconstruct particles that traverse as few as five scintillator planes, resulting in a threshold of 50 MeV.
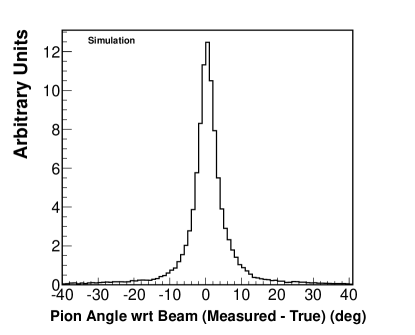
The combined efficiency of the two track pattern recognition algorithms to find tracks for pions with MeV in simulated CCN events with GeV is 42%. The primary reasons for pion tracking inefficiency are secondary interactions in the detector and activity in high-multiplicity events that obscures the pion. Figure 1 shows the angular resolution of pion tracks in CCN events selected by the event selection described in Section V.
Neutrino event candidates are reconstructed by finding the longest track in the event, then searching for additional tracks that share a common vertex with the longest track. Kinked tracks, which are often the result of secondary interactions, are reconstructed by iteratively searching for additional tracks starting at the endpoint of the previously found tracks. Tracks that exit the downstream end of the MINERvA detector are matched to tracks in MINOS found by the independent MINOS reconstruction; if a match is found, it is identified as a muon track and the event is retained as a charged-current interaction candidate. Additional tracks that share a common vertex with the muon track are hadron track candidates. The MINOS match requirement is greater than 90% efficient for muons with momenta greater than 1.5 GeV and angles with respect to the beam less than 20∘. The muon energy and charge reconstruction use the reconstructed track curvature and range in MINOS.
IV.2 Charged Pion Identification
All hadron track candidates that are fully contained within the MINERvA detector are classified as pion-like or proton-like by a particle identification algorithm that fits the pattern of energy deposition along each track to the Bethe-Bloch formula under pion and proton hypotheses. The fit is allowed to ignore the last cluster on the track or extend up to two planes beyond the end of the track without penalty, but is otherwise consistent with the range of the track. This is done to account for mis-reconstruction of the track end position. Contamination from overlapping vertex activity biases pion track fits towards the proton hypothesis; this is avoided by finding the portion of the track with an energy profile that is consistent with multiple overlapping particles and not including it in the fit.
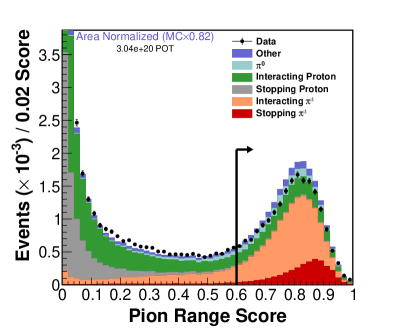
The pion range score is calculated from the of the best fit under each hypothesis by the equation
| (1) |
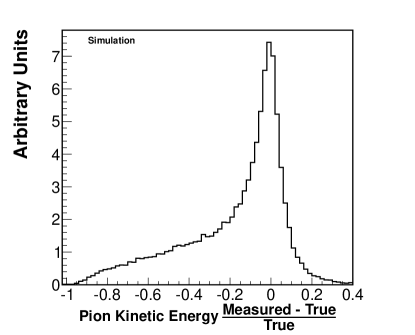
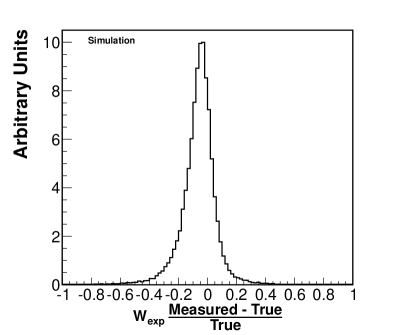
where is the pion best fit per degree of freedom and is the proton best fit per degree of freedom. Figure 2 presents the distribution of hadronic track candidates in events passing the muon and calorimetric CCN selections described in Section V. Tracks with are identified as charged pion candidates. The kinetic energy of the best pion fit determines the reconstructed , which can be as low as 35 MeV when the best fit does not include the last cluster on the track. The resolution is shown in Fig. 3.
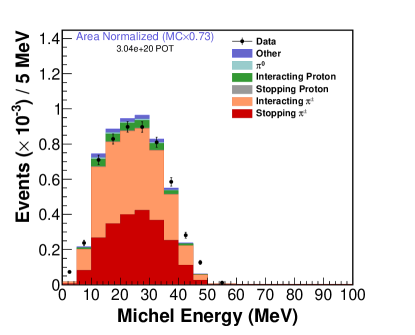
Charged pions are also identified by the Michel electron from the decay chain. Michel candidates are found by searching for delayed energy deposits in each view within a cm2 (transverse longitudinal) box centered on the end position of each hadron track. The large search box accounts for track mis-reconstruction and the potential size of the Michel shower, but will often include energy from unrelated neutrino-induced activity that occurs later in the beam spill. To avoid this, the total visible energy of the Michel candidate must be less than 55 MeV and the total number of scintillator strips cannot exceed 35. These restrictions are motivated by the well-understood kinematics of muon decay. Figure 4 shows a comparison of the reconstructed Michel visible energy spectrum in data and simulation for pion candidates with in CCN candidate events. The means of the data and simulation are consistent within the 3% uncertainty on the detector energy response to electromagnetic particles. Michel candidates are associated with an at-rest with an efficiency of 80%, as validated in data with stopped muons from upstream neutrino interactions.
IV.3 Neutrino Energy Reconstruction
The neutrino energy in CCN events can be reconstructed kinematically using the reconstructed four-momentum of the muon and pion, but this requires the assumptions that there is only one nucleon in the final state and that the pion did not experience FSI. Instead, this analysis employs a calorimetric energy reconstruction that utilizes the final-state recoil energy
| (2) |
which is reconstructed as the calorimetrically-weighted sum of the visible energy not associated with the muon track, i.e.
| (3) |
where is the non-muon reconstructed energy in subdetector (the tracking detector, downstream electromagnetic calorimeter, downstream hadronic calorimeter, and the outer calorimeter), is a calorimetric constant determined by the fraction of passive material in subdetector , and and are model-dependent parameters, tuned to the true using a simulated charged-current interaction sample, that account for undetected energy from neutral and exiting particles.
Neutrino energy and other kinematic quantities are calculated from and the reconstructed muon four-momentum using the following equations:
| (4) | |||||
| (5) | |||||
| (6) |
Here, ) is the proton (muon) mass, and are the reconstructed momentum and angle of the muon with respect to the beam, and the is calculated with the assumption of a single free target nucleon at rest. Of the three quantities above, is most important for this analysis. The resolution in selected CCN events are shown in Fig. 5. The resolution on is about 8.5% with a bias of . The bias is the result of using an inclusive sample of charged-current events, which have a higher average multiplicity than CCN events restricted to GeV, to tune .
V Event Selection
Reconstructed CC1 (CCN) events are required to contain one negatively-charged muon track and exactly one (at least one) charged-pion track joined at a common vertex. The event vertex is restricted to occur within the central 110 planes of the scintillator tracking region and at least 22 cm from any edge of the planes. These requirements define a fiducial region with a mass of 5.57 metric tons, containing nucleons.
Charged pion tracks are identified by a containment requirement and two particle identification selections. Each pion track is required to begin at the event vertex and stop in either the tracking or electromagnetic calorimeter regions of MINERvA, which restricts the maximum pion kinetic energy to 350 MeV. The particle identification selections require that there exist at least one track with and an associated Michel electron candidate. The Michel selection disfavors both negatively-charged pions, which tend to be captured on a nucleus before decaying, and pions that experience secondary interactions in the detector. The CC1 (CCN) analysis requires exactly (at least) one reconstructed charged pion track.
The reconstructed is required to be between 1.5 and 10 GeV in both analyses. The lower bound of this selection is made to match the MINOS muon acceptance threshold. The upper bound reduces flux uncertainties, which are largest above 10 GeV. The CC1 analysis selects events with GeV, while the CCN analysis selects GeV.
After all selections, 3474 (5410) events remain in the CC1 (CCN) analysis. Figure 6 shows the selected and for both analyses. There is a large normalization difference between simulation and data that is approximately the size of the total uncertainty in the prediction. This uncertainty is dominated by the uncertainty on the normalization of the resonance production cross section in neutrino-nucleon scattering, which GENIE determines by combining the ANL and BNL pion production data discussed in Section I. The cross section extraction procedure (see Section VI) is designed to minimize the influence of this model uncertainty on the measured cross section distributions.

The selected pions are predicted to be 99.6% (98.6%) in the CC1 (CCN) analysis because can only arise from FSI at low and are unlikely to survive the Michel electron requirement. The selection efficiency of charged pions between 35 MeV and 350 MeV in signal events is determined by simulation to be 4% (3%) in the CC1 (CCN) analysis. The largest reductions in the selection efficiency are caused by the MINOS-matched muon requirement, the pion track reconstruction inefficiency, and the Michel electron selection; the latter two are particularly affected by secondary pion scattering and absorption in the detector. The signal purity of the CC1 (CCN) event sample is 77% (86%). Table 2 summarizes the background components in both analyses.
| Background | CC1 Sample (%) | CCN Sample (%) |
|---|---|---|
| GeV ( GeV) | 16.7 | 6.05 |
| Particle Mis-ID | 4.12 | 6.67 |
| Multiple Charged Pions | 1.61 | N/A |
| GeV | 0.45 | 0.84 |
| Outside Fiducial Volume | 0.16 | 0.17 |
| Not CC | 0.13 | 0.18 |
| Total | 23.2 | 13.9 |
VI Cross Section Extraction
The CC1 flux-integrated differential cross section per nucleon for kinematic variable ( and in this analysis) in bin is
| (7) |
where is the index of a reconstructed bin, is an unfolding function that calculates the contribution to true bin from reconstructed bin , is the number of selected events, is the predicted number of background events, is the signal charged-pion selection efficiency, is the number of nucleons in the fiducial volume, is the flux prediction integrated between 1.5 and 10 GeV, and is the width of bin . The CCN analysis reports a slightly different observable because multiple-pion events are included in the signal:
| (8) |
Variable definitions are the same as those in (7), except that and are the number of selected charged pions and the predicted number of background charged pions in bin , respectively. The integral of (8) over yields the total number of charged pions divided by the integrated flux and number of target nucleons.
VI.1 Background Subtraction
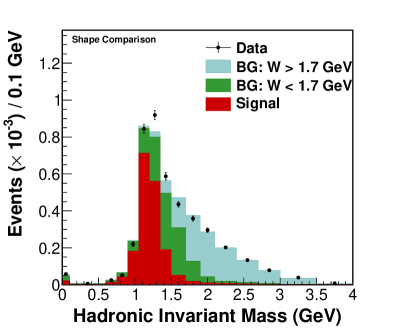
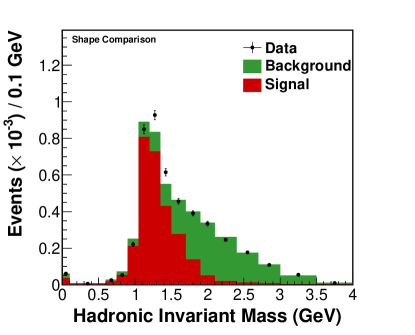
After event selection, the dominant background comes from pion production at higher and comprises 17% (6%) of the CC1 (CCN) selected sample. The total background is estimated using the reconstructed distribution, in which each entry in the distribution is a charged pion candidate chosen by the event selection, excluding the cut on . The simulated distribution is divided into signal and background templates in bins of and ; the CC1 analysis further separates the background into two templates with true less than and greater than 1.7 GeV, which is the value at which GENIE turns off resonance production. The normalizations of the signal and background templates are the fit parameters in maximum likelihood fits to the measured distributions; each bin of and is fit independently. The fits are restricted to between 0.6 GeV and 2.4 GeV (3 GeV) in the CC1 (CCN) analysis. The templates after fitting, integrated over all and , are shown in Fig. 7. The detector calorimetric response uncertainty covers the shape discrepancy that remains after the fit and is the dominant systematic uncertainty in the background estimate.
The fit results are used to calculate weights that adjust the nominal predicted background. In both analyses, the fit reduces the absolute background while increasing the prediction for the amount of background relative to the signal. The fit procedure reduces the sensitivity of the background estimate to uncertainties in the simulation’s cross section and FSI models, but increases sensitivity to uncertainties in the detector response and statistical fluctuations in the data. The cumulative effect is positive, and the total uncertainty on the background prediction is reduced from 32% to 24% in the CC1 analysis with a similar reduction in the CCN analysis. More detail on the background subtraction procedure is provided in Ref. Eberly (2014).
VI.2 Unfolding
The background-subtracted reconstructed and distributions are unfolded using a Bayesian procedure D’Agostini (1995) with four iterations. The unfolding migration matrix, which determines the probability that the true value of a quantity corresponds to a reconstructed value, is derived from simulation. It is insensitive to FSI effects because the true values of and are calculated at the point where the pion exits the nucleus. Also, the unfolding procedure is not sensitive to normalization uncertainties, including the large uncertainty in the resonance production cross section normalization.
The unfolding generally migrates events from low to high bins, accounting for the tendency of the reconstruction to report a momentum that is too small for pions that interact inelastically in the detector. The effect of unfolding on the distribution is small except for the bin at 90∘, where the pion tracking efficiency is poor. Some of the pions in the neighboring bins are actually 90∘ pions that scatter close to the event vertex, such that the track reconstruction measures the scattered pion direction. The unfolding procedure relies on the GEANT4 interaction model to estimate this effect.
VI.3 Efficiency Correction
The efficiency and acceptance correction in Equations 7 and 8 is calculated according to the equation
| (9) |
where is the simulated number of signal pions retained by the event selection, is the total number of signal pions according to simulation, and corrects for discrepancies in the muon acceptance between data and the simulation. Data is used to estimate other efficiencies, such as the acceptance of the Michel electron selection and the hadron reconstruction efficiencies, but these are found to match well to simulation and are included as a systematic uncertainty rather than as a correction. The muon acceptance is compared in data and simulation by forming samples of exiting muon tracks in MINERvA and MINOS that point toward the other detector, then searching for a matching track in the other detector. The resulting corrections, which are all between 0.91 and 0.99, are measured separately for each data run period so that the time dependence of beam-intensity effects are accounted for.
VI.4 Systematic Uncertainties
The cross section extraction procedure uses the simulation to estimate backgrounds, detector resolution and acceptance, selection efficiencies, and neutrino flux. The systematic uncertainties on these quantities are evaluated by shifting each parameter in the simulation within its uncertainty to produce a new simulated sample, referred to as an alternative simulation. The cross sections are remeasured using each alternative simulation and a covariance matrix is formed from the results. The covariance matrix for a single systematic uncertainty derived from alternative simulations is calculated as
| (10) |
where and indicate bins of the differential cross section and is the measurement of the differential cross section in bin using alternative simulation . The definition of changes according to the value of . If there is only one alternative simulation, then is the value of the cross section measured from the nominal simulation. Otherwise, is the mean of the measured cross section in all alternative simulations. The total covariance matrix is the sum of calculated for each systematic uncertainty.
The computational cost required to produce a new simulated sample for each systematic uncertainty is prohibitive. Instead, this is effectively done for many uncertainties by reweighting the simulation or, in the case of detector resolution and energy scale uncertainties, modifying the measured values event-by-event. The effects of a few parameters, such as the effective nuclear size and quark hadronization time in GENIE, cannot be correctly estimated by either of these techniques. In these cases, a new simulated sample is generated with the modified parameters.
Shape systematic uncertainties are reported for each measurement in order to mitigate certain large normalization uncertainties, such as the neutrino flux uncertainty. The shape uncertainties are calculated by normalizing the cross section measurement in each alternative simulation so that the integrated cross sections measured in the alternative simulation and nominal simulation are equal. The shape covariance matrix is calculated using the renormalized alternative simulation measurements.
Table 3 lists the systematic uncertainties in the CC1 analysis grouped according to the uncertainty source; the CCN analysis uncertainties are similar. The total systematic uncertainty is between 16% and 22%, while the shape uncertainty ranges from from 3% to 11% per bin. For comparison, the statistical uncertainties are approximately 3% to 14%. The total uncertainties are generally systematics-limited, while the shape uncertainties are statistics-limited; the one notable exception to this trend is the kinetic energy measurement in the lowest bin (35–55 MeV), which is always statistics-limited.
| (MeV) | I | II | III | IV | V | Total |
| 35 - 55 | 15 (9.7) | 9.7 (2.8) | 6.8 (2.9) | 8.5 (0.5) | 5.5 (2.2) | 22 (11) |
| 55 - 75 | 12 (4.4) | 9.7 (3.3) | 8.5 (4.4) | 8.6 (0.4) | 4.8 (1.4) | 20 (7.2) |
| 75 - 100 | 9.9 (4.6) | 8.9 (2.3) | 6.4 (2.8) | 9.0 (0.4) | 3.8 (0.6) | 18 (5.9) |
| 100 - 125 | 10 (3.4) | 6.8 (1.7) | 4.9 (1.4) | 9.2 (0.7) | 3.0 (0.7) | 17 (4.2) |
| 125 - 150 | 11 (3.0) | 6.7 (1.6) | 5.0 (1.5) | 8.9 (0.2) | 3.1 (0.4) | 17 (3.7) |
| 150 - 200 | 11 (3.3) | 6.9 (2.2) | 3.1 (2.8) | 9.1 (0.4) | 2.7 (1.6) | 16 (5.1) |
| 200 - 350 | 16 (7.2) | 8.5 (1.5) | 4.3 (3.1) | 9.2 (0.3) | 2.9 (1.2) | 21 (8.0) |
| (degree) | I | II | III | IV | V | Total |
| 0 - 15 | 11 (2.2) | 7.5 (6.7) | 11 (5.8) | 8.8 (0.6) | 4.9 (1.4) | 20 (9.3) |
| 15 - 22 | 9.9 (2.3) | 9.2 (1.7) | 7.1 (2.3) | 9.2 (0.7) | 3.5 (0.4) | 18 (3.8) |
| 22 - 29 | 10 (2.0) | 11 (1.8) | 4.4 (2.3) | 9.3 (0.5) | 3.3 (1.5) | 18 (3.9) |
| 29 - 36 | 10 (1.9) | 12 (2.8) | 4.9 (2.2) | 9.1 (0.4) | 3.2 (1.6) | 19 (4.4) |
| 36 - 43 | 11 (1.8) | 12 (3.1) | 5.6 (1.6) | 9.0 (0.2) | 3.3 (0.7) | 20 (4.0) |
| 43 - 50 | 12 (2.0) | 12 (3.0) | 4.7 (1.5) | 9.4 (0.6) | 3.1 (0.8) | 20 (4.0) |
| 50 - 57 | 12 (2.8) | 12 (3.1) | 3.9 (2.3) | 8.7 (0.6) | 4.7 (1.6) | 20 (5.1) |
| 57 - 72 | 11 (1.5) | 10 (1.7) | 2.8 (4.3) | 8.6 (0.6) | 3.8 (0.6) | 18 (4.9) |
| 72 - 108 | 11 (0.7) | 7.8 (1.8) | 6.1 (1.4) | 8.9 (0.2) | 4.4 (0.9) | 18 (2.5) |
| 108 - 130 | 11 (2.3) | 6.4 (2.9) | 8.3 (4.1) | 9.2 (0.3) | 4.4 (0.6) | 19 (5.6) |
| 130 - 140 | 9.7 (2.4) | 6.8 (2.6) | 7.7 (4.1) | 9.1 (0.2) | 4.3 (1.2) | 17 (5.5) |
| 140 - 150 | 9.2 (2.9) | 7.3 (2.2) | 7.4 (3.9) | 9.0 (0.4) | 4.3 (0.6) | 17 (5.4) |
| 150 - 165 | 9.7 (3.0) | 6.1 (3.2) | 5.6 (3.9) | 9.2 (0.5) | 5.4 (1.9) | 17 (6.2) |
The largest contribution to the total uncertainty comes from uncertainty in the detector response, particularly the average calorimetric response to events passing the analysis selections (6-11%), to which the background-constraining fits are particularly sensitive. The measurements at low pion kinetic energy are also very sensitive to the detector mass model uncertainty (7% between 35 and 55 MeV) since this affects the pion track reconstruction threshold. The total uncertainty also has large contributions from the neutrino-nucleon cross section model (6-12%) and neutrino flux uncertainty (9%). The primary uncertainty from the neutrino-nucleon cross section model comes from modeling the muon angular distribution in resonance production (7-12%), which affects the estimated MINOS muon acceptance. This uncertainty can be reduced to 4% or less by restricting the signal definition to muon angles less than ; the Appendix contains the results of this measurement variation.
The shape uncertainties are generally less sensitive to the systematic effects described above, especially to the neutrino flux (reduced to 1%). The exception to this is the measurement at between 35 and 55 MeV, which retains sensitivity to the detector mass model. Additionally, the shapes of the angular cross section measurements at forward angles are sensitive to the large uncertainties assumed in the decay anisotropy model (see Section III).
VII Results
VII.1 Models
The results of this measurement for the CC1 and CCN channels are presented in the following figures. They are compared with calculations from the theoretical work of Athar, Chaukin, and Singh (ACS) M.S. Athar, S. Chauhan, and S.K. Singh (2010) and the event generators GENIE Andreopoulos et al. (2010), NEUT Hayato (2009), and NuWro Golan et al. (2012). Predictions from the GiBUU model can be found in Refs. Mosel et al. (2014); Mosel (2015). Each prediction includes models for the initial neutrino interaction, the nuclear structure affecting the initial interaction, and the FSI of the particles produced. For resonance production, GENIE and NEUT use the model of Rein and Sehgal Rein and Sehgal (1981) without including resonance interference and with varying treatments of nuclear structure. NuWro includes only the (1232) resonance, using the Adler model S.L. Adler (1968, 1975), and ACS uses the parameterization of Schreiner and Von Hippel P.A. Schreiner and F. Von Hippel (1973) and contains medium modifications to the mass and decay width.
| Model | Nucleon Resonance | Nonresonance | Nucleon Momentum | Modifications | FSI |
|---|---|---|---|---|---|
| ACS M.S. Athar, S. Chauhan, and S.K. Singh (2010) | Schreiner–Von Hippel P.A. Schreiner and F. Von Hippel (1973) | None | local relativistic | mass and | attenuation only M.J. Vicente-Vacas, M.K. Khankhasayev, and S.G. Mashnik (1994) |
| Fermi gas | decay width | ||||
| GENIE Andreopoulos et al. (2010) 2.6.2 | Rein–Sehgal Rein and Sehgal (1981) | Bodek–Yang Bodek et al. (2005) with | global relativistic | no | effective cascade |
| without interference | extrapolation to lower | Fermi gas | |||
| NEUT Hayato (2009) 5.3.3 | Rein–Sehgal | Rein–Sehgal | global relativistic | yes, via FSI model | Salcedo–Oset Salcedo et al. (1988), |
| without interference | Fermi gas | full cascade | |||
| NuWro Golan et al. (2012) | Adler S.L. Adler (1968, 1975), | Bodek–Yang with | global relativistic | yes, via FSI model | Salcedo–Oset, |
| (1232) only | extrapolation to lower | Fermi gas | full cascade |
NEUT takes the nonresonant interaction from Rein and Sehgal; ACS has no nonresonant mechanisms; GENIE and NuWro have similar approaches, using the model of Bodek and Yang Bodek et al. (2005) above the resonance region and smoothly extrapolating it to lower to converge with the resonance model. All models must choose between matching the ANL Radecky et al. (1982) and BNL Kitagaki et al. (1986) data for charged-current pion production from nucleon targets because the BNL data is about 40% larger than the ANL data for neutrino energies of 2 GeV. While the GENIE fit is midway between the two data sets, NEUT and NuWro fits are closer to the ANL result.
GENIE, NEUT, and NuWro use a relativistic Fermi gas model for the nucleon momentum distribution, while ACS uses a local Fermi gas model in which the Fermi momentum depends on the radial distance from the center of the nucleus. For FSI, NEUT and NuWro use the Salcedo–Oset model Salcedo et al. (1988) in a cascade formalism which has nuclear medium corrections, while GENIE uses an effective cascade model which has similar agreement with pion-nucleus data. ACS uses a model which includes pion attenuation, but not inelastic scattering which changes the pion energy and angle M.J. Vicente-Vacas, M.K. Khankhasayev, and S.G. Mashnik (1994). Thus, a calculation with excellent nuclear medium effects but incomplete FSI (ACS) is compared with calculations with simple nuclear structure and detailed FSI (GENIE, NuWro, NEUT). Table 4 summarizes the models used by the predictions shown in this paper.
VII.2 CC1 results
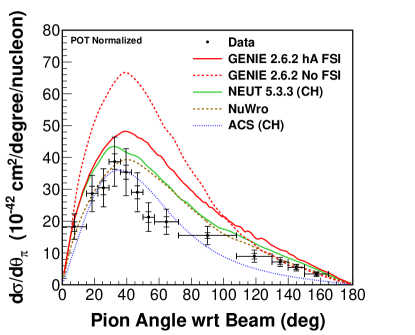
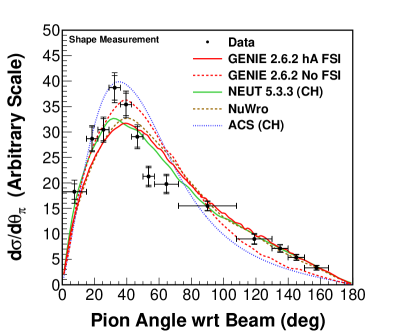
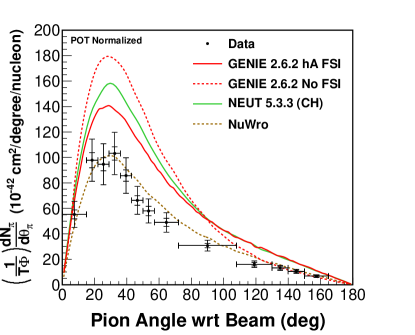
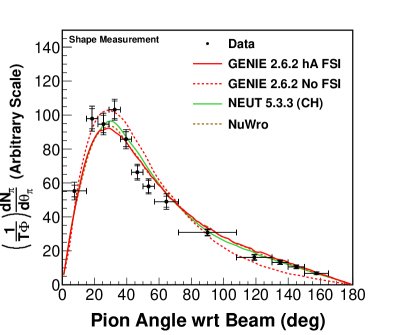
The measured for the CC1 analysis is shown in Fig. 8, along with predictions from the models discussed above. The between the data and model predictions are listed in Table 5. The effect of FSI, shown in the comparison between the GENIE “hA FSI” and “no FSI” curves, is to deplete (increase) the forward (backward) angle cross section. Both the absolute and shape measurements show a clear preference for models that implement FSI with a full or effective cascade model. In particular, the “no FSI” and ACS predictions do not describe the relative cross section for forward- and backward-going pions.
| Model | Absolute | Shape |
|---|---|---|
| ACS (CH) | 78 | 89 |
| GENIE 2.6.2 hA FSI | 104 | 41 |
| GENIE 2.6.2 No FSI | 234 | 72 |
| NEUT 5.3.3 (CH) | 50 | 26 |
| NuWro | 67 | 46 |
| ACS (CH) | 40 | 34 |
| GENIE 2.6.2 hA FSI | 21 | 7.4 |
| GENIE 2.6.2 No FSI | 105 | 23 |
| NEUT 5.3.3 (CH) | 26 | 13 |
| NuWro | 25 | 16 |
The shape of could be sensitive to the decay angle distribution. GENIE and NuWro use an isotropic decay distribution while NEUT assumes the anisotropy in the original Rein-Sehgal model Rein and Sehgal (1981). ACS calculates specific anisotropies for the and the separately. The larger effect, however, is the implementation of FSI.
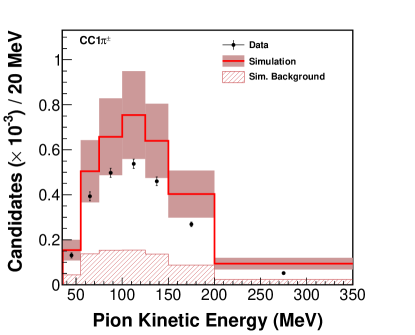
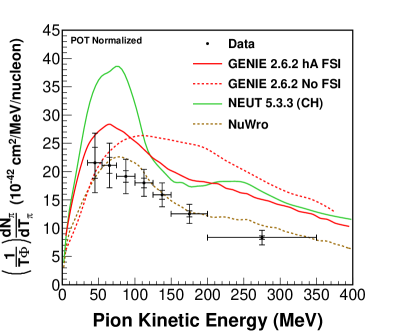
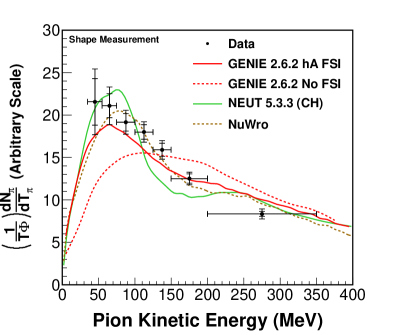
The measured CC1 is shown in Fig. 9 along with the model predictions. The calculations are provided in Table 5. FSI suppresses the charged pion production cross section through pion absorption and charge exchange, and migrates pions to lower energies through scattering. These interactions are highly energy dependent, peaking between 100 and 220 MeV Leitner et al. (2009), and significantly modify the shape of . The significant reduction in the total cross section is seen by comparing the solid and dashed GENIE predictions in the absolute measurement, while the energy dependence of the FSI can be clearly seen by comparing the GENIE predictions for the shape measurement. The data are in best agreement with models that implement full or effective particle cascade FSI algorithms.
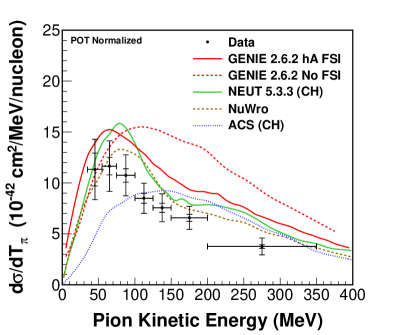
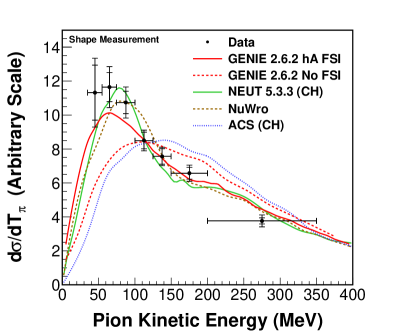
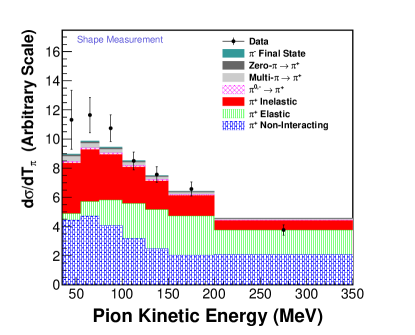
The shape of is compared with the GENIE calculation subdivided by FSI channel in Fig. 10. Effects of pion absorption are significant but not directly seen because those pions cannot be in the final state. Inelastic scattering is the dominant contributor because the interaction probability is large and the energy is significantly reduced. Elastic scattering is also significant but does not affect the energy spectrum. The calculation would agree with the data shape better if the inelastic scattering contribution were increased within the estimated error in the total pion inelastic cross section data (40% Ashery et al. (1981)).
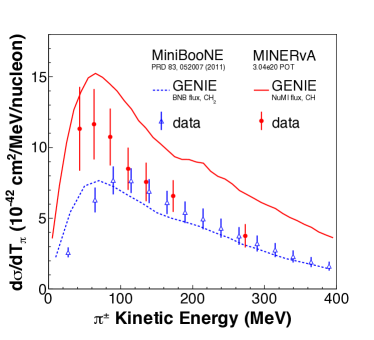
Since these data favor different calculations than the MiniBooNE data Rodrigues (2015), a comparison of the two data sets is interesting. Figure 11 compares this measurement of CC1 with that of MiniBooNE along with the two corresponding GENIE predictions for the appropriate neutrino fluxes Aguilar-Arevalo et al. (2009b) and signal definitions. MINERvA measures higher energy and higher neutrino interactions than does MiniBooNE, but the and kinematic ranges overlap significantly. MINERvA reports the cross section at 1.4 GeV while MiniBooNE selects events with reconstructed 1.35 GeV and uses the NUANCE event generator Casper (2002) to measure the cross section over the full range; GENIE predicts that 24% of the MiniBooNE cross section result is at 1.4 GeV. All these considerations lead to differences in the contributions due to excitation and non-resonant backgrounds, but the key feature of attenuation due to pion FSI is expected to be similar.
The MINERvA and MiniBooNE results have a similar shape and magnitude above MeV in Fig. 11. The shape agreement indicates some consistency in the pion absorption FSI process, while the agreement in magnitude is unexpected when considering the different and ranges of the measurements and is not presently described by any models. In fact, the MINERvA cross section at higher would nominally be larger than the MiniBooNE result because the cross section for pion production from nucleon targets rises with increasing . The shape disagreement below 100 MeV is also not explained by current models. The GENIE model predicts the shape but overpredicts the level of the MINERvA data (see Fig. 9 for shape), while it predicts the magnitude but not the shape of the MiniBooNE data. The same trend is seen with the GiBUU calculation, as shown in Ref. O. Lalakulich and U. Mosel (2013).
VII.3 CCN results
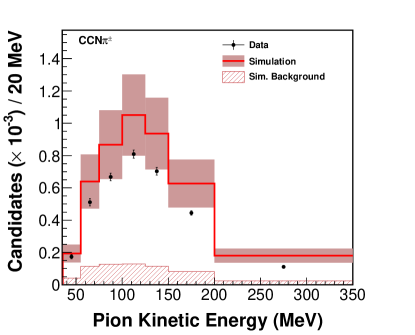
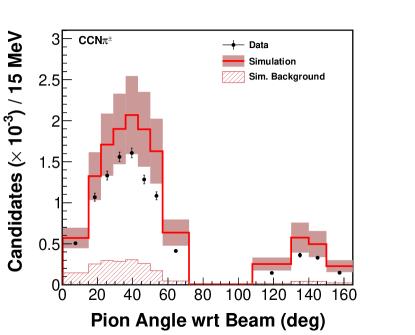
Extension of the maximum from 1.4 to 1.8 GeV in the CCN analysis includes additional nonresonant processes and resonances at high mass. For each event, more than one charged pion can be counted (see Section VI), which causes these distributions to be sensitive to pion-producing FSI processes in higher-multiplicity events. GENIE predicts that 19% of the CCN charged pions come from two-pion events, and 5% come from events with three or more charged pions.
Figures 12 and 13 show the results of the CCN analysis as well as the GENIE (no FSI and with FSI), NEUT, and NuWro predictions. The data distributions are very similar in shape to Figures 8 and 9 even though the total cross section is roughly 50% larger, and the relative normalization of the GENIE prediction to the data does not change. The NuWro prediction for the total CCN cross section improves slightly relative to its prediction for the CC1 channel, while NEUT predicts a much larger increase in final state pions, particularly at 100 MeV, for the higher processes.
VIII Summary
This paper presents measurements of neutrino-induced pion production from a CH target and compares them to models with different FSI treatments and to the MiniBooNE measurement of the same process. These data provide new information about the neutrino energy dependence of resonant pion production and can be used to place strong constraints on FSI. More generally, they provide an observational foundation for improving both the background and signal predictions needed for precise oscillation parameter measurements.
Both the and distribution shapes strongly favor models with FSI implemented as a full or effective cascade algorithm. For the CC1 analysis, the calculations with FSI, NEUT and NuWro are in good agreement with the data while GENIE predicts cross sections that are too large. The distribution shape contains the most information about FSI. At greater than 100 MeV, where pion FSI effects largely deplete the yield, MINERvA and MiniBooNE have similar shape. However, the similarity in magnitude is not expected. There are also significant normalization and shape discrepancies between the two measurements below 100 MeV in comparison with the GENIE calculation. A decomposition of the FSI channels in the GENIE calculation suggest that an increased inelastic contribution may improve agreement with the data.
For the CCN analysis, data results are similar to the CC1 analysis. However, differences among the models employed in the generators produce significant changes with respect to the data. The shape is strongly affected by FSI and the magnitude disagreement can come from problems within the Monte Carlo models.
It is clear that the underlying pion production models and perhaps other parts of the neutrino interaction will have to be modified to reproduce both data sets, which will in turn help improve predictions for oscillation experiments.
Acknowledgements.
This work was supported by the Fermi National Accelerator Laboratory under U.S. Department of Energy Contract No. DE-AC02-07CH11359 which included the MINERvA construction project. Construction support also was granted by the United States National Science Foundation under Grant No. PHY-0619727 and by the University of Rochester. Support for participating scientists was provided by NSF and DOE (USA) by CAPES and CNPq (Brazil), by CoNaCyT (Mexico), by CONICYT (Chile), by CONCYTEC, DGI-PUCP and IDI/IGI-UNI (Peru), by Latin American Center for Physics (CLAF), by the Swiss National Science Foundation, and by RAS and the Russian Ministry of Education and Science (Russia). We thank the MINOS Collaboration for use of its near detector data. Finally, we thank the staff of Fermilab for support of the beam line and detector.References
- Abe et al. (2011) K. Abe et al. (T2K Collaboration), Nucl. Instrum. Methods Phys. Res., Sect. A 659, 106 (2011).
- Ayres et al. (2004) D. S. Ayres et al. (NOvA Collaboration), (2004), arXiv:hep-ex/0503053 .
- Adams et al. (2013) C. Adams et al. (LBNE), (2013), arXiv:1307.7335 [hep-ex] .
- Fiorentini et al. (2013) G. A. Fiorentini et al. (MINERvA Collaboration), Phys. Rev. Lett. 111, 022502 (2013).
- Fields et al. (2013) L. Fields et al. (MINERvA Collaboration), Phys. Rev. Lett. 111, 022501 (2013).
- Aguilar-Arevalo et al. (2010) A. A. Aguilar-Arevalo et al., Phys. Rev. D 81, 092005 (2010).
- Aguilar-Arevalo et al. (2013a) A. A. Aguilar-Arevalo et al. (MiniBooNE Collaboration), Phys. Rev. D 88, 032001 (2013a).
- Abe et al. (2014a) K. Abe et al. (T2K Collaboration), Phys. Rev. Lett. 112, 061802 (2014a).
- Aguilar-Arevalo et al. (2013b) A. A. Aguilar-Arevalo et al., Phys. Rev. Lett. 110, 161801 (2013b).
- Lalakulich et al. (2012) O. Lalakulich, U. Mosel, and K. Gallmeister, Phys. Rev. C 86, 054606 (2012).
- Qian et al. (2010) X. Qian et al., Phys. Rev. C 81, 055209 (2010).
- Bell et al. (1978) J. Bell et al., Phys. Rev. Lett. 41, 1008 (1978).
- Radecky et al. (1982) G. M. Radecky et al., Phys. Rev. D 25, 1161 (1982).
- Kitagaki et al. (1986) T. Kitagaki et al., Phys. Rev. D 34, 2554 (1986).
- Allen et al. (1986) P. Allen et al. (Aachen-Birmingham-Bonn-CERN-London-Munich-Oxford Collaboration), Nucl. Phys. B 264, 221 (1986).
- Allasia et al. (1990) D. Allasia et al. (Amsterdam-Bergen-Bologna-padova-Pisa-Saclay-Torino Collaboration), Nucl. Phys. B 343, 285 (1990).
- Block et al. (1964) M. M. Block et al., Phys. Lett. 12, 281 (1964).
- Budagov et al. (1969) I. Budagov et al., Phys. Lett. B 29, 524 (1969).
- Grabosch et al. (1989) H. J. Grabosch et al. (SKAT Collaboration), Z. Phys. C 41, 527 (1989).
- Wilkinson et al. (2014) C. Wilkinson et al., Phys.Rev. D90, 112017 (2014).
- Rodriguez et al. (2008) A. Rodriguez et al. (K2K collaboration), Phys. Rev. D 78, 032003 (2008).
- Aguilar-Arevalo et al. (2009a) A. A. Aguilar-Arevalo et al., Phys. Rev. Lett. 103, 081801 (2009a).
- Aguilar-Arevalo et al. (2011) A. A. Aguilar-Arevalo et al. (MiniBooNE Collaboration), Phys. Rev. D 83, 052007 (2011).
- O. Lalakulich and U. Mosel (2013) O. Lalakulich and U. Mosel, Phys. Rev. C 87, 014602 (2013).
- E. Hernández, J. Nieves, and M.J. Vicente Vacas (2013) E. Hernández, J. Nieves, and M.J. Vicente Vacas, Phys. Rev. D 87, 113009 (2013).
- Rodrigues (2015) P. A. Rodrigues, AIP Conf. Proc. 1663, 030006 (2015).
- Abe et al. (2014b) K. Abe et al. (T2K Collaboration), Phys. Rev. D 89, 092003 (2014b).
- Anderson et al. (1998) K. Anderson, B. Bernstein, D. Boehnlein, K. R. Bourkland, S. Childress, et al., The NuMI Facility Technical Design Report, FERMILAB-DESIGN-1998-01 (1998).
- Michael et al. (2008) D. G. Michael et al. (MINOS Collaboration), Nucl. Instrum. Methods Phys. Res., Sect. A 596, 190 (2008).
- Aliaga et al. (2014) L. Aliaga et al. (MINERvA Collaboration), Nucl. Instrum. Methods in Phys. Res., Sect. A 743, 130 (2014).
- Agostinelli et al. (2003) S. Agostinelli et al., Nucl. Instrum. Methods Phys. Res., Sect. A 506, 250 (2003).
- Allison et al. (2006) J. Allison et al., Nuclear Science, IEEE Transactions 53, 270 (2006).
- Alt et al. (2007) C. Alt et al. (NA49 Collaboration), Eur. Phys. J. C 49, 897 (2007).
- Lebedev (2007) A. V. Lebedev, Fermilab-thesis-2007-76, Harvard University (2007).
- Pavlovic (2008) Z. Pavlovic, Fermilab-thesis-2008-59, University of Texas (2008).
- Ashery et al. (1981) D. Ashery et al., Phys. Rev. C 23, 2173 (1981).
- Allardyce et al. (1973) B. W. Allardyce et al., Nucl. Phys. A209, 1 (1973).
- Saunders et al. (1996) A. Saunders et al., Phys. Rev. C 53, 1745 (1996).
- T.S.H. Lee and R.P. Redwine (2002) T.S.H. Lee and R.P. Redwine, Ann. Rev. Nucl. Part. Sci. 52, 23 (2002).
- Aliaga et al. (2015) L. Aliaga et al. (MINERvA), Nucl.Instrum.Meth. A789, 28 (2015).
- Andreopoulos et al. (2010) C. Andreopoulos et al., Nucl. Instrum. Methods Phys. Res., Sect. A A614, 87 (2010), Program release 2.6.2 used here.
- Rein and Sehgal (1981) D. Rein and L. M. Sehgal, Ann. Phys. 133, 79 (1981).
- Beringer et al. (2012) J. Beringer et al. (Particle Data Group), Phys. Rev. D 86, 010001 (2012).
- Bodek et al. (2005) A. Bodek, I. Park, and U. K. Yang, Nucl. Phys. Proc. Suppl. 139, 113 (2005).
- D. Rein and L.M. Sehgal (2007) D. Rein and L.M. Sehgal, Phys. Lett. B 657, 207 (2007).
- Dytman and Meyer (2011) S. A. Dytman and A. S. Meyer, AIP Conf.Proc. 1405, 213 (2011).
- Eberly (2014) B. Eberly, Fermilab-thesis-2014-18, Univ. of Pittsburgh (2014).
- D’Agostini (1995) G. D’Agostini, Nucl. Instrum. Methods Phys. Res., Sect. A 362, 487 (1995).
- M.S. Athar, S. Chauhan, and S.K. Singh (2010) M.S. Athar, S. Chauhan, and S.K. Singh, Eur. Phys. J. A 43, 209 (2010).
- Hayato (2009) Y. Hayato, Acta Phys. Polon. B 40, 2477 (2009).
- Golan et al. (2012) T. Golan, C. Juszczak, and J. T. Sobczyk, Phys. Rev. C 86, 015505 (2012).
- Mosel et al. (2014) U. Mosel, O. Lalakulich, and K. Gallmeister, Phys. Rev. D 89, 093003 (2014).
- Mosel (2015) U. Mosel, Phys. Rev. C91, 065501 (2015).
- S.L. Adler (1968) S.L. Adler, Ann. Phys. 50, 189 (1968).
- S.L. Adler (1975) S.L. Adler, Phys. Rev. D 12, 2644 (1975).
- P.A. Schreiner and F. Von Hippel (1973) P.A. Schreiner and F. Von Hippel, Nucl. Phys. B 58, 333 (1973).
- M.J. Vicente-Vacas, M.K. Khankhasayev, and S.G. Mashnik (1994) M.J. Vicente-Vacas, M.K. Khankhasayev, and S.G. Mashnik, (1994), arXiv:nucl-th/9412023 [nucl-th] .
- Salcedo et al. (1988) L. L. Salcedo, E. Oset, M. J. Vicente-Vacas, and C. Garcia-Recio, Nucl. Phys. A484, 557 (1988).
- Leitner et al. (2009) T. Leitner, O. Buss, U. Mosel, and L. Alvarez-Ruso, Phys. Rev. C 79, 038501 (2009).
- Aguilar-Arevalo et al. (2009b) A. A. Aguilar-Arevalo et al. (MiniBooNE Collaboration), Phys. Rev. D 79, 072002 (2009b).
- Casper (2002) D. Casper, Nucl. Phys. Proc. Suppl. 112, 161 (2002).
*
Appendix A
This appendix contains tables of measured cross sections, uncertainties, and bin correlations for the measurements presented in the paper. Additionally, these quantities are reported for alternative versions of the reported measurements in which the measured signal has the additional restriction that the muon angle with respect to the beam is less than 20∘.
| (degree) Bins | 0 - 15 | 15 - 22 | 22 - 29 | 29 - 36 | 36 - 43 | 43 - 50 | 50 - 57 |
|---|---|---|---|---|---|---|---|
| Cross section in bin | 1.83 | 2.87 | 3.05 | 3.87 | 3.54 | 2.91 | 2.13 |
| nucleon | 0.40 (0.23) | 0.57 (0.26) | 0.60 (0.25) | 0.77 (0.29) | 0.74 (0.26) | 0.61 (0.23) | 0.45 (0.20) |
| (degree) Bins | 57 - 72 | 72 - 108 | 108 - 130 | 130 - 140 | 140 - 150 | 150 - 165 | |
| Cross section in bin | 1.98 | 1.55 | 0.90 | 0.71 | 0.54 | 0.33 | |
| nucleon | 0.40 (0.19) | 0.29 (0.10) | 0.19 (0.11) | 0.14 (0.08) | 0.11 (0.06) | 0.07 (0.05) |
| Bins (degree) | 0 - 15 | 15 - 22 | 22 - 29 | 29 - 36 | 36 - 43 | 43 - 50 | 50 - 57 | 57 - 72 | 72 - 108 | 108 - 130 | 130 - 140 | 140 - 150 | 150 - 165 |
|---|---|---|---|---|---|---|---|---|---|---|---|---|---|
| 0 - 15 | 1 | 0.78 | 0.71 | 0.71 | 0.73 | 0.71 | 0.66 | 0.65 | 0.78 | 0.73 | 0.72 | 0.69 | 0.60 |
| 15 - 22 | 1 | 0.82 | 0.82 | 0.83 | 0.82 | 0.78 | 0.76 | 0.84 | 0.74 | 0.74 | 0.73 | 0.64 | |
| 22 - 29 | 1 | 0.87 | 0.86 | 0.86 | 0.83 | 0.81 | 0.85 | 0.72 | 0.73 | 0.73 | 0.65 | ||
| 29 - 36 | 1 | 0.89 | 0.88 | 0.85 | 0.83 | 0.85 | 0.73 | 0.75 | 0.74 | 0.66 | |||
| 36 - 43 | 1 | 0.90 | 0.86 | 0.83 | 0.87 | 0.75 | 0.76 | 0.76 | 0.67 | ||||
| 43 - 50 | 1 | 0.86 | 0.83 | 0.86 | 0.74 | 0.75 | 0.75 | 0.67 | |||||
| 50 - 57 | 1 | 0.82 | 0.84 | 0.72 | 0.73 | 0.73 | 0.66 | ||||||
| 57 - 72 | 1 | 0.82 | 0.72 | 0.73 | 0.72 | 0.65 | |||||||
| 72 - 108 | 1 | 0.80 | 0.80 | 0.79 | 0.71 | ||||||||
| 108 - 130 | 1 | 0.75 | 0.73 | 0.66 | |||||||||
| 130 - 140 | 1 | 0.76 | 0.67 | ||||||||||
| 140 - 150 | 1 | 0.66 | |||||||||||
| 150 - 165 | 1 | ||||||||||||
| 0 - 15 | 1 | 0.19 | -0.16 | -0.24 | -0.20 | -0.23 | -0.31 | -0.26 | 0.02 | 0.13 | 0.08 | 0.04 | -0.03 |
| 15 - 22 | 1 | 0.03 | -0.02 | -0.04 | -0.07 | -0.13 | -0.13 | -0.03 | -0.02 | -0.04 | -0.04 | -0.06 | |
| 22 - 29 | 1 | 0.16 | 0.06 | 0.07 | 0.08 | 0.07 | -0.06 | -0.16 | -0.13 | -0.11 | -0.07 | ||
| 29 - 36 | 1 | 0.19 | 0.18 | 0.13 | 0.09 | -0.12 | -0.21 | -0.14 | -0.12 | -0.11 | |||
| 36 - 43 | 1 | 0.24 | 0.16 | 0.02 | -0.10 | -0.14 | -0.16 | -0.12 | -0.11 | ||||
| 43 - 50 | 1 | 0.17 | 0.07 | -0.09 | -0.14 | -0.14 | -0.11 | -0.09 | |||||
| 50 - 57 | 1 | 0.13 | -0.03 | -0.11 | -0.11 | -0.07 | -0.02 | ||||||
| 57 - 72 | 1 | -0.04 | -0.05 | -0.01 | -0.02 | 0.02 | |||||||
| 72 - 108 | 1 | 0.07 | 0.04 | 0.05 | 0.06 | ||||||||
| 108 - 130 | 1 | 0.17 | 0.13 | 0.11 | |||||||||
| 130 - 140 | 1 | 0.23 | 0.16 | ||||||||||
| 140 - 150 | 1 | 0.17 | |||||||||||
| 150 - 165 | 1 |
| (MeV) Bins | 35 - 55 | 55 - 75 | 75 - 100 | 100 - 125 | 125 - 150 | 150 - 200 | 200 - 350 |
|---|---|---|---|---|---|---|---|
| Cross section in bin | 1.13 | 1.16 | 1.07 | 0.85 | 0.76 | 0.66 | 0.38 |
| nucleon | 0.30 (0.20) | 0.25 (0.12) | 0.20 (0.09) | 0.15 (0.06) | 0.14 (0.05) | 0.11 (0.05) | 0.08 (0.04) |
| Bins (MeV) | 35 - 55 | 55 - 75 | 75 - 100 | 100 - 125 | 125 - 150 | 150 - 200 | 200 - 350 |
|---|---|---|---|---|---|---|---|
| 35 - 55 | 1 | 0.74 | 0.72 | 0.68 | 0.68 | 0.59 | 0.56 |
| 55 - 75 | 1 | 0.87 | 0.82 | 0.81 | 0.72 | 0.70 | |
| 75 - 100 | 1 | 0.85 | 0.84 | 0.76 | 0.71 | ||
| 100 - 125 | 1 | 0.88 | 0.83 | 0.79 | |||
| 125 - 150 | 1 | 0.84 | 0.81 | ||||
| 150 - 200 | 1 | 0.89 | |||||
| 200 - 350 | 1 | ||||||
| 35 - 55 | 1 | 0.29 | 0.20 | 0.01 | -0.02 | -0.30 | -0.36 |
| 55 - 75 | 1 | 0.39 | 0.09 | 0.02 | -0.40 | -0.47 | |
| 75 - 100 | 1 | 0.21 | 0.13 | -0.22 | -0.53 | ||
| 100 - 125 | 1 | 0.25 | 0.01 | -0.31 | |||
| 125 - 150 | 1 | 0.05 | -0.21 | ||||
| 150 - 200 | 1 | 0.27 | |||||
| 200 - 350 | 1 |
| (degree) Bins | 0 - 15 | 15 - 22 | 22 - 29 | 29 - 36 | 36 - 43 | 43 - 50 | 50 - 57 |
|---|---|---|---|---|---|---|---|
| Cross section in bin | 1.15 | 1.66 | 1.76 | 2.26 | 2.16 | 1.87 | 1.44 |
| nucleon | 0.25 (0.17) | 0.29 (0.16) | 0.29 (0.15) | 0.37 (0.17) | 0.38 (0.16) | 0.34 (0.15) | 0.27 (0.14) |
| (degree) Bins | 57 - 72 | 72 - 108 | 108 - 130 | 130 - 140 | 140 - 150 | 150 - 165 | |
| Cross section in bin | 1.41 | 1.18 | 0.69 | 0.55 | 0.414 | 0.256 | |
| nucleon | 0.26 (0.14) | 0.21 (0.08) | 0.15 (0.08) | 0.11 (0.06) | 0.081 (0.047) | 0.054 (0.037) |
| Bins (degree) | 0 - 15 | 15 - 22 | 22 - 29 | 29 - 36 | 36 - 43 | 43 - 50 | 50 - 57 | 57 - 72 | 72 - 108 | 108 - 130 | 130 - 140 | 140 - 150 | 150 - 165 |
|---|---|---|---|---|---|---|---|---|---|---|---|---|---|
| 0 - 15 | 1 | 0.77 | 0.65 | 0.61 | 0.61 | 0.58 | 0.51 | 0.53 | 0.68 | 0.67 | 0.65 | 0.62 | 0.54 |
| 15 - 22 | 1 | 0.74 | 0.73 | 0.72 | 0.70 | 0.65 | 0.65 | 0.76 | 0.71 | 0.70 | 0.67 | 0.61 | |
| 22 - 29 | 1 | 0.80 | 0.79 | 0.78 | 0.75 | 0.75 | 0.79 | 0.70 | 0.69 | 0.67 | 0.63 | ||
| 29 - 36 | 1 | 0.84 | 0.83 | 0.80 | 0.79 | 0.82 | 0.72 | 0.73 | 0.71 | 0.65 | |||
| 36 - 43 | 1 | 0.86 | 0.82 | 0.79 | 0.84 | 0.74 | 0.74 | 0.73 | 0.66 | ||||
| 43 - 50 | 1 | 0.82 | 0.79 | 0.83 | 0.72 | 0.72 | 0.70 | 0.64 | |||||
| 50 - 57 | 1 | 0.78 | 0.80 | 0.68 | 0.68 | 0.67 | 0.62 | ||||||
| 57 - 72 | 1 | 0.77 | 0.67 | 0.67 | 0.65 | 0.59 | |||||||
| 72 - 108 | 1 | 0.78 | 0.77 | 0.75 | 0.67 | ||||||||
| 108 - 130 | 1 | 0.75 | 0.73 | 0.65 | |||||||||
| 130 - 140 | 1 | 0.76 | 0.67 | ||||||||||
| 140 - 150 | 1 | 0.66 | |||||||||||
| 150 - 165 | 1 | ||||||||||||
| 0 - 15 | 1 | 0.36 | -0.04 | -0.24 | -0.30 | -0.32 | -0.39 | -0.30 | -0.10 | 0.11 | 0.06 | 0.01 | -0.03 |
| 15 - 22 | 1 | 0.09 | -0.07 | -0.16 | -0.19 | -0.24 | -0.17 | -0.11 | 0.01 | 0.001 | -0.01 | 0.001 | |
| 22 - 29 | 1 | 0.14 | -0.01 | 0.01 | 0.03 | 0.09 | -0.10 | -0.14 | -0.11 | -0.10 | -0.02 | ||
| 29 - 36 | 1 | 0.14 | 0.15 | 0.13 | 0.17 | -0.09 | -0.16 | -0.07 | -0.06 | -0.03 | |||
| 36 - 43 | 1 | 0.25 | 0.19 | 0.13 | -0.02 | -0.07 | -0.07 | -0.04 | -0.01 | ||||
| 43 - 50 | 1 | 0.22 | 0.16 | 0.01 | -0.12 | -0.11 | -0.08 | -0.05 | |||||
| 50 - 57 | 1 | 0.20 | 0.05 | -0.12 | -0.11 | -0.07 | -0.01 | ||||||
| 57 - 72 | 1 | -0.04 | -0.14 | -0.11 | -0.11 | -0.05 | |||||||
| 72 - 108 | 1 | 0.02 | -0.04 | -0.01 | -0.04 | ||||||||
| 108 - 130 | 1 | 0.18 | 0.15 | 0.10 | |||||||||
| 130 - 140 | 1 | 0.25 | 0.14 | ||||||||||
| 140 - 150 | 1 | 0.16 | |||||||||||
| 150 - 165 | 1 |
| (MeV) Bins | 35 - 55 | 55 - 75 | 75 - 100 | 100 - 125 | 125 - 150 | 150 - 200 | 200 - 350 |
|---|---|---|---|---|---|---|---|
| Cross section in bin | 0.85 | 0.90 | 0.84 | 0.66 | 0.59 | 0.496 | 0.257 |
| nucleon | 0.21 (0.15) | 0.18 (0.09) | 0.15 (0.07) | 0.11 (0.05) | 0.10 (0.04) | 0.079 (0.036) | 0.053 (0.024) |
| Bins (MeV) | 35 - 55 | 55 - 75 | 75 - 100 | 100 - 125 | 125 - 150 | 150 - 200 | 200 - 350 |
|---|---|---|---|---|---|---|---|
| 35 - 55 | 1 | 0.71 | 0.69 | 0.65 | 0.65 | 0.56 | 0.52 |
| 55 - 75 | 1 | 0.86 | 0.81 | 0.80 | 0.70 | 0.67 | |
| 75 - 100 | 1 | 0.84 | 0.83 | 0.74 | 0.68 | ||
| 100 - 125 | 1 | 0.87 | 0.81 | 0.77 | |||
| 125 - 150 | 1 | 0.83 | 0.79 | ||||
| 150 - 200 | 1 | 0.88 | |||||
| 200 - 350 | 1 | ||||||
| 35 - 55 | 1 | 0.26 | 0.17 | -0.02 | -0.05 | -0.29 | -0.34 |
| 55 - 75 | 1 | 0.36 | 0.05 | -0.01 | -0.39 | -0.44 | |
| 75 - 100 | 1 | 0.18 | 0.10 | -0.22 | -0.52 | ||
| 100 - 125 | 1 | 0.22 | 0.01 | -0.27 | |||
| 125 - 150 | 1 | 0.04 | -0.17 | ||||
| 150 - 200 | 1 | 0.29 | |||||
| 200 - 350 | 1 |
| (degree) Bins | 0 - 15 | 15 - 22 | 22 - 29 | 29 - 36 | 36 - 43 | 43 - 50 | 50 - 57 |
|---|---|---|---|---|---|---|---|
| Measurement in bin | 5.5 | 9.8 | 9.5 | 10.3 | 8.9 | 6.6 | 5.80 |
| nucleon | 1.0 (0.5) | 1.7 (0.7) | 1.6 (0.6) | 1.7 (0.6) | 1.4 (0.6) | 1.1 (0.5) | 0.94 (0.44) |
| (degree) Bins | 57 - 72 | 72 - 108 | 108 - 130 | 130 - 140 | 140 - 150 | 150 - 165 | |
| Measurement in bin | 4.90 | 3.08 | 1.61 | 1.32 | 1.05 | 0.68 | |
| nucleon | 0.77 (0.46) | 0.43 (0.21) | 0.25 (0.17) | 0.20 (0.13) | 0.16 (0.11) | 0.11 (0.09) |
| Bins (degree) | 0 - 15 | 15 - 22 | 22 - 29 | 29 - 36 | 36 - 43 | 43 - 50 | 50 - 57 | 57 - 72 | 72 - 108 | 108 - 130 | 130 - 140 | 140 - 150 | 150 - 165 |
|---|---|---|---|---|---|---|---|---|---|---|---|---|---|
| 0 - 15 | 1 | 0.85 | 0.85 | 0.84 | 0.78 | 0.75 | 0.69 | 0.56 | 0.69 | 0.59 | 0.60 | 0.58 | 0.52 |
| 15 - 22 | 1 | 0.86 | 0.85 | 0.82 | 0.79 | 0.75 | 0.64 | 0.75 | 0.65 | 0.65 | 0.63 | 0.57 | |
| 22 - 29 | 1 | 0.88 | 0.86 | 0.84 | 0.79 | 0.68 | 0.78 | 0.65 | 0.66 | 0.65 | 0.59 | ||
| 29 - 36 | 1 | 0.87 | 0.85 | 0.81 | 0.70 | 0.79 | 0.65 | 0.68 | 0.66 | 0.59 | |||
| 36 - 43 | 1 | 0.88 | 0.84 | 0.71 | 0.77 | 0.63 | 0.65 | 0.63 | 0.58 | ||||
| 43 - 50 | 1 | 0.84 | 0.74 | 0.79 | 0.64 | 0.66 | 0.64 | 0.59 | |||||
| 50 - 57 | 1 | 0.78 | 0.79 | 0.67 | 0.67 | 0.65 | 0.59 | ||||||
| 57 - 72 | 1 | 0.78 | 0.69 | 0.71 | 0.68 | 0.61 | |||||||
| 72 - 108 | 1 | 0.74 | 0.75 | 0.74 | 0.67 | ||||||||
| 108 - 130 | 1 | 0.68 | 0.66 | 0.60 | |||||||||
| 130 - 140 | 1 | 0.71 | 0.63 | ||||||||||
| 140 - 150 | 1 | 0.63 | |||||||||||
| 150 - 165 | 1 | ||||||||||||
| 0 - 15 | 1 | 0.37 | 0.30 | 0.20 | -0.01 | -0.13 | -0.29 | -0.45 | -0.33 | -0.22 | -0.24 | -0.23 | -0.20 |
| 15 - 22 | 1 | 0.20 | 0.13 | -0.01 | -0.09 | -0.22 | -0.33 | -0.23 | -0.13 | -0.18 | -0.17 | -0.15 | |
| 22 - 29 | 1 | 0.19 | 0.10 | 0.03 | -0.14 | -0.32 | -0.26 | -0.22 | -0.26 | -0.23 | -0.19 | ||
| 29 - 36 | 1 | 0.16 | 0.07 | -0.05 | -0.23 | -0.24 | -0.24 | -0.20 | -0.18 | -0.19 | |||
| 36 - 43 | 1 | 0.30 | 0.16 | -0.11 | -0.21 | -0.26 | -0.25 | -0.23 | -0.16 | ||||
| 43 - 50 | 1 | 0.21 | 0.01 | -0.10 | -0.18 | -0.19 | -0.17 | -0.11 | |||||
| 50 - 57 | 1 | 0.24 | 0.06 | -0.01 | -0.02 | -0.03 | -0.02 | ||||||
| 57 - 72 | 1 | 0.27 | 0.25 | 0.28 | 0.23 | 0.19 | |||||||
| 72 - 108 | 1 | 0.28 | 0.29 | 0.29 | 0.25 | ||||||||
| 108 - 130 | 1 | 0.29 | 0.26 | 0.22 | |||||||||
| 130 - 140 | 1 | 0.37 | 0.28 | ||||||||||
| 140 - 150 | 1 | 0.29 | |||||||||||
| 150 - 165 | 1 |
| (MeV) Bins | 35 - 55 | 55 - 75 | 75 - 100 | 100 - 125 | 125 - 150 | 150 - 200 | 200 - 350 |
|---|---|---|---|---|---|---|---|
| Measurement in bin | 2.16 | 2.11 | 1.92 | 1.80 | 1.59 | 1.25 | 0.83 |
| nucleon | 0.53 (0.39) | 0.39 (0.22) | 0.30 (0.14) | 0.24 (0.12) | 0.21 (0.11) | 0.17 (0.07) | 0.13 (0.06) |
| Bins (MeV) | 35 - 55 | 55 - 75 | 75 - 100 | 100 - 125 | 125 - 150 | 150 - 200 | 200 - 350 |
|---|---|---|---|---|---|---|---|
| 35 - 55 | 1 | 0.74 | 0.69 | 0.59 | 0.52 | 0.51 | 0.46 |
| 55 - 75 | 1 | 0.84 | 0.72 | 0.66 | 0.64 | 0.61 | |
| 75 - 100 | 1 | 0.80 | 0.76 | 0.74 | 0.70 | ||
| 100 - 125 | 1 | 0.85 | 0.81 | 0.73 | |||
| 125 - 150 | 1 | 0.84 | 0.78 | ||||
| 150 - 200 | 1 | 0.89 | |||||
| 200 - 350 | 1 | ||||||
| 35 - 55 | 1 | 0.44 | 0.25 | -0.12 | -0.28 | -0.42 | -0.46 |
| 55 - 75 | 1 | 0.41 | -0.11 | -0.28 | -0.49 | -0.51 | |
| 75 - 100 | 1 | 0.08 | -0.09 | -0.36 | -0.45 | ||
| 100 - 125 | 1 | 0.42 | 0.15 | -0.23 | |||
| 125 - 150 | 1 | 0.32 | -0.01 | ||||
| 150 - 200 | 1 | 0.40 | |||||
| 200 - 350 | 1 |
| (degree) Bins | 0 - 15 | 15 - 22 | 22 - 29 | 29 - 36 | 36 - 43 | 43 - 50 | 50 - 57 |
|---|---|---|---|---|---|---|---|
| Measurement in bin | 2.30 | 4.23 | 4.42 | 5.18 | 4.61 | 3.79 | 3.48 |
| nucleon | 0.41 (0.22) | 0.68 (0.31) | 0.72 (0.30) | 0.80 (0.32) | 0.74 (0.32) | 0.61 (0.27) | 0.53 (0.25) |
| (degree) Bins | 57 - 72 | 72 - 108 | 108 - 130 | 130 - 140 | 140 - 150 | 150 - 165 | |
| Measurement in bin | 3.12 | 2.06 | 1.08 | 0.88 | 0.70 | 0.452 | |
| nucleon | 0.45 (0.27) | 0.28 (0.13) | 0.17 (0.11) | 0.13 (0.08) | 0.10 (0.07) | 0.073 (0.053) |
| Bins (degree) | 0 - 15 | 15 - 22 | 22 - 29 | 29 - 36 | 36 - 43 | 43 - 50 | 50 - 57 | 57 - 72 | 72 - 108 | 108 - 130 | 130 - 140 | 140 - 150 | 150 - 165 |
|---|---|---|---|---|---|---|---|---|---|---|---|---|---|
| 0 - 15 | 1 | 0.84 | 0.83 | 0.83 | 0.78 | 0.76 | 0.71 | 0.59 | 0.72 | 0.61 | 0.62 | 0.60 | 0.57 |
| 15 - 22 | 1 | 0.85 | 0.84 | 0.82 | 0.80 | 0.77 | 0.66 | 0.76 | 0.66 | 0.66 | 0.64 | 0.60 | |
| 22 - 29 | 1 | 0.87 | 0.86 | 0.84 | 0.80 | 0.69 | 0.78 | 0.66 | 0.67 | 0.66 | 0.62 | ||
| 29 - 36 | 1 | 0.87 | 0.85 | 0.81 | 0.71 | 0.78 | 0.65 | 0.69 | 0.67 | 0.62 | |||
| 36 - 43 | 1 | 0.87 | 0.83 | 0.70 | 0.75 | 0.62 | 0.65 | 0.63 | 0.60 | ||||
| 43 - 50 | 1 | 0.83 | 0.72 | 0.76 | 0.63 | 0.66 | 0.64 | 0.61 | |||||
| 50 - 57 | 1 | 0.75 | 0.77 | 0.66 | 0.68 | 0.66 | 0.61 | ||||||
| 57 - 72 | 1 | 0.74 | 0.66 | 0.69 | 0.66 | 0.60 | |||||||
| 72 - 108 | 1 | 0.73 | 0.73 | 0.72 | 0.65 | ||||||||
| 108 - 130 | 1 | 0.66 | 0.64 | 0.58 | |||||||||
| 130 - 140 | 1 | 0.69 | 0.60 | ||||||||||
| 140 - 150 | 1 | 0.60 | |||||||||||
| 150 - 165 | 1 | ||||||||||||
| 0 - 15 | 1 | 0.32 | 0.26 | 0.20 | 0.06 | -0.02 | -0.18 | -0.37 | -0.21 | -0.16 | -0.19 | -0.19 | -0.13 |
| 15 - 22 | 1 | 0.17 | 0.13 | 0.06 | 0.01 | -0.12 | -0.24 | -0.15 | -0.10 | -0.16 | -0.16 | -0.11 | |
| 22 - 29 | 1 | 0.21 | 0.18 | 0.13 | -0.06 | -0.26 | -0.21 | -0.19 | -0.22 | -0.20 | -0.14 | ||
| 29 - 36 | 1 | 0.23 | 0.14 | -0.002 | -0.20 | -0.24 | -0.22 | -0.17 | -0.15 | -0.14 | |||
| 36 - 43 | 1 | 0.33 | 0.15 | -0.15 | -0.29 | -0.27 | -0.25 | -0.22 | -0.13 | ||||
| 43 - 50 | 1 | 0.16 | -0.08 | -0.20 | -0.21 | -0.21 | -0.18 | -0.10 | |||||
| 50 - 57 | 1 | 0.12 | -0.07 | -0.05 | -0.05 | -0.06 | -0.03 | ||||||
| 57 - 72 | 1 | 0.12 | 0.15 | 0.20 | 0.15 | 0.12 | |||||||
| 72 - 108 | 1 | 0.22 | 0.20 | 0.20 | 0.13 | ||||||||
| 108 - 130 | 1 | 0.21 | 0.19 | 0.12 | |||||||||
| 130 - 140 | 1 | 0.28 | 0.16 | ||||||||||
| 140 - 150 | 1 | 0.19 | |||||||||||
| 150 - 165 | 1 |
| (MeV) Bins | 35 - 55 | 55 - 75 | 75 - 100 | 100 - 125 | 125 - 150 | 150 - 200 | 200 - 350 |
|---|---|---|---|---|---|---|---|
| Measurement in bin | 1.42 | 1.42 | 1.29 | 1.21 | 1.06 | 0.82 | 0.501 |
| nucleon | 0.34 (0.25) | 0.26 (0.14) | 0.20 (0.09) | 0.15 (0.08) | 0.14 (0.07) | 0.11 (0.05) | 0.076 (0.036) |
| Bins (MeV) | 35 - 55 | 55 - 75 | 75 - 100 | 100 - 125 | 125 - 150 | 150 - 200 | 200 - 350 |
|---|---|---|---|---|---|---|---|
| 35 - 55 | 1 | 0.73 | 0.68 | 0.58 | 0.52 | 0.51 | 0.46 |
| 55 - 75 | 1 | 0.84 | 0.72 | 0.66 | 0.65 | 0.62 | |
| 75 - 100 | 1 | 0.80 | 0.75 | 0.73 | 0.69 | ||
| 100 - 125 | 1 | 0.84 | 0.80 | 0.72 | |||
| 125 - 150 | 1 | 0.83 | 0.77 | ||||
| 150 - 200 | 1 | 0.88 | |||||
| 200 - 350 | 1 | ||||||
| 35 - 55 | 1 | 0.41 | 0.22 | -0.13 | -0.28 | -0.41 | -0.44 |
| 55 - 75 | 1 | 0.38 | -0.13 | -0.29 | -0.48 | -0.48 | |
| 75 - 100 | 1 | 0.07 | -0.10 | -0.35 | -0.42 | ||
| 100 - 125 | 1 | 0.41 | 0.14 | -0.21 | |||
| 125 - 150 | 1 | 0.31 | 0.01 | ||||
| 150 - 200 | 1 | 0.41 | |||||
| 200 - 350 | 1 |