First-principles study of superconducting Rare-earth doped CaFe2As2
Abstract
We report a systematic and ab-initio electronic structure calculation of Ca0.75M0.25Fe2As2 with M = Ca, Sr, Eu, La, Ce, Pr, Nd, Pm, Sm, Na, K, Rb. The recently reported experimentally observed structural trends in rare earths-doped CaFe2As2 compounds are successfully predicted and a complete theoretical description of the pressure induced orthorhombic to collapsed tetragonal transition is given. We demonstrate that the transition pressure is reduced by electron doping and rises linearly with the ionic size of the dopants. We discuss the implications of our description for the realization of a superconducting phase.
pacs:
The family of iron based superconductors (SC) continues to grow with the discovery of new systems that add to the hundreds already knownreviewpaglione ; reviewmazin ; reviewstewart . However, in spite of this enormous amount of experimental data, an ab-initio theory describing these superconductors is still missing, and the search for new materials is guided only by some observed features that appear to be in common.
Even if it is not a general rule, the so-called parent compounds do not superconduct without dopingreviewstewart or without applying high pressurereviewChu2 . The rationale for this behavior could be naively ascribed to the necessity to destabilize the orthorhombic (O) antiferromagnetic order of the parent compounds to promote a magnetic mediated pairing fieldMazin . Indeed, superconductivity is realized in tetragonal (T) phases only after the magnetic order is suppressed, although some coexisting phases were discovered in 122 compoundsChu .
In the so-called 122 family (MFe2As2, M=Ca, Ba, Sr) superconductivity can be induced under high pressurereviewChu2 . The critical pressures at which superconductivity is detected varies with MTorikachvili ; Alireza and with the pressure conditionsMittal ; Gianni1 ; Gianni2 ; Colombier ; Kimber ; Uhoya (hydrostatic and non-hydrostatic). At the same time, the members of the 122 family show a pressure induced structural phase transition to a collapsed tetragonal (CT) phaseGoldman ; Pratt . The main experimental evidence of the CT phase transition is the sudden decrease of the lattice parameter and a subsequent increase of the in-plane lattice constant. First-principles calculations were able to describe this phase transition as induced by the formation of a direct As-As bond along the -axis of the tetragonal phase Gianni2 ; Yildirim . The CT phase is predicted to be a non-magnetic phase (the magnetic moment being zero on the Fe sites) in agreement with experimental resultsGoldman which report the disappearance of the magnetic response.
In Ba and Sr 122 compounds, where the O-T and T-CT are well separated in pressureAlireza ; Mittal , it seems that the superconducting phase is realized across the O-T transition (even if the role of non-hydrostaticity of the pressure medium is not clear), while it was debated in CaFe2As2 where the transitions are very near in pressureKreyssig and hysteresis effects are relevant. In fact, for CaFe2As2 the precise nature of the crystallographic structure of the superconducting phase is under debate, but the CT phase obtained under hydrostatic pressure conditionsKreyssig ; Prokes ; Yu seems to be ruled out. This suggests that superconductivity is realized in a tetragonal paramagnetic structure (not collapsed) realized only under non-hydrostatic conditionsPratt . This phase should be characterized by the proximity of a magnetic instability absent in the CT phase.
This subject was revived with the discovery of high temperature superconductivity (up to 45-49 K) in CaFe2As2 doped with trivalent rare-earth (RE) metal atoms (La, Pr, Ce, Nd) substituting the divalent Ca atomsQi ; Lv ; Goh ; Saha ; Gao . It was demonstrated that rare earths have high solubility (up to 27% in Ref. Saha, ) in CaFe2As2 mainly due to close matching between ionic-radii of RE and Ca, and that their incorporation suppresses the low temperature AFM ordering in favor of the superconducting phase. Application of hydrostatic pressure on the doped materials is shown to increase further the critical temperatureGoh .
Moreover, neutron diffraction experiments as a function of temperature revealed an interesting structural property: depending on the RE dopants, the low temperature phase shows the characteristics of the CT phaseSaha . In fact, some of the systems (Pr, Nd doped for example) exhibit a low temperature phase in which the out-of-plane axis shrinks of about 10% its high temperature value. On the other hand, when doped with La or Ce, this last structural phase transition is not observed. Nevertheless, superconductivity is found irrespective of the presence or not of the O-CT transition.
Recently the scenario was further enriched with the reports of superconductivity in Ca0.67Sr0.33Fe2As2 at high pressurepagl_sr and of quenched Fe magnetic moment in the collapsed tetragonal phase of Ca1-xPrxFe2As2pagl_pr .
At the moment many questions remain to be answered, in particular regarding the origin of the superconducting phase. In addition, the details of the structural and electronic properties of these new phases are still unknown and it is not clear if the magnetic correlations are suppressed/enhanced upon rare-earth doping in the T phase and the cT phasepagl_pr . As a first step in the comprehension, we report first-principles DFTmethods prediction of structural, magnetic and electronic properties of CaFe2As2 upon doping with RE. In addition, we extended the study to isovalent alkaline earths and Eu2+ and consider the effect of hydrostatic pressure on doped systems.
We start our discussion considering the physics of the parent compound, CaFe2As2. Density Functional Theory successfully predicts the structural collapse of the tetragonal phase at a pressure PO→CT of 0.8 GPa, as calculated from the crossing point of the free energy of the two phases (the O and CT). This value is in reasonable agreement with experimental evidences of O-CT phase transition at GPaKreyssig . The difference is in part due to computational accuracy, to the GGA functional and experimental uncertaintiesKreyssig ; Goldman ; Yu . The existence of both O and CT solution at the same pressure, means that the two phases are locally stable. This agrees with the first order nature of the phase transition and suggests possible experimental hysteresis effects, as indeed reportedGoldman .
The calculated CT lattice constant (see Table 1 and Fig. 1) are Å, Å (near the transition pressure), to be compared with experimental values 3.99 Å and 10.62 Å. The O phase has Å, Å and Å, while the experimental valueKreyssig is Å, Å and Å.
The structural collapse reduces the lattice parameter by about 8%, while the and lattice parameters have a expansion of % (as an average between the two orthorhombic directions). The compressibility also changes abruptly. We estimate a bulk modulus () jump across the transition of GPa. The structural transition into the collapsed phase is also accompanied with a magnetic to non-magnetic transition in which the magnetic moment at the iron site drops from to zero. Contrary to the low pressure tetragonal phase, the CT phase is far from any magnetic instability (we could not converge to any magnetic solution), in agreement with the experimental observation of no spin-fluctuations in th CT-phasePratt . This is indeed the observed phenomenology of the O-CT phase transition, that is correctly captured by the DFT-GGA.
We switch now to the description of doped CaFe2As2, focusing our interest on those systems that experimentally show enhanced superconducting properties.
One of the main experimental evidences reported in Ref. Saha, is the observation of a clear discontinuity on the variation of the lattice constants ( and ) as a function of the temperature for 15% doped Praseodymium, pure CaFe2As2 and 8% doped Neodymium (but not in Lanthanum doped).
In order to predict the structural changes upon chemical doping and to understand the experimental results, we simulated the partial chemical substitution at the Ca site with three different dopants: isovalent (Sr and Eu), aliovalent with trivalent electron-dopants RE (the experimentally realized case La, Ce, Pr, Nd and the not yet realized Pm and Sm) and hole-doping with alkali Na, K, Rb. The doping level is fixed to x=25%, well within the experimentally realized doping range in CaFe2As2 Saha ; pagl_sr . We performed structural optimization at different volumes in both non-magnetic and antiferromagnetic (stripe) phase. Phase stability was calculated comparing enthalpy curves as a function of the external pressure. Structural, electronic and magnetic properties are collected in Tab. 1.
| M | |||||
|---|---|---|---|---|---|
| Ca | 0.80 | 87.79 | 82.78 | 3.63 | 1.45 |
| Sr | 2.24 | 89.60 | 84.86 | 9.27 | 1.34 |
| Eu | 0.48 | 87.75 | 82.59 | 2.26 | 1.37 |
| La | 0.33 | 88.99 | 84.08 | 1.47 | 1.43 |
| Ce | -0.16 | 88.64 | 83.55 | -0.74 | 1.40 |
| Pr | -0.35 | 88.10 | 83.23 | -1.50 | 1.42 |
| Nd | -0.63 | 87.71 | 82.87 | -2.95 | 1.44 |
| Pm | -1.07 | 87.40 | 82.44 | -5.22 | 1.45 |
| Sm | -1.27 | 87.07 | 82.15 | -6.29 | 1.45 |
| Na | 1.16 | 87.43 | 82.54 | 4.99 | 1.22 |
| K | 4.19 | 90.19 | 86.57 | 12.66 | 1.14 |
| Rb | 6.06 | 92.08 | 88.61 | 14.78 | 1.10 |
The characteristic transition pressure PO→CT from the orthorhombic to the collapsed tetragonal phase as obtained in the pure CaFe2As2 is strongly affected by the chemical substitution. In particular, Ce, Pr, Nd, Pm and Sm are stable in the collapsed phase already at ambient (zero) pressure, while a positive pressure is needed to induce a collapse in Sr, Eu, La, Na, K and Rb substituted systems. This behavior is in excellent agreement with the available experimental data reported by Saha and coworkers Saha ; pagl_sr .
In fact, Pr is reported to induce the structural collapse already at a concentration between 5% and 7.5% ; Nd is collapsed at 8% of doping, while no collapse is reported by La doping up to 27% of doping. In particular, we nicely predict the existence of the CT phase at 2.24 GPa in Sr doped CaFe2As2 as experimentally observedpagl_sr .
On the contrary, Ce is not observed in the collapsed tetragonal phase up to a 22% of content, contrary with the theoretical predictions. However, Ce was predicted to be at the boundary of the phase transition, in fact we find the collapsed phase only very slightly more stable than the O phase by 0.7 meV/f.u. and is sufficient a tiny positive pressure to induce it (see Fig. 1).
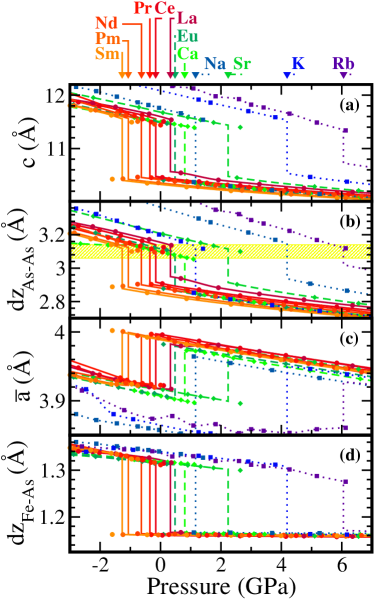
The evolution of the crystal structure upon doping and pressure is reported in Fig. 1. The data from the simulations on the two phases have been connected with a spline fit jumping at the calculated transition pressure. Lattice constants, as a function of pressure, show the characteristic drop of the -axis (see Fig. 1(a) ).
An excellent agreement between theoretical and experimental lattice parameters (not shown) is observed when comparing the low-temperature experimental lattice constantsSaha with the calculated ones in the non-magnetic tetragonal phase (CT), confirming the validity of DFT in the description of this phase. On the other hand, the high temperature phase is a magnetic (probably paramagnetic tetragonal) phase, whose description is improved, within DFT-GGA, including magnetic polarization of the Fe sites.
The internal relaxation shows an interesting pressure dependence of the Fe-As interlayer distance (). In the O phase it decreases monotonically with the applied pressure while it becomes constant and material independent in the CT phase (as shown in Fig. 1(d) ). Due to this feature in this second phase the lattice parameter depends only on the size of the impurity atom and can be considered a measure of its ionic radius in this class of compounds.
Being originated by the formation of As-As bond, the phase transition to the collapsed phase happens when the interlayer As-As separation () reaches the critical value of 3.0Å (about twice the As covalent radius)Gianni2 , independently of the dopant (shown in Fig. 1(b)). Indeed, this last result is confirmed by X-rays diffraction measurements of Saha and coworkers which suggestedSaha that the key parameter that controls the collapse is the As-As distance.
Then, if we look at the correlation between the lattice parameter (in the CT phase) and the transition pressure PO→CT, we find a very interesting correlation. For all trivalent lanthanides the transition pressure scales linearly with the value of the lattice ( with the ionic size). The same happens for bivalent and mono-valent dopants, although with different linear coefficients, see Fig. 2.
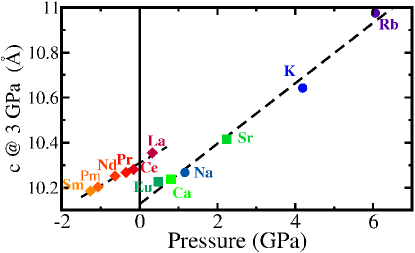
This clearly tells that PO→CT is determined by the size of the impurity atom and the kind and level of doping, with electron doping favoring the CT transition;
In fact, a smaller ionic size favors the structural collapse because when As atoms get closer their interaction becomes stronger and the required pressure to induce the O-CT transition is low (or zero).
The valence of the dopant, on the other hand, also affects the transition pressure. We observe that the hole doping induced by the alkali is mainly located inside the Fe-As layer, not affecting sensibly the As-As vertical bonding energy, while electron doping fills the As-As bonding states, favoring the chemical bonding. To support this picture we plot in Fig. 3(a) the periodic part of two states belonging to the same electronic band but taken above and below the Fermi energy (indicated in figure). The interlayer bonding character is stronger above than below, therefore while electron doping contributes to the interlayer bonding, hole doping affects it only to a little extent.
At this point we switch to the second part of our analysis. We focus on the electronic properties and their doping dependence. The non-magnetic band structure of undoped CaFe2As2 in the bct unit cell is plotted in Fig. 3(b). We observe that both O (not shown) and CT phases show a depletion of states at the Fermi energy, with respect to this non-magnetic high-temperature phase. In the former case this is due to a magnetic splitting, while in the latter to chemical splitting of bonding and antibonding state in As.
Considering the O phase, the electronic effects of aliovalent atoms can not be predicted by means of a rigid band approximation because of the doping dependence of the magnetic moment (see Tab. 1), that strongly affects the band structure near the Fermi energy. On the other hand in the CT phases of all the investigated systems (near the critical lattice constants) a rigid shift of the Fermi level reproduces very well the dopant induced modifications of the electronic structure. This is clearly seen comparing the DOS of different compounds as shown in the lower panel of Fig. 3.
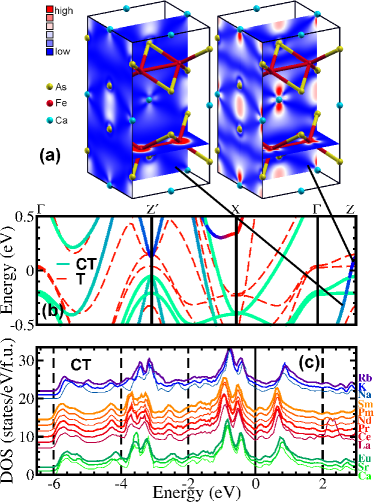
Thus, apart from a small ( eV) rigid shift of the Fermi level, the non-magnetic band structure of the compressed tetragonal phase of CaFe2As2 (shown in Fig. 3) is a good approximation for that of (superconducting) RE-doped CaFe2As2 comment .
The structural collapse induced by the dopants profoundly changes the topology of the Fermi surface with respect to the non-magnetic tetragonal phase as it does in undoped CaFe2As2. The two-dimensional, cylindrical, hole FS’s at the point disappear upon compression and three dimensional FS appear as a consequence of band crossing the Fermi energy along the - direction of the Brillouin zone. Thus, in the CT phase it is very difficult to recognize the characteristic topology of FS common to other pnictides superconductors, and that are thought to be the basic ingredient of the SC pairing (namely the nearly nested cylindrical Fermi surfaces). In addition, the magnetic moment of Fe site is predicted to be completely quenched in the CT as recently confirmed by NMR 75 As spectra in Pr doped CaFe2As2 pagl_pr .
A possible scenario to reconcile the theoretical description and the experimental evidences could be the same proposed by Prokěs and coworkersProkes to explain the superconducting phase in pure CaFe2As2 under pressure: superconductivity can exist because of the formation of a new tetragonal phase (stabilized by chemical and/or strain/non-hydrostatic effects) which prevents both the magnetic and the structural phase transition, then retaining the characteristic electronic properties that makes it unstable toward superconductivity. We, thus, call for further experiments aimed to characterize the electronic, magnetic and structural properties of these new superconductors, in order to elucidate the nature of the non-collapsed tetragonal phase
Within the parameter-free DFT-GGA computational framework we explain the observed low-temperature and pressure phase transitions observed experimentally in RE-doped CaFe2As2 and we predict, giving a rationale, the pressure dependent structural trends.
We show that, when realized, the low temperature CT phases induced by RE substitutions are indeed non-magnetic, with electronic band structures sharing the same features of the band structure of the CT phase of pure CaFe2As2. Characteristic features promoting the superconducting phase are missing. For this reason, the superconducting instability, if it is confirmed to be present in the compressed phases of RE-doped CaFe2As2 seems to open a new chapter in the physics of iron-based superconductors. However a scenario that we find more likely is that superconductivity appears in a non collapsed subphases as it was suggested by Proǩes and coworkers for undoped CaFe2As2.
I Acknowledgments
S.M. acknowledges support by the Italian MIUR through Grant No. PRIN2008XWLWF9.
References
- (1) J. P. Paglione and R. Green, Nature Physics 6, 645 (2010).
- (2) I. I. Mazin, Nature 464, 183 (2010).
- (3) G. R. Stewart, Rev. Mod. Phys. 83, 1589 (2011).
- (4) C. W. Chu and B. Lorenz, Phys. C Supercond. 469, 385 (2009).
- (5) I.I. Mazin, D.J. Singh, M.D. Johannes and M.H. Du, Phys. Rev. Lett. 101, 057003 (2008).
- (6) J-H. Chu, J.G. Analytis, C. Kucharczyk and I.R. Fisher, Phys. Rev. B 79, 014506 (2009).
- (7) M. S. Torikachvili, S. L. Bud’ko, N. Ni and P. C. Canfield, Phys. Rev. Lett. 101, 057006 (2008).
- (8) P. L. Alireza et al., J. Phys. Condens. Matter. 21, 012208 (2008).
- (9) R. Mittal et al., Phys. Rev. B 83, 054503 (2011).
- (10) N. Colonna, G. Profeta and A. Continenza, Phys. Rev. B 83, 224526 (2011).
- (11) N. Colonna, G. Profeta, A. Continenza and S. Massidda Phys. Rev. B 83, 094529 (2011).
- (12) E. Colombier, S. L. Budko, N. Ni and P. C. Canfield, Phys. Rev. B 79, 224518 (2009).
- (13) S. A. J. Kimber et al., Nat. Mater. 8, 471 (2009).
- (14) W. Uhoya et al., Phys. Rev. B 82, 144118 (2010).
- (15) A. I. Goldman et al., Phys. Rev. B 79, 024513 (2009).
- (16) D.K. Pratt et al., Phys. Rev. B 79, 060510(R) (2009).
- (17) T. Yildirim, Phys. Rev. Lett. 102, 037003 (2009).
- (18) A. Kreyssig et al., Phys. Rev. B 78, 184517 (2008).
- (19) A. Prokěs et al., Phys. Rev. B 81, 180506(R) (2010).
- (20) W. Yu et al., Phys. Rev. B 79, 020511(R) (2009).
- (21) Y. Qi et al., Supercond. Sci. Technol. 25, 045007 (2012).
- (22) B. Lv et al., PNAS, 108, 15705 (2011).
- (23) S.R. Saha et al., Phys. Rev. B 85, 024525 (2012).
- (24) Z. Gao et al., Europhys. Lett. 95, 67002 (2011).
- (25) S.K. Goh et al., arXiv:1107.0689 (2011).
- (26) J.R. Jeffries et al., Phys. Rev. B 85, 184501 (2012).
- (27) L. Ma et al., arXiv:1205.0604 (2012).
- (28) All calculations have been performed with the Vienna ab-initio Simulation Packagevasp1 ; vasp2 . We use pseudopotentials of Projector Augmented WavePAW type and the gradient corrected exchange correlation functional of Perdew, Burke and ErnzerhofPBE (GGA-PBE). A cutoff to the planewave expansion has been converged to the value of 500 eV. We make use of a simulation unit cell with 4 formula units (f.u.) of CaFe2As2. With this cell we simulate 25% of doping level. A -points mesh has been used. Rare-earth atoms pseudopotentials were constructed including f-electrons into the core. All magnetic calculations converged to the striped antiferromagnetic phase.
- (29) G. Kresse and J. Furthmuller, Phys. Rev. B 54, 11169 (1996).
- (30) G. Kresse and J. Furthmuller, Comput. Mater. Sci. 6, 15 (1996).
- (31) P.E. Blochl, Phys. Rev. B 50, 17953 (1994).
- (32) J.P. Perdew, K. Burke and M. Ernzerhof, Phys. Rev. Lett. 77, 3865 (1996).
- (33) With this model system, we are indeed neglecting possible disorder effects and the role of the electron dopant. However, the model should grasp the main electronic properties of the compressed system.