Income Inequality in the 21st Century
A biased summary of Piketty’s Capital in the Twenty-First Century
Dietrich Stauffer
Institute for Theoretical Physics, Cologne University, D-50923 Köln, Euroland
Abstract: Capital usually leads to income, and income is more accurately and easily measured. Thus we summarise income distributions in USA, Germany, etc.
Diagnosis
The share of total income going to the top % adults is shown on a logarithmic scale for the USA and Germany in Fig.1. Here we imagine all adults ordered from top to bottom according to their pre-tax income, with the richest on top and the poorest on bottom. Top % refer to the fraction of people, not the number of dollars or euros.

==============================================

Figure 1 shows that the top % people get much more than % of the total income. In the USA their share went down from before World War I to about 1975, and then up again. For Great Britain and Sweden this U-shape was similar except that the recent increase was somewhat and much weaker, respectively.
For Germany, as shown in the bottom part of Fig.1, the recent increase is seen only for the % data, not at % and 1 %. This exception shows that sometimes it is not good to concentrate only at the very rich ( %); the Gini index or the income ratio of the richest to the poorest fifth, disliked by Piketty, may then be better indicators of inequalities, Fig.2. (The Gini index is the average income difference between two people, divided by the average income in the whole population.)
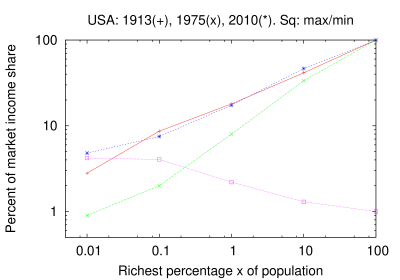
Fig.3 plots double-logarithmically the shares in the years 1910, 1975 and 2010 versus for the USA. We see three roughly straight lines, corresponding to Pareto-like power laws, Piketty p. 367; they approach nicely the trivial limit of a 100 % share at %. Approximately they follow a square root: A nine times larger fraction of the population has only a three times larger summed income, since each individual then has on average a three times lower income. The changes over the last century then lead to deviations, in both directions, from this primitive square-root law. The fourth line, decaying with increasing , gives the ratio of the large shares (1910 and 2010) to the smaller shares at the minimum around 1975. This fourth line of squares shows that larger lead to less variation during the last century.

==============================================

Piketty’s explanation for these inequalities is the accumulation of capital as long as the (re-invested) return (dividends, interests, ) on capital is appreciably larger than the average economic growth . ( is the average rate after taxes.) This was the case before World War I and now started to be the case again, while the two world wars and the Great Depression around 1930, together with the tax increases enforced by these catastrophes, reduced the accumulated capital. Growing inequalities were restarted around 1980 by a change in capitalist ideology around 1980 reducing income taxes in the USA and Great Britain; Piketty does not mention kinder explanations like oil price shocks, growing unemployment, stagflation in the 1970s and the wish of governments to overcome these difficulties.
Therapy
In order to avoid a further growth of inequalities above the 1910 level, Piketty suggests three progressive taxes, i.e. tax rate increasing with increasing income/capital: Maximal income tax rates (p. 513, 640) of 80 to 90 % for the top (half) percent should create more “morality”, and 50 to 60 % for the following 5 to 10 % more government revenue for social purposes. A tax on capital ( p. 517, 528, 543, 572), regionally agreed upon e.g. for the European Union, could start with 0.1 % below 200,000 US dollars, then 0.5 % up to one million, 1 % between 1 and 5 million, and 2 % thereafter (perhaps 5 or 10 % above 1000 million dollars). Finally, also inheritances should be taxed at a rate the higher the larger the amount.
Piketty does not mention that capital is more difficult to measure (how much worth is my container-ship fund today?) and more easy to hide (diamonds buried in my garden) than income, and requires greater administration costs than income tax. It seems more practical for me to increase appropriately the income tax. Piketty’s figures on pages 354 and 356 predict for the next four decades, 2012 to 2050, an annual growth rate % world-wide, and a pre-tax return %. After tax shrinks to 3.9 %, and thus doubling the tax rate should decrease further to about 3.5 %, nearly in equilibrium with %.
Doubling income tax rates above 50 % is impossible, and even 75 % in peace is a problematic rate, as shown by Hollande and Depardieu. But Germany at present has a flat rate of 25 % for taxing , and doubling it to 50 % would bring it close to the maximum rate for other income (wages, ). It could be sufficient to defend the present 25 % rate against demands to reduce it since Piketty assumes (p. 355) that it shrinks to 10 % because of international tax dumping to attract capital. With 25 % instead of 10 % tax on the above calculation reduces to %, just equal to as desired (p. 563).
The tax for the other income still could be increased to earlier values; Fig.4 shows it for the Federal Republic of Germany, and marks also the “solidarity” surtax (5.5 % of the income tax to be paid.) Also the income threshold beyond which this maximum rate applied was much lower in 1999 than now. Back to Kohl ?!

References
Thomas Piketty, Capital in the Twenty-First Century. Belknap-Harvard University Press, Cambridge (MA) 2014.
Emmanuel Saez, http://eml.berkeley.edu/ saez/saez-UStopincomes-2012.pdf, Sept. 2013. See also T. Piketty & E. Saez, Science 344, 838 (2014).