Dust in Active Galactic Nuclei: Anomalous Silicate to Optical Extinction Ratios?
Abstract
Dust plays a central role in the unification theory of active galactic nuclei (AGNs). However, little is known about the nature (e.g., size, composition) of the dust that forms a torus around the AGN. In this Letter we report a systematic exploration of the optical extinction () and the silicate absorption optical depth () of 110 type 2 AGNs. We derive from the Balmer decrement based on Sloan Digital Sky Survey data, and from the Spitzer/InfraRed Spectrograph data. We find that with a mean ratio of , the optical-to-silicate extinction ratios of these AGNs are substantially lower than that of the Galactic diffuse interstellar medium (ISM) for which . We argue that the anomalously low ratio could be due to the predominance of larger grains in the AGN torus compared to that in the Galactic diffuse ISM.
Subject headings:
dust, extinction — galaxies: active — galaxies: ISM — infrared: galaxies1. Introduction
Active galaxies are eye-catching due to the ongoing energetic accretion of nuclear material by their central supermassive black holes. Observations have shown that a large fraction of such activities are obscured by large columns of dust and gas. The unified model of active galactic nuclei (AGNs; see Antonucci, 1993), which features a torus-shaped structure of obscuring material, successfully explains a large number of AGN observables. Nevertheless, the properties of the dust in AGNs remain poorly understood (see Li, 2007).
An accurate knowledge of the dust extinction is crucial to recover the AGN intrinsic spectra, and it also influences the estimation of important parameters such as the AGN luminosity, black hole mass, and Eddington ratio. Numerous efforts have been made to expand such knowledge but have led to contradicting results: statistical studies on the reddening of quasars suggest a steeply rising extinction curve like (or even steeper than) that of the Small Magellanic Cloud (SMC), which indicates the predominance of small grains (Hall et al., 2002; Richards et al., 2003; Hopkins et al., 2004; Glikman et al., 2012; Jiang et al., 2013), while a flat or “gray” extinction curve (which varies little with wavelength) has also been proposed, which suggests the richness of large grains (Gaskell et al., 2004; Czerny et al., 2004; Gaskell & Benker, 2007). We note that in deriving these AGN extinction curves, one could suffer from the possible variations in the AGN intrinsic spectra, orientation effects, or potentially biased sampling (Czerny, 2007).
Alternatively, one could also probe the dust size and composition through the dust infrared (IR) spectroscopy of AGNs. As shown in Li et al. (2008), Smith et al. (2010), and Köhler & Li (2010), the 9.7 silicate emission (Hao et al., 2005b; Siebenmorgen et al., 2005; Sturm et al., 2005) and absorption (Jaffe et al., 2004) spectra of AGNs are diagnostic of the silicate composition and size.
Dust size could also be probed through , the ratio of the visual extinction to the 9.7 silicate absorption depth (Gao et al. 2010; Z. Shao et al. 2014, in preparation): for compact, spherical silicate dust, peaks at a grain size of and drops precipitously with the increase of the dust size. In the local interstellar medium (ISM) of the Milky Way, (Roche & Aitken 1984; see Table 1 of Draine 2003 for a summary). In this Letter we report a considerably lower ratio for 110 type 2 AGNs (Section 3), with determined from the Balmer decrement based on the Sloan Digital Sky Survey (SDSS) data, and from the 9.7 Spitzer/InfraRed Spectroscope (IRS) absorption spectra (Section 2). The anomalously low ratio suggests the predominance of larger grains in the AGN torus compared to the typical size of in the Galactic diffuse ISM (Section 4).
2. Data and Measurements
2.1. Sample
We collect all type 2 AGNs from the S3AGA sample (Spitzer/IRS-SDSS Spectral Atlas of Galaxies and AGN; L. Hao et al. 2014, in preparation). S3AGA is a heterogeneous collection of galaxies that have Spitzer/IRS (Houck et al., 2004) low-resolution spectra and SDSS spectroscopic observations (Data Release 7; Abazajian et al. 2009) within a 3′′ searching radius. The whole S3AGA sample contains 139 type 1 AGNs, 114 type 2 AGNs, 241 star-forming (SF) galaxies, 103 AGN-SF composites, and 1 quiescent galaxy. These classifications are made based on their SDSS optical spectra (see Hao et al., 2005a). Type 1 AGNs are those with broad H emission lines (with FWHM 1200). Type 2 AGNs are identified with the typical “Baldwin, Phillips & Terlevich” diagram (Baldwin et al., 1981). This sample spans a redshift range of 0.001–0.25, corresponding to a physical size of 0.06–18 kpc in the SDSS 3″ aperture.
The low-resolution mid-IR spectra of Spitzer are adopted from the Cornell Atlas of Spitzer/IRS Sources (CASSIS; Lebouteiller et al., 2011). We use the CASSIS v4 data. In this version, the intermediate products of the Spitzer Science Center (SSC) pipeline release S18.7.0 are processed with the SMART software with a dedicated spectral extraction pipeline developed by the CASSIS team. We further combine the spectra of the Short-Low (SL) and Long-Low (LL) modules and scale the observed flux of LL to SL. Spikes and edge fringes are removed carefully. The final order-combined mid-IR spectra span a wavelength coverage of 5.2–38 in the observer’s frame, with a spectral resolution of 60–127. We do not apply any aperture correction since the fiber size of SDSS (3″) and slit width of Spitzer/IRS SL (3.6) are comparable.
2.2. Extinction Determination
The Balmer decrement can be used to trace the optical extinction: the difference between the observed and intrinsic ratios of two hydrogen recombination lines yields the amount of dust reddening. For the SDSS spectra, we subtract the stellar continuum, decompose the [N II]+H region and H region with multiple Gaussian components, and examine each fit by eye with the aid of the statistic.
We estimate the visual extinction from the measured ratios, assuming a “screen” dust configuration:
| (1) |
where
| (2) |
and are the extinction at the H (6562 Å) and H (4831 Å) bands, respectively. The parameter only depends on how the extinction varies with wavelength: the grayer an extinction curve is, the larger is. For a gray-type extinction curve such as Gaskell et al. (2004), (see Table 1). We adopt a standard “Case B” recombination for the intrinsic Balmer decrement, i.e., (Osterbrock & Ferland, 2006).
We define the silicate strength as
| (3) |
where is the wavelength of the 9.7 silicate feature peak, and are the corresponding observed and continuum intensity, respectively. We estimate the silicate continuum using the interpolation method of Spoon et al. (2007) and the PAHFIT decomposition method (Smith et al., 2007). In general, the results based on these two methods agree well. The final adopted 9.7 silicate strength is derived based on the interpolated continuum with the offset between these two approaches as the error (See L. Hao et al. 2014, in preparation for details).
We do not apply Galactic extinction correction on any spectra, since none of our objects locates along the Galactic plane. SDSS J031501.41+420208.9 is the closest to the Galactic plane with its Galactic latitude at .
3. Results: Anomalously Low Ratios in Type 2 AGNs
For a “screen” dust configuration, . Therefore, one would expect a relation between the silicate absorption strength and the Balmer decrement:
| (4) |
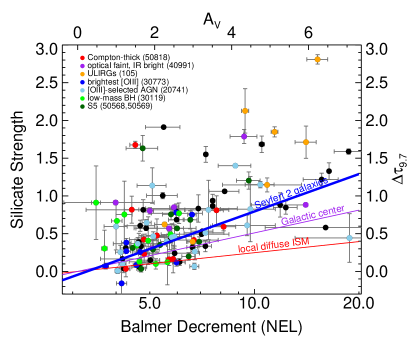
Figure 1 shows the distribution of this sample on a plot of the observed Balmer decrement versus the observed silicate strength . A linear relation between and is clearly seen (albeit with a large scatter). The slope of the correlation is . For an assumed dust configuration, this slope is uniquely determined by the observed and . Hence, for a given extinction law, .
Guided by Equation (4), we perform a linear weighted least-squares fit to the observationally determined parameters and shown in Figure 1. The Spearman correlation test gives a coefficient with significance , suggesting a moderate correlation between and . Assuming a Gaskell et al.-type extinction curve (Gaskell et al., 2004) for which , we obtain . The bootstrap method is used to estimate the errors of the fitted parameters with 5000 realizations (sampling with replacement), and the resulting uncertainty for is 2.4. In the fitting, we allow a small value of additional intercept to account for the term and the possible measurement uncertainties. The fitted additional intercept of is indeed small.
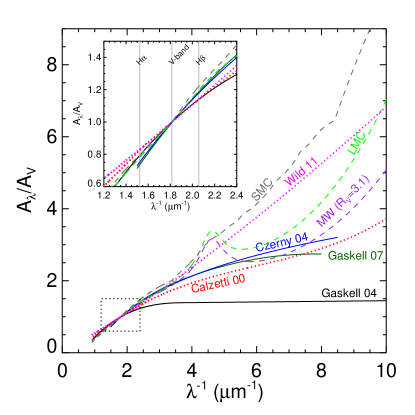
The ratio obtained above is significantly lower than that of the Galactic diffuse ISM (, see review by Draine 2003). As shown in Figure 2 and Table 1, the Gaskell et al. (2004) extinction curve is the grayest and corresponds to the largest among all the extinction laws commonly considered in AGN studies. As a result, any other extinction curve would give an even lower .
The scatter of the correlation shown in Figure 1 is large (with a reduced ). This is understandable since the intrinsic properties of the dusty structures may be very different among type 2 AGNs. It is also possible that there exists a systematic secondary effect in the correlation causing the scatter (see discussion in Section 4). Nevertheless, it is clear, as can be seen from Figure 1, that most type 2 AGNs lie above the lines given by the Galactic ratios.
In our fitting, we exclude 4 out of the 114 type 2 AGNs in the S3AGA sample: 3 of them have the Balmer decrement signal-to-noise ratio smaller than 3.0 and 1 source shows . Sample selection is unlikely to bring significant bias on our result. Our 110 AGNs are selected from 29 Spitzer programs whose scientific goals are substantially different, without a single program dominating the sources or clustering in Figure 1 (see the color-coded data points).
| Extinction Law | ||||
|---|---|---|---|---|
| Gaskell et al. (2004) | 1.34 | 1.21 | 3.61 | 5.5 |
| Gaskell & Benker (2007) | 1.61 | 1.37 | 2.25 | 3.4 |
| Czerny et al. (2004) | 1.60 | 1.37 | 2.27 | 3.5 |
| MW = 3.1 | 1.51 | 1.29 | 2.44 | 3.7 |
| LMC Average | 1.53 | 1.23 | 2.30 | 3.5 |
| SMC | 1.54 | 1.28 | 2.38 | 3.6 |
| Wild et al. (2011) | 1.37 | 1.20 | 3.22 | 4.9 |
| Calzetti et al. (2000) | 1.53 | 1.30 | 2.44 | 3.7 |
Note. — where .
4. Discussion
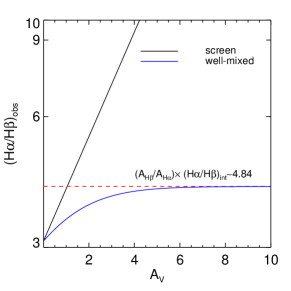
The “screen” dust configuration is a simple assumption for the obscuring AGN dust structure. To examine the possible effects caused by the deviation from a “screen” configuration, we consider two cases: (1) one is an extreme case in which the dust is assumed to thoroughly mix with the light source, but the dust distribution is still “smooth,” and (2) one is a clumpy distribution of discrete dust clouds (e.g., see Nenkova et al. 2008a, b; Nikutta et al. 2009).
In a “well-mixed” geometry, the observed intensity relates to the intensity of the source through , where is the optical depth () at wavelength (Mathis, 1972). Therefore, the visual extinction can be deduced from the observed Balmer decrement through
| (5) |
As shown in Figure 3, for a given extinction curve (which specifies , , and ), the “mixed” dust geometry always requires a larger optical extinction to account for the same Balmer decrement . In this case, we will derive a higher compared to the “screen” scenario for the same Balmer decrement and silicate data. Meanwhile, as can be seen in Equation (5) and in Figure 3, the observed Balmer decrement cannot exceed (corresponding to for the extinction curve of Gaskell & Benker 2007), for any reasonable extinction curves considered in Figure 2 and in Table 1. However, as shown in Figure 1, a large fraction of the sources have and they dominate the overall trend of . Therefore, the obscuring dust can not be in a “well-mixed” geometry. For the 9.7 silicate optical depth, one would expect some degree of mixing since the silicate dust in the warm inner torus will emit at 9.7. Taking into account the silicate emission, one should derive a higher and hence an even lower .
For a clumpy torus, we assume a Poisson distribution of discrete clouds. Let be the average number of clouds along a radial equatorial line of sight, and let be the optical depth of a single cloud at wavelength . The observed intensity becomes . For the “screen” configuration, we can consider the “screen” as a smooth, continuous distribution of clouds. Hence the optical extinction and silicate optical depth are and , respectively. Consequently, the ratio of the clumpy to the screen becomes . It is easy to show . Therefore, the low optical-to-silicate extinction ratio of derived in Section 3 indeed seems to already be in the high end. Nevertheless, we note that in reality, the actual optical depth of a clumpy geometry can be much more complicated than assumed above. Besides, a clumpy geometry cannot produce silicate depths greater than (e.g., see Levenson et al., 2007; Nikutta et al., 2009), while a number of S3AGA AGNs have silicate absorption . Thus, detailed modeling is needed to fully address this issue.
Dust scatters and absorbs light most effectively when its size is comparable to the wavelength of the light (i.e., ). For the optical light, grains of are an effective scatter and absorber. For larger grains (say, ), they are less effective in extinguishing the optical light but become effective in producing the 9.7 silicate absorption feature (see Z. Shao et al. 2014, in preparation). The low ratio of AGNs could readily be explained in terms of dust larger than the submicro-sized interstellar dust. In Figure 4, we show the optical-to-silicate extinction ratios () as a function of grain radii for compact, spherical silicate grains calculated from Mie theory and the dielectric functions of “astronomical silicates” from Draine & Lee (1984). It is seen that peaks at and rapidly decreases with the increase of . At , we see . Meanwhile, as shown in Figure 4, one could also achieve with . However, it is unlikely for these small grains to survive in the hostile AGN circumnuclear environments, and the spectroscopic studies of the 9.7 silicate feature of AGNs all point to dust much larger than (see Li et al., 2008; Köhler & Li, 2010; Smith et al., 2010). We note that the observed high end of does not necessarily imply that the AGN dust grains are all larger than , since the optical extinction is not exclusively contributed by silicate dust, although the fractional contribution of carbon dust to is not known.

There is evidence that suggests that the dust in the AGN torus is larger than the dust in the ISM. The gray extinction derived for AGNs implies that the size distribution of the dust in AGNs is skewed toward substantially large grains (see Section 1). Some infrared interferometry studies also show various indications that the grain size around the torus might be larger (Kishimoto et al., 2007, 2009; Hönig et al., 2013; Burtscher et al., 2013). Maiolino et al. (2001b) found that, for 16 of the 19 AGNs they studied, their and are significantly lower than the Galactic standard values. Maiolino et al. (2001a) ascribed these reduced ratios in AGNs (often with a solar or higher metallicity) to grain growth through coagulation in the dense circumnuclear regions. In this case, we could expect a dust size distribution skewed toward large grains, leading a flat extinction curve (but see Weingartner & Murray, 2002, , who argued that the X-ray absorption and optical extinction may occur in distinct media). We note that the preferential destruction of small dust by X-ray photons in the AGN torus could also lead to the predominance of large dust and result in reduced and ratios.
A low ratio could also be caused by a smaller abundance of carbonaceous dust in AGNs than in the ISM. Toward the Galactic center, the optical-to-silicate extinction ratio is (Roche & Aitken, 1985) which is just 1/2 of that of the local ISM. Roche & Aitken (1985) attributed this to the relative abundance of carbonaceous dust to silicate dust: in the Galactic center there are more oxygen-rich stars which make silicate dust (but see Gao et al., 2010). In AGN torus, if carbon dust is preferentially destroyed, one would also expect a low ratio since carbon dust only contributes to while silicate dust contributes to both and . The harsh radiation in AGNs is expected to destroy dust. However, Perna et al. (2003) found that, subject to X-ray/UV radiation, silicate grains would be preferentially destroyed with respect to graphite.
Leipski et al. (2007) derived (from the narrow line Balmer decrement) and silicate optical depth for a type 2 AGN J12324114+1112587. This also implies a low optical-to-silicate extinction ratio of compared with the Galactic value. Leipski et al. (2007) explained this as that the optical extinction and the silicate absorption may take place at different regions: the silicate absorption mainly arises from the dust which is concentrated toward the center of the galaxy, while the NLR emission comes from larger scales and is additionally absorbed by ambient dust in the host galaxy. Goulding et al. (2012) explored the origin of the 9.7 silicate absorption in 20 nearby () Compton-thick AGNs. They accurately measured the silicate absorption in archival low-resolution Spitzer/IRS spectroscopy. They found that 45% of the sources have strong silicate absorption with . Differing from Leipski et al. (2007), Goulding et al. (2012) argued that the dominant contribution to the observed silicate absorption is made by the dust located in the host galaxy and not necessarily in a compact obscuring torus surrounding the central engine. We note that the discussions on the low ratio presented in this work are based on the assumption that both the optical extinction and the silicate absorption are from the torus. The optical extinction derived from the NLR Balmer decrement may not be fully representative of the torus extinction since the NLR may not be obscured by the entire torus. The extinction can also come from the dust in hosts. However, if the hosts also contribute to the mid-IR extinction, a low value of ratio in AGNs compared to the Galactic ISM can still be expected, since . We call on further studies on the origin of the optical and silicate extinction. Nevertheless, if the optical extinction and the silicate absorption are indeed from very different regions, one should not expect any correlation between and . Mismatches in the extinction regions traced by optical and silicate absorption may act as the secondary effect, at most, in the correlation shown in Figure 1.
5. Summary
We have determined , the ratio of the visual extinction to the 9.7 silicate absorption optical depth, of 110 type 2 AGNs. The mean ratio of is considerably lower than that of the local ISM of the Milky Way. We attribute this anomalously low ratio of AGNs to a dust size distribution skewed toward substantially large grains, as a result of preferential destruction of small grains by X-ray/UV photons and/or grain growth in the dense circumnuclear regions of AGNs.
References
- Abazajian et al. (2009) Abazajian, K. N., Adelman-McCarthy, J. K., Agüeros, M. A., et al. 2009, ApJS, 182, 543
- Antonucci (1993) Antonucci, R. 1993, ARA&A, 31, 473
- Baldwin et al. (1981) Baldwin, J. A., Phillips, M. M., & Terlevich, R. 1981, PASP, 93, 5
- Burtscher et al. (2013) Burtscher, L., Meisenheimer, K., Tristram, K. R. W., et al. 2013, A&A, 558, A149
- Calzetti et al. (2000) Calzetti, D., Armus, L., Bohlin, R. C., et al. 2000, ApJ, 533, 682
- Czerny (2007) Czerny, B. 2007, in ASP Conf. Ser. 373, The Central Engine of Active Galactic Nuclei, ed. L. C. Ho & J.-W. Wang (San Francisco, CA: ASP), 586
- Czerny et al. (2004) Czerny, B., Li, J., Loska, Z., & Szczerba, R. 2004, MNRAS, 348, L54
- Draine (2003) Draine, B. T. 2003, ARA&A, 41, 241
- Draine & Lee (1984) Draine, B. T., & Lee, H. M. 1984, ApJ, 285, 89
- Gao et al. (2010) Gao, J., Jiang, B. W., & Li, A. 2010, EP&S, 62, 63
- Gaskell & Benker (2007) Gaskell, C. M., & Benker, A. J. 2007, arXiv:0711.1013
- Gaskell et al. (2004) Gaskell, C. M., Goosmann, R. W., Antonucci, R. R. J., & Whysong, D. H. 2004, ApJ, 616, 147
- Glikman et al. (2012) Glikman, E., Urrutia, T., Lacy, M., et al. 2012, ApJ, 757, 51
- Goulding et al. (2012) Goulding, A. D., Alexander, D. M., Bauer, F. E., et al. 2012, ApJ, 755, 5
- Hall et al. (2002) Hall, P. B., Anderson, S. F., Strauss, M. A., et al. 2002, ApJS, 141, 267
- Hao et al. (2005a) Hao, L., Strauss, M. A., Tremonti, C. A., et al. 2005a, AJ, 129, 1783
- Hao et al. (2005b) Hao, L., Spoon, H. W. W., Sloan, G. C., et al. 2005b, ApJ, 625, L75
- Hönig et al. (2013) Hönig, S. F., Kishimoto, M., Tristram, K. R. W., et al. 2013, ApJ, 771, 87
- Hopkins et al. (2004) Hopkins, P. F., Strauss, M. A., Hall, P. B., et al. 2004, AJ, 128, 1112
- Houck et al. (2004) Houck, J. R., Roellig, T. L., van Cleve, J., et al. 2004, ApJS, 154, 18
- Jaffe et al. (2004) Jaffe, W., Meisenheimer, K., Röttgering, H. J. A., et al. 2004, Nature, 429, 47
- Jiang et al. (2013) Jiang, P., Zhou, H., Ji, T., et al. 2013, AJ, 145, 157
- Kishimoto et al. (2009) Kishimoto, M., Hönig, S. F., Antonucci, R., et al. 2009, A&A, 507, L57
- Kishimoto et al. (2007) Kishimoto, M., Hönig, S. F., Beckert, T., & Weigelt, G. 2007, A&A, 476, 713
- Köhler & Li (2010) Köhler, M., & Li, A. 2010, MNRAS, 406, L6
- Lebouteiller et al. (2011) Lebouteiller, V., Barry, D. J., Spoon, H. W. W., et al. 2011, ApJS, 196, 8
- Leipski et al. (2007) Leipski, C., Haas, M., Meusinger, H., et al. 2007, A&A, 464, 895
- Levenson et al. (2007) Levenson, N. A., Sirocky, M. M., Hao, L., et al. 2007, ApJ, 654, L45
- Li (2007) Li, A. 2007, in ASP Conf. Ser. 373, The Central Engine of Active Galactic Nuclei, ed. L. C. Ho & J.-W. Wang (San Francisco, CA: ASP, 561
- Li et al. (2008) Li, M. P., Shi, Q. J., & Li, A. 2008, MNRAS, 391, L49
- Maiolino et al. (2001a) Maiolino, R., Marconi, A., & Oliva, E. 2001a, A&A, 365, 37
- Maiolino et al. (2001b) Maiolino, R., Marconi, A., Salvati, M., et al. 2001b, A&A, 365, 28
- Mathis (1972) Mathis, J. S. 1972, ApJ, 176, 651
- Nenkova et al. (2008a) Nenkova, M., Sirocky, M. M., Ivezić, Ž., & Elitzur, M. 2008a, ApJ, 685, 147
- Nenkova et al. (2008b) Nenkova, M., Sirocky, M. M., Nikutta, R., Ivezić, Ž., & Elitzur, M. 2008b, ApJ, 685, 160
- Nikutta et al. (2009) Nikutta, R., Elitzur, M., & Lacy, M. 2009, ApJ, 707, 1550
- Osterbrock & Ferland (2006) Osterbrock, D. E., & Ferland, G. J. 2006, Astrophysics of Gaseous Nebulae and Active Galactic Nuclei (2nd ed.; Sausalito, CA: University Science Books)
- Perna et al. (2003) Perna, R., Lazzati, D., & Fiore, F. 2003, ApJ, 585, 775
- Richards et al. (2003) Richards, G. T., Hall, P. B., Vanden Berk, D. E., et al. 2003, AJ, 126, 1131
- Roche & Aitken (1984) Roche, P. F., & Aitken, D. K. 1984, MNRAS, 208, 481
- Roche & Aitken (1985) —. 1985, MNRAS, 215, 425
- Siebenmorgen et al. (2005) Siebenmorgen, R., Haas, M., Krügel, E., & Schulz, B. 2005, A&A, 436, L5
- Smith et al. (2010) Smith, H. A., Li, A., Li, M. P., et al. 2010, ApJ, 716, 490
- Smith et al. (2007) Smith, J. D. T., Draine, B. T., Dale, D. A., et al. 2007, ApJ, 656, 770
- Spoon et al. (2007) Spoon, H. W. W., Marshall, J. A., Houck, J. R., et al. 2007, ApJ, 654, L49
- Sturm et al. (2005) Sturm, E., Schweitzer, M., Lutz, D., et al. 2005, ApJ, 629, L21
- Weingartner & Murray (2002) Weingartner, J. C., & Murray, N. 2002, ApJ, 580, 88
- Wild et al. (2011) Wild, V., Groves, B., Heckman, T., et al. 2011, MNRAS, 410, 1593