The MASSIVE Survey – I. A Volume-Limited Integral-Field Spectroscopic Study of the Most Massive Early-Type Galaxies within 108 Mpc
Abstract
Massive early-type galaxies represent the modern-day remnants of the earliest major star formation episodes in the history of the universe. These galaxies are central to our understanding of the evolution of cosmic structure, stellar populations, and supermassive black holes, but the details of their complex formation histories remain uncertain. To address this situation, we have initiated the MASSIVE Survey, a volume-limited, multi-wavelength, integral-field spectroscopic (IFS) and photometric survey of the structure and dynamics of the most massive early-type galaxies within a distance of 108 Mpc. This survey probes a stellar mass range and diverse galaxy environments that have not been systematically studied to date. Our wide-field IFS data cover about two effective radii of individual galaxies, and for a subset of them, we are acquiring additional IFS observations on sub-arcsecond scales with adaptive optics. We are also acquiring deep -band imaging to trace the extended halos of the galaxies and measure accurate total magnitudes. Dynamical orbit modeling of the combined data will allow us to simultaneously determine the stellar, black hole, and dark matter halo masses. The primary goals of the project are to constrain the black hole scaling relations at high masses, investigate systematically the stellar initial mass function and dark matter distribution in massive galaxies, and probe the late-time assembly of ellipticals through stellar population and kinematical gradients. In this paper, we describe the MASSIVE sample selection, discuss the distinct demographics and structural and environmental properties of the selected galaxies, and provide an overview of our basic observational program, science goals and early survey results.
Subject headings:
galaxies: elliptical and lenticular, cD — galaxies: evolution — galaxies: kinematics and dynamics — galaxies: stellar content — galaxies: structure — dark matter1. Introduction
The most massive early-type galaxies in the local universe are powerful probes of galaxy evolution. They formed most of their stars rapidly at redshifts (e.g., Blakeslee et al. 2003; Thomas et al. 2005) but have grown in number and size by a factor of two or more since (e.g., Daddi et al. 2005; Trujillo et al. 2006; Faber et al. 2007; van der Wel et al. 2008; Damjanov et al. 2009; Cappellari et al. 2009; van Dokkum et al. 2010; van de Sande et al. 2011), probably in large part through dissipationless merging and accretion (e.g., De Lucia et al. 2006; Boylan-Kolchin et al. 2006; Naab et al. 2009; Kormendy & Bender 2009; Oser et al. 2010; Thomas et al. 2014). They contain nuclear black holes whose masses are correlated with properties of the stellar bulge (e.g., Magorrian et al. 1998; Ferrarese & Merritt 2000; Gebhardt et al. 2000; Tremaine et al. 2002; Marconi & Hunt 2003; Häring & Rix 2004; Gültekin et al. 2009; Beifiori et al. 2012; McConnell & Ma 2013; Kormendy & Ho 2013). These scaling relations between black holes and their host galaxies imply co-evolution between the two components over the lifetime of a galaxy, but the detailed mechanisms remain uncertain.
Integral field spectroscopy (IFS) over a wide radial range provides an effective tool to study the spatial and kinematic structure, star formation histories, and stellar and dark matter halo masses of local galaxies. While many IFS surveys are ongoing, such as VENGA/VIXENS (Blanc et al., 2013), CALIFA (Sánchez et al., 2012), SLUGGS (Brodie et al., 2014), and eventually MaNGA (Bundy et al. in preparation) and SAMI (Croom et al., 2012), none of them probes the volume, mass range, or spatial scales required to systematically study the most massive elliptical galaxies, a regime that is critical for understanding the assembly of galaxies and supermassive black holes. The ATLASproject (Cappellari et al., 2011) surveyed 260 galaxies within 42 Mpc. Because of their relatively small survey volume, only a handful of galaxies had stellar masses . Their field-of-view of provided coverage within one half-light radius of most of their sample galaxies.
In this paper we describe MASSIVE, a volume-limited, multi-wavelength, spectroscopic and photometric survey of the most massive galaxies in the local universe. The sample includes 116 candidate galaxies in the northern sky with distance Mpc and absolute -band magnitude , corresponding to stellar masses . MASSIVE is designed to address a wide range of outstanding problems in elliptical galaxy formation, including the variation in dark matter fraction and stellar initial mass function (IMF) within and among early-type galaxies, the connection between black hole accretion and galaxy growth, and the late-time assembly of galaxy outskirts. We combine comprehensive ground-based NIR imaging with IFS data to measure stellar populations and kinematics out to effective radii. Using the Mitchell Spectrograph (formerly called VIRUS-P; Hill et al., 2008) at McDonald Observatory, we cover a field of view with 4″ fibers. Thus, we are sensitive to low surface-brightness emission in the outer parts of the galaxies (e.g., Murphy et al., 2011; Adams et al., 2012; Greene et al., 2012).
For a subset of galaxies, we are obtaining additional adaptive-optics assisted IFS data to map the stellar kinematics on pc scales, within the sphere of influence of nuclear black holes. The high-resolution data are required to detect the gravitational effect of the supermassive black holes on the stellar orbits. These data alone, however, are insufficient for removing the degeneracy among the dark matter halo, the stellar mass-to-light ratio, and the central black hole mass (Gebhardt & Thomas, 2009). We therefore combine the high-resolution and wide-field IFS data for simultaneous modelling of the three mass components (e.g., Schulze & Gebhardt, 2011; McConnell et al., 2011a, b, 2012; Rusli et al., 2013b; Thomas et al., 2014).
We are also acquiring deep -band data at UKIRT and CFHT to measure the extended stellar halos of these luminous galaxies and determine more accurately their -band magnitudes.
The wide-field IFU portion of the survey is currently complete at and 75% complete at . Seven galaxies in the survey have published values of black hole mass (Sec 3.6); 15 additional galaxies have existing or incoming high-resolution kinematic data. Deep -band photometry has been obtained for 45 galaxies thus far.
The selection of the galaxy sample for the MASSIVE survey is described in Section 2. Since this survey is volume-limited and defined by the stellar masses of the galaxies via their -band luminosities, we discuss in detail the determinations of distance and absolute band magnitude. Basic properties of the survey galaxies such as stellar mass, size, velocity dispersion, shape, color, and central black holes are presented in Section 3. We illustrate the distinct demographics of these galaxies and compare their locations in parameter space with lower-mass early type galaxies. In Section 4, we investigate the larger-scale environments of these massive galaxies using three 2MASS-selected galaxy group catalogs within the local volume. Our observing strategies with large-format IFS, AO-assisted IFS, and deep -band imaging are discussed in Section 5. Sample spectra from the Mitchell IFS and kinematic maps of NGC 1600 are shown. We discuss the primary science goals of the survey and present early science results in Section 6.
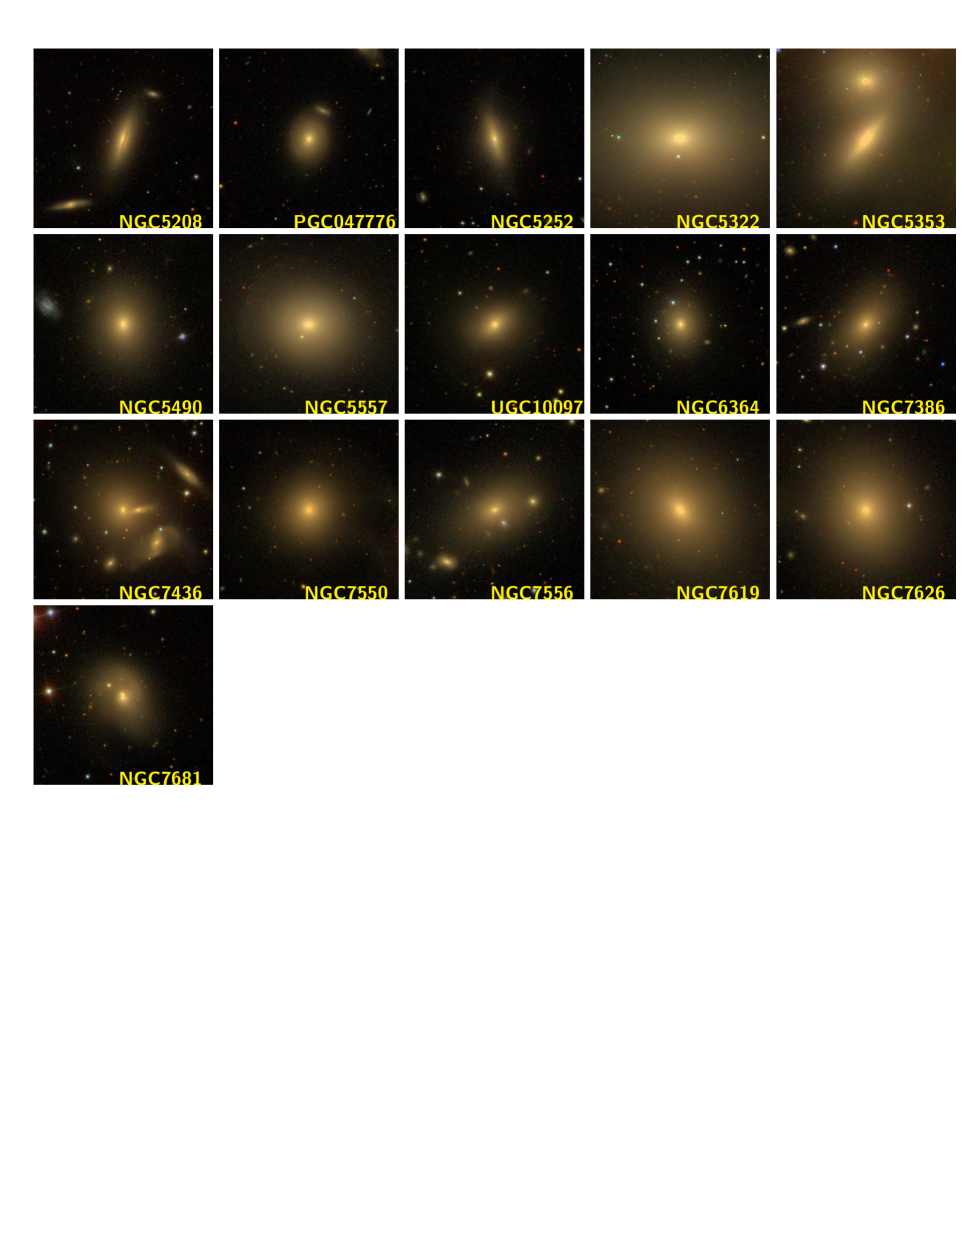
Appendix A tabulates the 116 candidate galaxies in the MASSIVE survey and their key physical properties. Appendix B provides a montage of the 78 MASSIVE galaxies with SDSS photometry.
We assume Mpc-1 throughout the paper.
2. Sample Selection
2.1. Overview
The main selection criteria of our survey are summarized in Table 1. The survey volume of radius Mpc is chosen to be large enough to encompass the Coma cluster. This volume is more than an order of magnitude larger than that probed by ATLAS, enabling us to obtain a statistical sample of early-type galaxies at the highest end of the galaxy mass function. The corresponding redshift limit is or (for Mpc-1).
Within the survey volume, our goal is to select galaxies above a given total stellar mass. Since selection based on -band luminosities is close to a stellar mass selection, particularly for these red galaxies, we use the near-infrared -band magnitude from the Extended Source Catalog (XSC; Jarrett et al. 2000) of the Two Micron All Sky Survey (2MASS; Skrutskie et al. 2006). This catalog contains photometric measurements in the , , and bands of objects with mag. The data have a mean photometric accuracy better than 0.1 mag and are mostly unaffected by interstellar extinction and stellar confusion, although the 2MASS luminosities may be systematically underestimated for very extended objects (see Sec 2.3).
Peculiar velocities add uncertainties to the determination of distances and absolute magnitudes, and consequently the selection of our sample. We use the 2MASS Galaxy Redshift Survey (2MRS; Huchra et al. 2012) and the group catalog based on 2MRS (Crook et al., 2007) to correct the radial velocity-derived distances. We begin with an initial velocity cutoff corresponding to a redshift-distance of 140 Mpc and and correct for peculiar velocities for galaxies in the 2MRS group catalog (see Sec 2.2). We then select those galaxies with Mpc, mag, declination , and galactic extinction .
Finally, we restrict our sample to galaxies classified as elliptical or S0 in the HyperLeda database111http://leda.univ-lyon1.fr (Paturel et al., 2003). We remove 14 galaxies from the sample because their photometry is compromised by either a foreground star or a companion galaxy, and the stellar mass is likely to be overestimated (see Sec 2.5). We do not remove any galaxies based on their size on the sky; in practice, most galaxies in the survey have effective radii larger than 10″ (listed in Table 3; see discussion in Sec 3.2) and are therefore well-resolved by the 4″ fibers of the Mitchell Spectrograph.
| Distance | Mpc |
|---|---|
| Absolute magnitude | |
| Declination | |
| Galactic extinction | |
| Morphology | E and S0 |
This set of selection criteria results in 116 candidate galaxies listed in Table 3. Among these, 72 galaxies have and Mpc and are our high priority targets. We are obtaining deeper -band imaging to improve on the relatively shallow photometry provided by 2MASS. The more robust measurements of the total -band magnitude for our candidate galaxies will help alleviate the uncertainties near the magnitude and distance cutoffs and sharpen the survey boundaries and the final sample size.
Below we describe the key selection criteria in more detail.
2.2. Distance
We need accurate distance estimates to determine the absolute -band magnitudes, the volume cutoff, and the measurements of and . Only 9 galaxies in our survey have existing distances measured from the surface-brightness fluctuation (SBF) method (e.g., Blakeslee et al., 2009, 2010) for either the individual galaxies or the groups in which they reside. Among these, three are in the Virgo cluster (NGC 4472, 4486, 4649) at 16.7 Mpc (Blakeslee et al., 2009), four are in the Coma cluster (NGC 4816, 4839, 4874, 4889) at 102.0 Mpc (Blakeslee, 2013), and two are in the Perseus group (NGC 7619 and 7626) at 54.0 Mpc (Cantiello et al., 2007). We adopt SBF distances for these 9 galaxies.
For the rest of the sample, we assign the distance in one of two ways, depending on whether or not a galaxy is identified as belonging to a group. For galaxies in groups, we correct for local peculiar velocities using group-corrected redshift distances; for galaxies not in groups, we use redshift distances based on radial velocities corrected with a flow model, as described below.
To determine group membership, we use the catalog of galaxy groups constructed from the friends-of-friends (FOF) algorithm applied to 2MRS (Crook et al., 2007). The 2MRS contains follow-up spectroscopic data and redshifts for a subset of 43,533 galaxies in 2MASS. It is 97.6% complete down to mag over 91% of the sky. The median uncertainty in the radial velocities for galaxies with absorption-line spectra is 29 and , respectively, for the two main spectrographs used in the survey. Crook et al. (2007) present a catalog of galaxy groups using the 2MRS redshifts. It is complete to a limiting radial velocity of . The high-density-contrast (HDC) catalog in this work provides galaxy membership in groups that have a density contrast of 80 or more, corresponding to FOF linking parameters of 0.93 Mpc (for ) in the transverse directions and along the line of sight.
For galaxies that reside in HDC groups with three or more members, we use the mean group distance from the HDC catalog, converted from Mpc-1 to our adopted value of Mpc-1. The group distance is determined using velocities from the flow model of Mould et al. (2000) to account for the most obvious local distortions and large-scale flows. The model first converts from the heliocentric frame to the Local Group frame, and then adjusts the redshift-inferred distances of galaxies near the Virgo Cluster, Shapley Supercluster, and the Great Attractor region.222However, we use the SBF distance for the Virgo galaxies, and none of our galaxies are in Shapley or the Great Attractor regions, as these are in the southern sky. Then, the Local Group frame velocities for all galaxies are corrected for the estimated gravitational pull of the Virgo, the Great Attractor, and Shapley mass concentrations.
For galaxies not residing in any HDC group, we assign the distances using velocities from the same flow model (as provided by NED and converted to our ) to ensure that the distances for group and field galaxies in our survey are computed in the same rest frame.
While we have used the best available distance measurements (listed in Table 3), uncertainties will unavoidably cause a small fraction of the galaxies near our mass and distance cutoffs to move into and out of the sample. We have attempted to quantify the outstanding distance uncertainties by comparing our adopted distances with the redshift-independent distances tabulated by NED for 39 objects in our sample. We find the mean offset to be 1.5 Mpc, but % of the cases differ by Mpc. Since galaxy populations over a few tens of Mpc or a few tenths of a magnitude are not expected to change, we do not anticipate the uncertainty in the exact membership near our survey boundaries to impact our results. Our dynamical measurements of and , however, do depend on the distance linearly, and all current such measurements are affected by this uncertainty. Significant improvements can be achieved with more SBF data with the Hubble Space Telescope.
2.3. band magnitude
The 2MASS XSC database provides a variety of magnitude measurements for each extended source in the , , and bands. To determine each galaxy’s absolute -band luminosity, we begin with the “total” extrapolated band magnitude (XSC parameter k_m_ext), which is measured in an aperture consisting of the isophotal aperture plus the extrapolation of the surface brightness profile based on a single Sérsic fit to the inner profile (Jarrett et al., 2003). We compute the absolute -band magnitudes using
| (1) |
where is given by k_m_ext, and is the distance in Mpc described in Sec 2.2. We use galactic extinction (Landolt ) from Schlafly & Finkbeiner (2011) and the reddening relation of Fitzpatrick (1999) with . The values of , , and for all galaxies are listed in Table 3. These band magnitudes form the basis for our selection and are used to estimate stellar masses (§ 3.1).
The relatively shallow photometry provided by 2MASS XSC (the 1- sky noise in is 20.0 mag arcsec-2) has led to some concerns that the -band luminosities of massive galaxies are underestimated by 2MASS (e.g., Lauer et al. 2007b; Schombert & Smith 2012; Kormendy & Ho 2013). When the radial range is too small to provide an accurate Sersic index for the light profiles of early-type galaxies, their total luminosities can be particularly biased low.
To assess the impact of potential biases in 2MASS -band magnitudes on our galaxy selection, we examine the sample of 219 early-type galaxies targeted for an HST imaging study in Lauer et al. (2007b). We use (Kormendy & Ho, 2013) to transform the -band luminosities (largely based on the RC3 Catalog) in their sample to the -band. A total of 31 galaxies in this sample lie within our survey volume of Mpc and above the luminosity cut of mag; among these, 18 have and would belong to our survey if the deeper -band photometry and relation were used to select bright galaxies.333We exclude IC 1565, which is at a distance of Mpc according to NED; it is incorrectly listed as 38.2 Mpc in Lauer et al. (2007b). We find all 18 to be in our MASSIVE sample; our -band selection therefore does not appear to be much affected by potential systematic underestimates in the 2MASS -band magnitude according to this test.
We are acquiring deep wide-field -band photometry (Sec 5.3) for more robust measurements of the total magnitude for the galaxies in our sample. M87, for instance, has mag according to the 2MASS XSC and is only slightly above our magnitude cut. Analysis of deeper photometric data, however, finds mag, a factor of two more luminous (Läsker et al., 2014). Although M87 is likely to be a worst case because of its angular extent on the sky, this large discrepancy underscores the need for deeper -band imaging data. Our dataset will also reduce the uncertainties near our magnitude and distance cutoffs and help refine the final sample selection for IFS observations.
2.4. Parameter Space
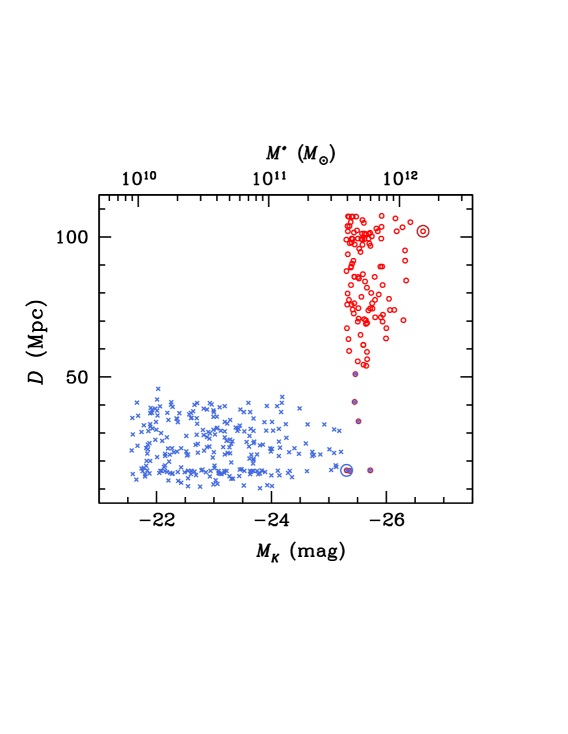
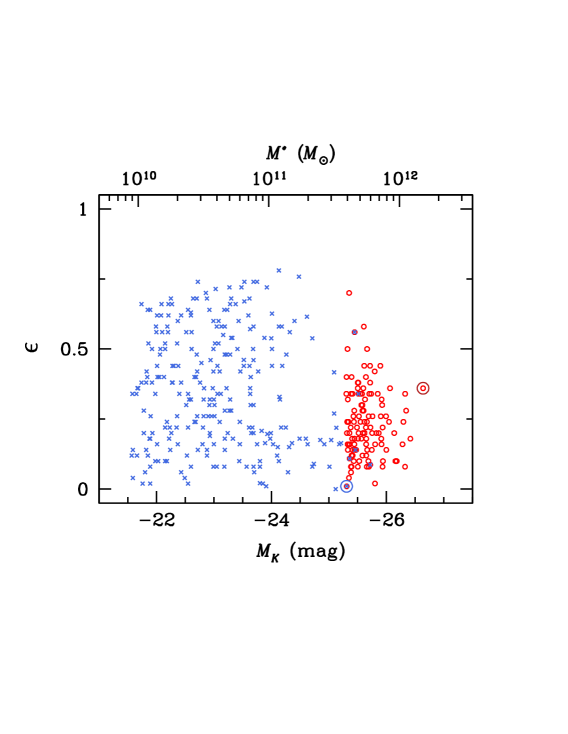
Figure 1 highlights the distinct parameter space in distance and stellar mass occupied by MASSIVE galaxies. Only 6 galaxies in this survey were included in ATLAS; three are in the Virgo Cluster: NGC 4486 (M87), NGC 4472 (M49), NGC 4649 (M60); the others are NGC 5322, NGC 5353, and NGC 5557. The larger survey volume (by more than a factor of 15) allows us to sample the galaxy mass function at .
The ongoing CALIFA survey will target diameter-selected local galaxies with major axes between 45″ and 80″ (in the SDSS -band) and a redshift range of . About 1/3 of the galaxies are expected to be bulge-dominated (Sánchez et al., 2012). Despite the selection on galaxy sizes, the CALIFA sample is shown to be representative of galaxies with (Walcher et al., 2014), complementary to our mass selection of .
2.5. Skipped Targets
A total of 14 galaxies pass our selection criteria but are in the field of view of a bright star or have a companion or interacting galaxy. We list these galaxies here for completeness, but we do not include them in our candidate list because their photometry is likely to be contaminated by the near neighbor and the luminosities may be overestimated. Among the 14 galaxies, 4 have nearby stars: NGC 2974,444We note that NGC 2974 was included in ATLASbut was assigned mag, much fainter than our survey magnitude cut and the 2MASS XSC value mag and a corresponding mag. The 2MASS isophotal radius is 71” for this galaxy, enclosing the mag bright star BD-03 2751 that is 43” away. The 2MASS magnitude for NGC 2974 is therefore highly contaminated. NGC 6619, IC 947, UGC 11950; the other 10 have interacting or close companion galaxies: NGC 71, NGC 750, NGC 1128, NGC 4841A, NGC 5222, NGC 7318, PGC 27509, PGC 93135, UGC 2759, UGC 12591.
One exception is the close galaxy pair NGC 545/547. NGC 547 is in 2MASS and passes our selection cut. NGC 545 is not in 2MASS, but it is listed as the BCG of Abell 194 with mag (Lauer et al., 2007b). We include both galaxies in our sample.
We exclude NGC 1275, the central galaxy in the Perseus Cluster, since it is a complex post-merger system (e.g., Canning et al., 2014, and references therein).
3. Galaxy Properties
3.1. Stellar Mass
A major goal of this survey is to obtain measurements of the stellar mass-to-light ratio of massive early-type galaxies from both dynamical modeling and stellar population synthesis modeling of the IFS kinematic data. In the interim, we estimate the stellar mass of the survey galaxies using a conversion between -band luminosity and stellar mass for early-type galaxies in the ATLASsample (Cappellari, 2013):
| (2) |
The relation is fitted between total extinction-corrected 2MASS -band magnitudes and dynamical stellar masses from Jeans Anisotropic MGE (JAM), where MGE is the Multi-Gaussian Expansion method (Emsellem et al., 1994). This scaling naturally incorporates any potential IMF changes as a function of mass. Upon the completion of the MASSIVE survey, we will be able to test the validity of this conversion for the mass range , which is currently uncalibrated at this high mass.
3.2. Galaxy Size
The 2MASS XSC catalog lists a variety of measurements for galaxy sizes. For ease of comparison, we adopt a similar definition of the effective radius as Cappellari et al. (2011). Their is based on the half-light radius from XSC (parameters j_r_eff, h_r_eff, and k_r_eff). This radius is derived from the 2MASS surface brightness profile in each band as the value of the semi-major axis of the ellipse that encloses half of the total light. We assign each galaxy a 2MASS using the median value in the three bands:
| (3) |
where the parameter sup_ba is the minor-to-major axis ratio measured from the 2MASS 3-band co-added image at the isophote.555We use sup_ba instead of the -band axis ratio k_ba adopted by Cappellari et al. (2011) because sup_ba is measured from the higher S/N combined images and is listed to 3 rather than 1 decimal precision in 2MASS XSC. This factor is included here to convert the semi-major axis into the radius of the circle with the same area. Cappellari et al. (2011) found the 2MASS for ATLASgalaxies to correlate well with the optical from the RC3 catalog (de Vaucouleurs et al., 1991) with an rms scatter of 0.12 dex, but the 2MASS radii were smaller by an overall factor of , presumably because 2MASS is shallow (see also Lauer et al., 2007b).
Here we compare the 2MASS with the optical sizes from the NASA-Sloan Atlas (NSA), which in turn is based on the SDSS DR8 spectroscopic catalog (York et al., 2000; Aihara et al., 2011). This version of the SDSS photometric catalog has a revised sky subtraction designed specifically to mitigate known galaxy size measurement problems for large galaxies (Desroches et al., 2007; Blanton et al., 2011). The NSA provides a unified analysis of local galaxies within Mpc. A total of 77 MASSIVE galaxies are in the NSA. For the optical , we use the 50% light radius from a 2-dimensional Sérsic fit along the major axis (NSA parameter SERSIC_TH50). The Sérsic indices from the NSA fits range from to the maximum allowed .
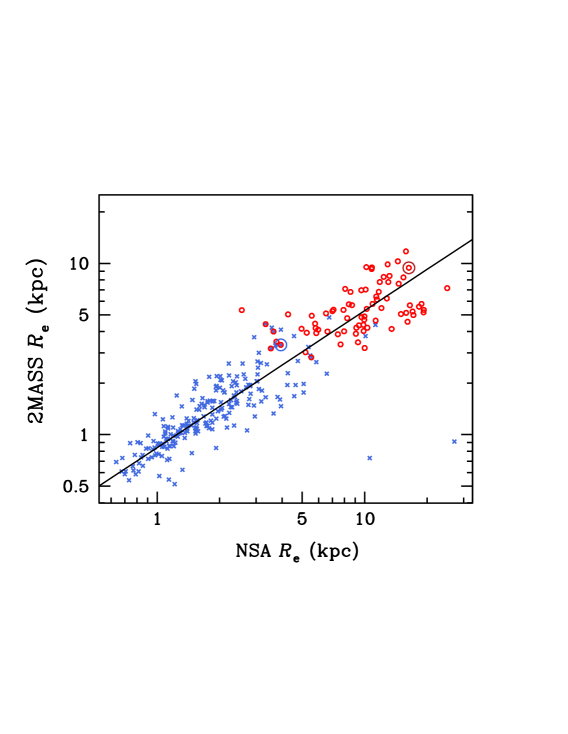
The values of 2MASS and available NSA radii are listed in Table 3. Figure 2 compares the physical from 2MASS and NSA for galaxies in the MASSIVE and ATLASsurveys. The best-fit relation (black line) is
| (4) |
where the radii are in kpc. At kpc, the NSA is a factor of larger than the 2MASS . At kpc, the offset increases to a factor of . This difference underscores the need for deeper photometry, particularly in the -band and for massive galaxies.
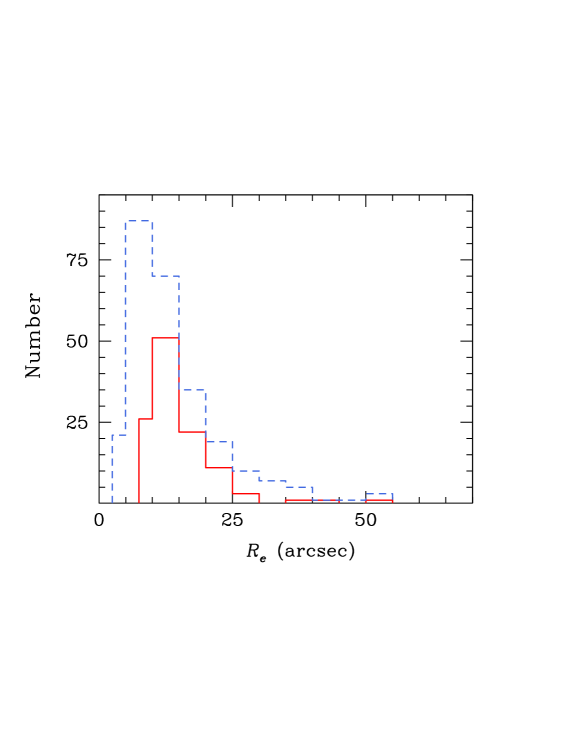
Figure 3 shows the distributions of the 2MASS angular for galaxies in the two surveys. Most MASSIVE galaxies are in the range of to 50″ , comparable to those of ATLASgalaxies. Due to the larger distances, however, the physical sizes of MASSIVE galaxies are to 5 times larger. This is consistent with the large stellar masses of these galaxies. The FOV of our IFS covers up to of most galaxies in the MASSIVE survey, in comparison to the FOV of ATLAS.
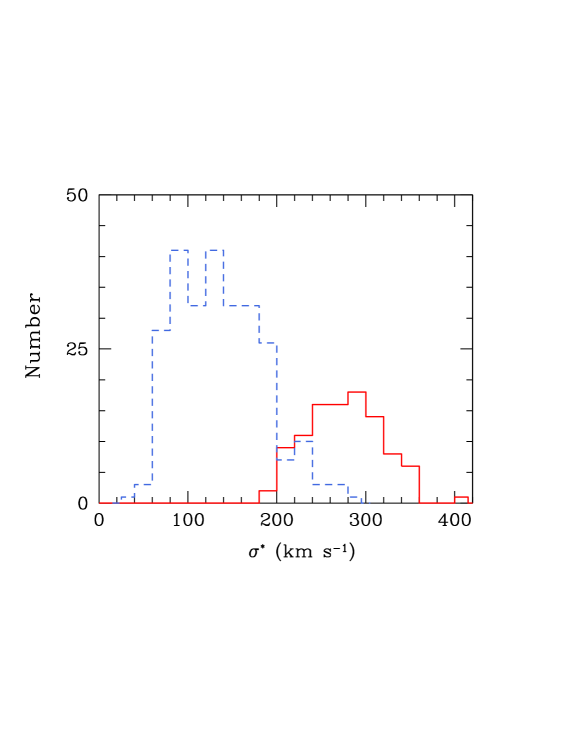
3.3. Stellar Velocity Dispersions
A total of 98 MASSIVE galaxies have stellar velocity dispersion measurements in the HyperLeda database (Paturel et al., 2003). Among those not in HyperLeda, five have measurements in the SDSS (Bolton et al., 2012). These 103 values are plotted in Figure 4 and listed in Table 3; all other available values of SDSS are also listed. The literature values are measured over a range of radial apertures, so HyperLeda has homogenized the measurements in a way designed to correct (on average) for aperture effects as well as other differences in technique among different studies (Prugniel & Simien 1996; see also Ho 2007). The HyperLeda measurements are compiled as follows: (i) choose a subsample of galaxies with three or more measurements in the literature; (ii) pick those that agree within ; and (iii) for each source, derive offsets to match a gold sample of . The final reported dispersion is a weighted mean of scaled values. The corrected velocity dispersions from HyperLeda correspond to an aperture of 0.6 kpc.
The range of (Figure 4) for our survey galaxies is large, starting at up to for NGC 4889. Two galaxies have anomalous in HyperLeda: NGC 4059 with and NGC 4055 with . We replace them with and , respectively, from the NSA. Ultimately, our survey will produce spatially-resolved 2-dimensional maps of velocities and will update the measurements.
3.4. Shape
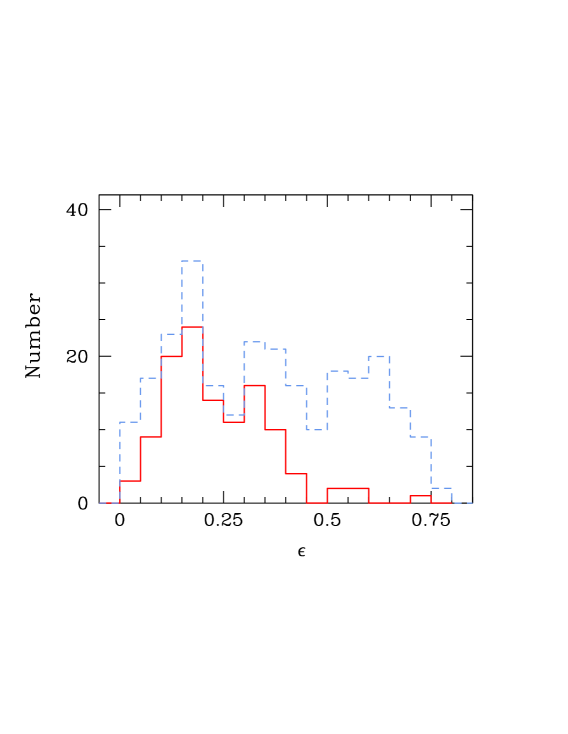
The shapes, kinematics, and masses of early-type galaxies are closely correlated. Lower-mass elliptical galaxies tend to be fast rotators and have higher ellipticities, whereas giant ellipticals rotate slowly and are round and mildly triaxial (e.g., Binney 1978; Davies et al. 1983; Kormendy & Bender 1996; Tremblay & Merritt 1996). It is therefore interesting to examine the distributions in galaxy shapes for the MASSIVE and ATLAS samples.
Figure 5 compares the ellipticities, , for galaxies in the two surveys, where sup_ba is the 2MASS XSC parameter for the minor-to-major axis ratio fit to their “super-coadd” isophote. Only five MASSIVE galaxies have high ellipticities with , in contrast to about a quarter of the ATLAS sample. These five galaxies are all in the fainter half ( mag) of our sample. Our survey data will provide direct measurements of the spatial profile of the rotation and of each galaxy and will allow us to quantify the distributions of galaxy rotations and shapes at the highest masses.
3.5. Color
Galaxies in the MASSIVE survey are selected based on properties such as luminosity and morphology but not color. We quantify their color distribution using the photometry for the 77 MASSIVE galaxies that are in the NSA. We find that the distribution is well-described as a Gaussian with a mean color of mag. This level of scatter is similar to those quoted in earlier work (e.g., Bower et al. 1992; Bernardi et al. 2003b; Blanton et al. 2005; Eisenhardt et al. 2007). The small scatter in the color-magnitude relation is most likely tied to a uniformly old age and a narrow range in stellar metallicity for these galaxies. The wide range of environments of our galaxies (see Sec 4) will enable us to identify any potential color differences among the most massive galaxies as a function of local environments.
3.6. Supermassive Black Holes
Seven galaxies in our sample have published black hole masses in the literature: the three Virgo galaxies NGC 4486 (Gebhardt et al., 2011; Walsh et al., 2013), NGC 4472 (Rusli et al., 2013b), and NGC 4649 (Shen & Gebhardt, 2010); NGC 3842 and NGC 4889 (McConnell et al., 2011a, 2012); NGC 7052 (van der Marel & van den Bosch, 1998), and NGC 7619 (Rusli et al., 2013b). These galaxies are located at the high end of the - relation (McConnell & Ma, 2013), but due to the large scatter in vs (Figure 13), the high end of the - relation is populated by a mixture of these massive galaxies and several others not massive enough to be in our survey. Recent efforts at measuring large have all targeted high- galaxies (e.g., McConnell et al. 2011a, 2012; van den Bosch et al. 2012; Rusli et al. 2013b). Our survey will provide a complementary sample of in galaxies selected based on high stellar mass.
4. Galaxy Environments
In this section we investigate the larger-scale environments of galaxies in the MASSIVE survey. Massive early-type galaxies are commonly assumed to be located at or near the centers of galaxy groups or clusters. Our survey targets the most massive galaxies within a Mpc volume. Where do these galaxies reside? Below we quantify their environments using three group catalogs constructed from galaxy redshift surveys of the local volume.
4.1. 2MRS Group Catalog
Crook et al. (2007, 2008) presents a redshift-limited catalog of groups for the galaxies with mag in 2MASS XSC. The FOF algorithm with two sets of linking parameters is used to create two group catalogs of differing density contrasts. The high-density-contrast (HDC) catalog lists galaxy membership in groups that have a density contrast of 80 or more, corresponding to linking parameters of along the line of sight and 0.89 Mpc in the transverse directions. The low-density-contrast (LDC) catalog is constructed with larger linking lengths of and 1.63 Mpc, corresponding to a density contrast of 12 or more.
The exact membership of groups in any group/cluster catalog depends on the algorithm and linking parameters used to construct the catalog. All galaxies assigned to groups in the HDC catalog are also assigned to groups in the LDC catalog, but the converse is not true. The larger linking lengths used in LDC tend to merge smaller groups and generate more extended structures, whereas large structures tend to be fragmented into individual groups in HDC. Three galaxies in Virgo are bright enough to be in our survey; they are assigned to a single group of 205 members in HDC, and a single group of 300 members in LDC. Similarly, the four brightest galaxies in the Coma cluster are in our survey. They are all properly assigned to a single group in both the HDC and LDC catalogs, containing 49 and 84 members, respectively.
Two measurements of the mass of each group are provided in Crook et al. (2007), one based on the virial estimator and the other based on the projected mass estimator. The virial mass estimator is computed from the line-of-sight velocity dispersion and mean harmonic projected separation of group members. The latter quantity is sensitive to close pairs and can be noisy, in particular for groups not uniformly sampled spatially. The projected mass estimator (Heisler et al., 1985) is designed to give equal weights to group members at all distances. This mass estimator depends on the mean eccentricity of the orbits and is parameterized by an overall coefficient that typically is not measured and must therefore be assumed. The parameter ranges from for isotropic orbits to for radial orbits, independent of the mass distribution. The Crook et al. (2007) catalog assumes , which yields the smallest mass.
| Environment | HDC | LDC | 2M |
|---|---|---|---|
| Groupless | 26 | 12 | 23 |
| In groups | 90 | 104 | 93 |
| Brightest group galaxy | 65 | 70 | 70 |
Notes. Number of MASSIVE galaxies that are (1) group-less, i.e., “isolated” and have no group members; (2) in groups of three or more members; and (3) the brightest galaxy in its group. Three galaxy group catalogs (all based on 2MASS) are shown: the high-density-contrast (HDC) and low-density-contrast (HDC) catalogs of Crook et al. (2007) and the 2M catalog (Lavaux & Hudson, 2011).
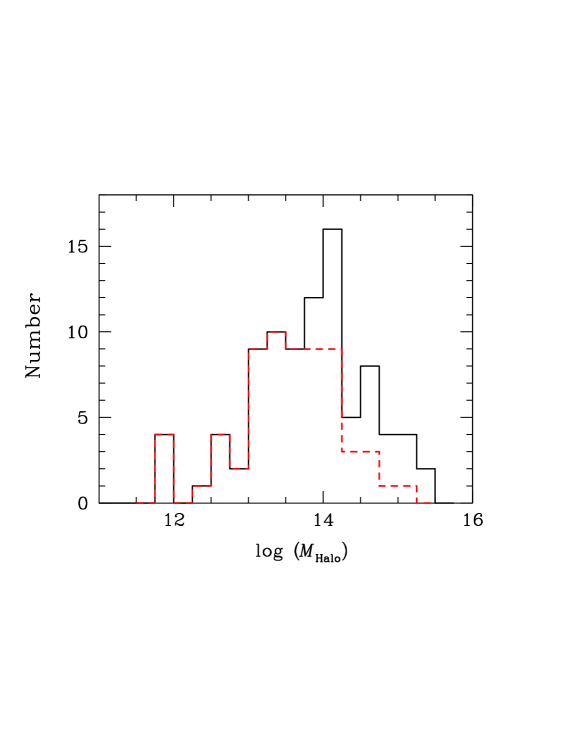
Table 2 lists the statistics of the environment of our candidate galaxies classified by the HDC and LDC group catalogs. As expected, more galaxies are identified as being in groups in the LDC catalog. Figure 6 plots the distribution of the virial halo mass of the HDC groups in which the MASSIVE galaxies reside. The black histogram shows the halo distribution of all 90 galaxies in groups, and the red histogram plots the subset of 65 brightest group galaxies (BGGs). The agreement of the two histograms at indicates that the 39 MASSIVE galaxies in these lower-mass groups are all BGGs. By contrast, only 26 of the 51 galaxies in the higher-mass groups are BGGs.
4.2. 2M Group Catalog
As a comparison study, we examine the environmental properties of the MASSIVE galaxies in the 2M galaxy redshift catalog of Lavaux & Hudson (2011). This more recent compilation of 69,160 galaxy redshifts is based on the 2MASS photometric catalog for target selection and uses primarily the redshifts from SDSS-DR7, 6dfGRS, and 2MRS. The catalog covers nearly the full sky and reaches depths of , in comparison to mag for 44,599 galaxies in 2MRS. Groups in this catalog are identified by the FOF algorithm with linking parameters of 0.64 Mpc and . The corresponding overdensity threshold of 80 is the same as the HDC catalog of Crook. The group list contains 4002 groups with three or more members up to redshift distance of . The members of the nearest two clusters Virgo and Fornax are not properly identified by the FOF algorithm and are assigned manually.
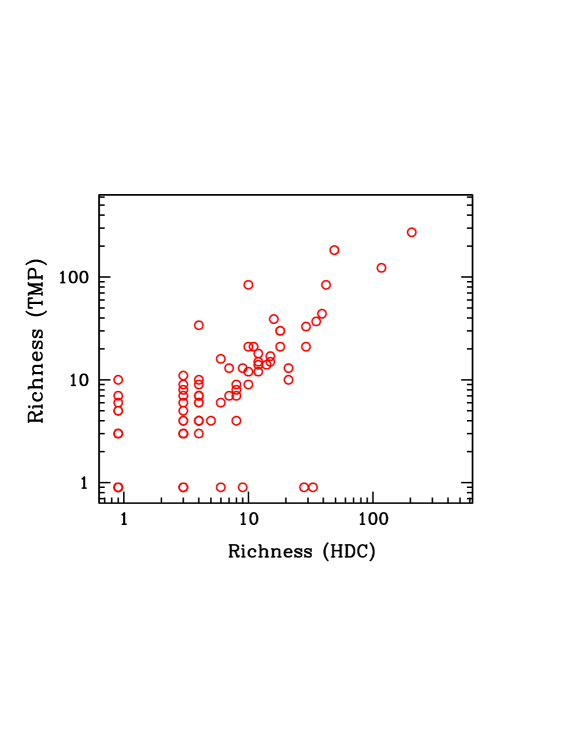
A total of 93 MASSIVE galaxies are identified to reside in groups by the 2M catalog, similar to 90 in HDC (see Table 2). Figure 7 shows that the numbers of group members are reasonably consistent between the two catalogs. For the handful galaxies that are assigned to a group in one catalog but not in the other, most of them reside in small groups of low velocity dispersion and low membership, a regime that is more sensitive to the different linking parameters and parent samples used in the two catalogs.
4.3. Groupless Galaxies
Not all MASSIVE galaxies are associated with groups (of three or more members) in the Crook or 2M catalogs: 26 galaxies are not in groups according HDC, and 23 galaxies are not in 2M groups. Among these, 17 galaxies are groupless in both catalogs. These galaxies are relatively isolated and presumably live in low-density environments. Any satellite galaxy, if present, is likely to be faint.
A handful of these 17 groupless galaxies had been targeted for X-ray observations. Three have archival Chandra and/or XMM-Newton observations: NGC 57, NGC 4555, and NGC 7052. The X-ray luminosity of the thermal component in the keV band for the three galaxies are: erg s-1 (NGC 57), erg s-1 (NGC 4555), and erg s-1 (NGC 7052) (Mulchaey & Jeltema, 2010). The X-ray halos of NGC 57 and NGC 4555 both have keV and extend to 50 to 60 kpc (O’Sullivan & Ponman, 2004; O’Sullivan et al., 2007). NGC 7052 has an X-ray halo of keV (Memola et al., 2009) and a central AGN with erg s-1 (Donato et al., 2004).
These groupless galaxies and other galaxies in low-richness groups in our survey form an interesting subsample of targets for further studies. For instance, we are investigating whether the groupless galaxies have faint optical companions and satisfy the criterion of being fossil groups (Ponman et al., 1994; Jones et al., 2003). Overall, our survey galaxies span only a factor of in stellar mass (Figure 1) but a much wider range in halo mass (Figure 6) and group membership (Figure 7), providing an excellent sample for studying environmental effects on galaxy formation (Mulchaey & Jeltema, 2010).
5. Observations
5.1. Large-format IFS
Our large-scale IFS observations are performed with the Mitchell Spectrograph (Hill et al., 2008) on the 2.7 m Harlan J. Smith Telescope at McDonald Observatory. The Mitchell Spectrograph is an optical integral-field spectrograph with a large field of view (107″ 107″) and 4.1″ diameter fibers. The 246 fibers are evenly-spaced and assembled in an array similar to Densepak on the WIYN telescope (Barden et al., 1998) with a one-third filling factor.
We use the low-resolution blue setting () of the Mitchell Spectrograph. The wavelength coverage spans 3650 to 5850Å, including the Ca H+K region, the G-band region, H, the Mgb region, and several Fe absorption features. The spectral resolution varies spatially and with wavelength but has an average of 5Å FWHM, corresponding to a dispersion of Å pixel-1 and in the red part of the spectrum to in the blue part.
We observe each galaxy with three dither positions of equal exposure time to obtain a contiguous coverage of the field of view. For each dither position, we interleave a ten-minute exposure on sky with two twenty-minute on-target science frames. Each galaxy is therefore observed for a total of hours on source. With this observing strategy, we typically reach S/N above 50 in the central fiber alone. For the outer fibers, we co-add the fibers and create spatial bins with a minimum of S/N per bin. Our binning procedure provides a good combination of spatial resolution and S/N, resulting in to 60 spatial bins per galaxy and a median S/N from 25 to more than 30 for each of the ten galaxies we have analyzed thus far. Even in the outermost radial bin covered by the IFU, our data have sufficient S/N to provide multiple angular bins (see example in Figs. 9 and 10). Comparable S/N requirements are used for dynamical orbit modeling of luminous and dark matter in Coma galaxies (Thomas et al., 2007) and for measurements using combined wide-field and AO IFU data (e.g. Rusli et al. 2013b; McConnell et al. 2012). With these data, we expect to constrain stellar population gradients larger than roughly a tenth of a dex per decade in radius (e.g., Greene et al. 2013). In a handful of galaxies, we have integrated substantially longer (i.e., 6-8 hours) on an off-nucleus pointing (e.g., Murphy et al. 2011). With these cases we are able to roughly double our radial coverage at comparable S/N.
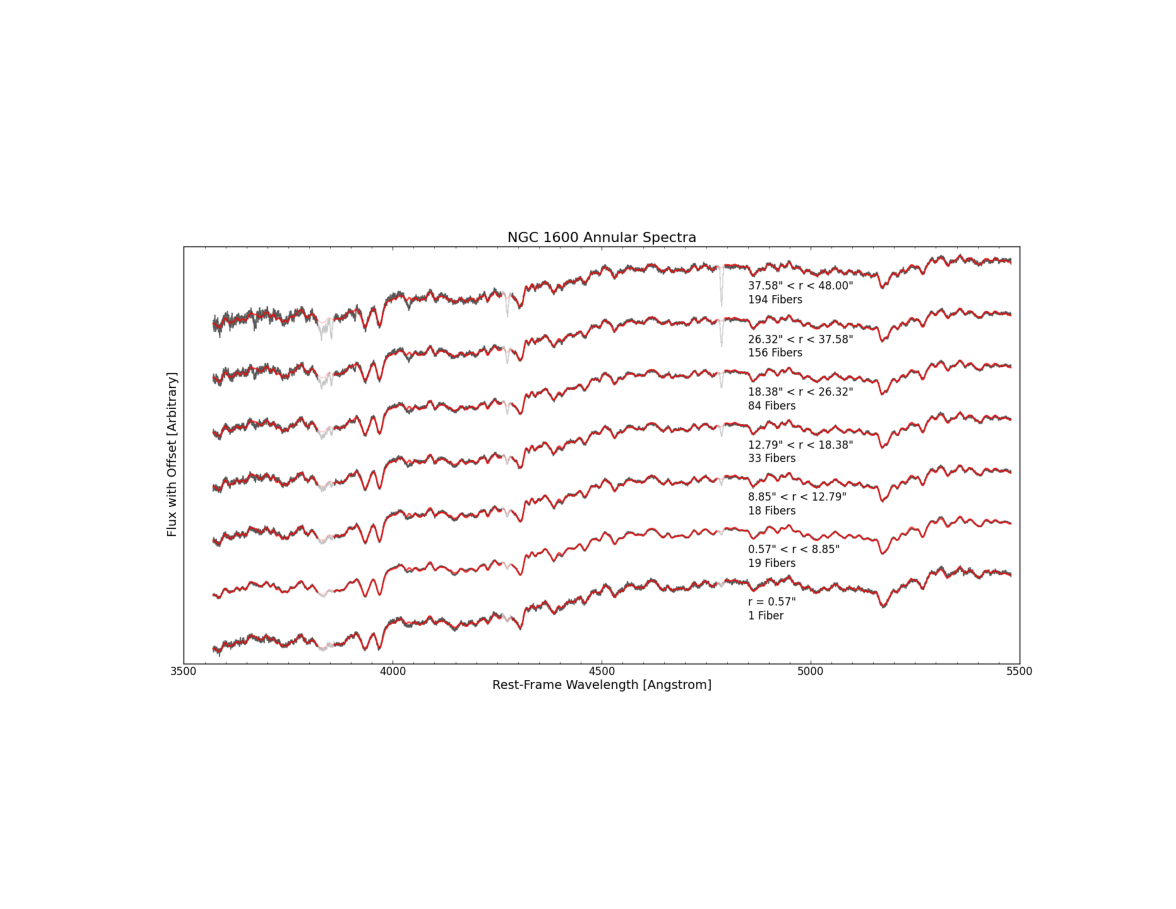
The data reduction is performed using the Vaccine package (Adams et al., 2011; Murphy et al., 2011). Flux calibration and final reduction are done with the software developed for the VENGA project (Blanc et al., 2009, 2013). The flux calibration is quite robust, with disagreement in continuum shape between the central Mitchell fiber and SDSS spectra when available (Greene et al., 2012, 2013). Figure 8 shows the spectra for a range of radial bins for NGC 1600 from our Mitchell IFS data taken in October 2013. The resulting stellar kinematics and stellar populations for NGC 1600 are presented in Sec. 6 below.
In 2010 we conducted a precursor study to MASSIVE with the Mitchell spectrograph (Greene et al., 2012). Galaxies were selected to have red colors () and velocity dispersions (as measured by the SDSS) within the redshift range . The galaxies span a mass range of , less massive than MASSIVE galaxies but still generally more massive than the ATLAS galaxies. Fifty galaxies have been observed to date, and we analyzed their stellar population properties in Greene et al. (2013) and their kinematic properties in Raskutti et al. (2014). Because they were observed in an identical manner to the MASSIVE galaxies, we will use them as a complementary sample for comparison studies.
5.2. AO-assisted IFS
For a subset of MASSIVE galaxies suitable for AO-assisted observations, we are acquiring high-resolution data to perform new measurements of black hole masses using stellar dynamics. We use NIFS and the ALTAIR adaptive optics system with both natural guide star (NGS) and laser guide star (LGS) on the 8 m Gemini Observatory North telescope, and OSIRIS (Larkin et al., 2006) and LGS-AO system on the 10 m W. M. Keck I telescope.
The literature contains measurements for seven galaxies in our MASSIVE sample (see Sec 3.6). We are preparing measurements for six additional MASSIVE galaxies based on our existing AO data; seeing-limited IFS data at resolution may yield up to four more. Our ongoing campaign with AO instruments will extend the sample of in MASSIVE galaxies still further.
Because MASSIVE galaxies are selected for extreme stellar masses, and because they mostly lie within a factor of two in distance (54-108 Mpc), much of the variation in the angular sizes of influence of the central black holes results from the cosmic scatter in . In this case the primary limiting factor for AO selection is central surface brightness: fainter than mag arcsec-2, high-resolution observations are prohibitively expensive. Within the acceptable range of surface brightnesses, we typically require four to eight hours of AO observations per target, including science and sky frames, calibration stars, and overheads.
5.3. Deep band Imaging
Most of our science goals require a deep luminosity profile for each galaxy. Since 2MASS is shallow, we are obtaining deeper -band imaging for the MASSIVE sample using a combination of WFCAM on UKIRT and WIRCam on CFHT. We choose -band because it (i) traces the old populations that compose most of the stellar mass in early-type galaxies; (ii) minimizes dust extinction; (iii) allows for uniform calibration using 2MASS; and (iv) facilitates comparison of black hole masses across galaxy populations via the - relation.
In order to trace the extended halos of luminous early-type galaxies and measure accurate total magnitudes, it is desirable to reach a surface brightness limit mag arcsec-2 fainter than 2MASS (cf. Appendix B of Lauer et al. 2007b). The 2MASS surface brightness limit is mag arcsec-2 (Jarrett et al., 2000), which corresponds roughly to the often quoted value of mag arcsec-2. Thus, in terms of AB mag, we are aiming to achieve a surface brightness limit of mag arcsec-2 (3 mag in depth plus 2 mag AB conversion).
6. Examples of Survey Science and Early Results
The MASSIVE survey is designed to study the most massive galaxies in the universe today, a parameter space that has not been systematically explored with IFS to date. With the nearly 2′ field of view of the Mitchell spectrograph, we cover about twice the effective radius of most galaxies in the survey. The additional AO data for a subset of the galaxies will probe sub-arcsec scales down to the gravitational sphere of influence of the central supermassive black hole ( pc). In the following sections we discuss key science results that can be expected from the survey and present some early results. This list is by no means exhaustive.
6.1. Stellar Mass-to-Light Ratio and IMF
Our kinematic measurements at large radius, combined with Schwarzschild orbit modeling, allow us to measure the dark matter halo mass and the dynamically inferred stellar mass-to-light ratio . At the same time, stellar population synthesis modeling of our Mitchell spectra in the blue combined with our -band imaging and space-based photometry in the mid-infrared provide an independent measurement of the stellar mass, yielding .
The observed increase in the ratio of / in galaxies with increasing has been interpreted as a change in the IMF (e.g., Treu et al., 2010; Auger et al., 2010; Cappellari et al., 2012; Sonnenfeld et al., 2012; Tortora et al., 2013; Dutton et al., 2013; Barnabè et al., 2011, 2013), but it could also indicate a degeneracy with the dark matter distribution (e.g. Thomas et al., 2011; Wegner et al., 2012). A number of independent approaches, including direct measurements of gravity-sensitive stellar features and gravitational lensing, have pointed towards an IMF that becomes more top-heavy in galaxies with higher stellar velocity dispersions (e.g., Conroy & van Dokkum, 2012; Spiniello et al., 2014; Oguri et al., 2014). Some recent results, however, are not consistent with an increasingly top-heavy IMF in all systems (e.g., Smith & Lucey, 2013; Rusli et al., 2013b; Smith, 2014). The sample size and dynamic range in mass of the MASSIVE survey will improve the constraints on any possible mass dependence of the IMF.
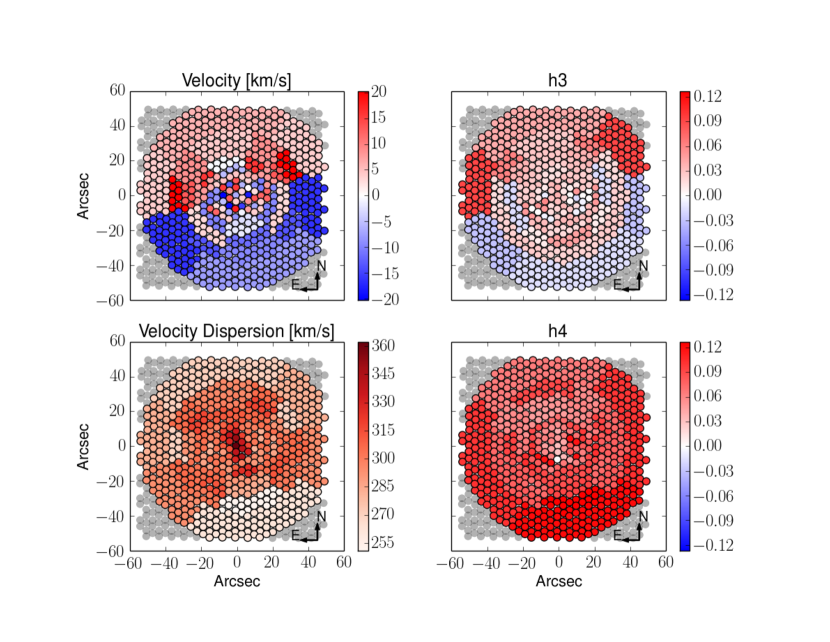
As a demonstration of early results from our survey, we show in Figure 9 the 2-dimensional stellar kinematic maps for NGC 1600. We use the penalized pixel-fitting (pPXF) method (Cappellari & Emsellem, 2004) to extract the stellar line-of-sight velocity distribution (LOSVD) function from the absorption line features in our spectra. As input templates, we use the MILES library of 985 stellar spectra, covering the wavelength range of 3525-7500Å at 2.5Å (FWHM) spectral resolution (Sánchez-Blázquez et al., 2006). The pPXF routine convolves the MILES stellar templates with modeled as a Gauss-Hermite series (up to order 6):
| (5) |
where is the th Hermite polynomial and given by
| (6) |
Figure 9 shows the 2-dimensional maps of the best-fit Gauss-Hermite velocity moments and from our Mitchell IFS observations of NGC 1600. The galaxy rotates slowly with about its photometric minor axis. The velocity dispersion peaks at in the central fiber and declines radially by % out to . The flux-weighted is for NGC 1600. Only two galaxies have such low in ATLAS(Emsellem et al., 2011). We will discuss in separate papers the details of this analysis, results for , and tests of systematics including spectral regions used in the fits and robustness of the higher-order Gauss-Hermite moments (J. Thomas et al. 2014, in prep.; R. Janish et al. 2014, in prep.).
6.2. Radial Gradients and Assembly History
Massive early-type galaxies have experienced dramatic size evolution, by factors of 2-4, from to the present (e.g., van Dokkum et al., 2008). One way to understand the physical mechanisms responsible for this growth is to study spatial gradients in the stellar populations and kinematics beyond the half-light radius of present-day ellipticals. Since the dynamical times in the outskirts of these galaxies are long, the stars can potentially remember their origin both in their overall distribution (Naab et al., 2007; Oser et al., 2010; Hilz et al., 2013) and their degree of angular momentum (e.g., Davies et al., 1983; Franx et al., 1991; Krajnović et al., 2011; Wu et al., 2014; Arnold et al., 2014; Naab et al., 2014; Krajnović et al., 2013; Raskutti et al., 2014).
Sensitive spectroscopic observations of stellar populations at large radius are still relatively scarce (e.g., Carollo & Danziger, 1994; Mehlert et al., 2003; Kelson et al., 2006; Weijmans et al., 2009; Spolaor et al., 2010; Pu et al., 2010; Pastorello et al., 2014; Martín-Navarro et al., 2014; Greene et al., 2012, 2013). The MASSIVE survey will contribute the largest set of IFS data to date for slowly rotating nearby early-type galaxies in a wide range of large-scale environments. In combination with our deep -band imaging, we will also investigate any correlations between rotation as a function of radius and isophotal shape (e.g., Bender et al., 1989; Arnold et al., 2014).
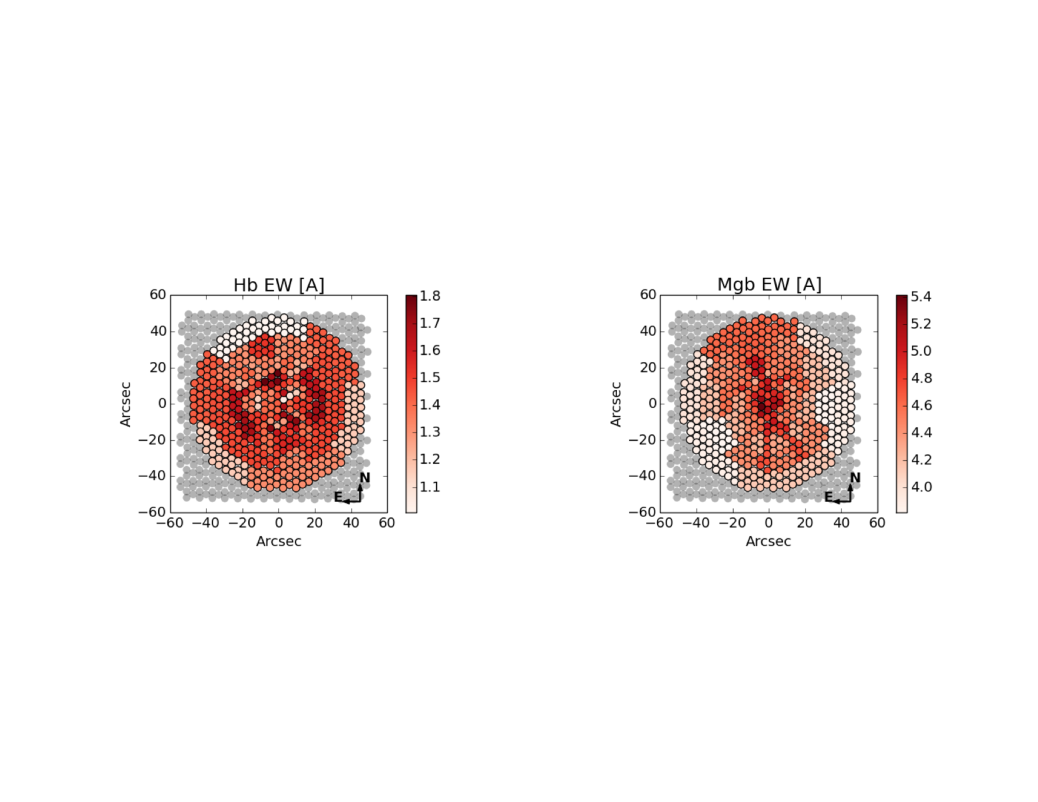
Figure 10 shows the 2-dimensional maps of the equivalent widths (EW) of the H (left) and Mgb (right) absorption features for NGC 1600. We measure the standard Lick indices (Faber et al., 1985; Worthey et al., 1994) using the IDL code lick_ew (Graves & Schiavon, 2008). In Greene et al. (2012) we demonstrated that because these indices are defined for flux-calibrated spectra, our measurements are on a standard system without any additional offsets. Very low levels of emission-line infill can often contaminate our EW measurements, particularly of H (e.g., Graves et al. 2007). We perform an iterative fit (Greene et al., 2013) to the H+[O III] region, using the stacked spectra from Graves et al. (2009) as templates. Our uncertainties are dominated by sky subtraction, so we scale our fiducial sky model by up to % and repeat our full procedure to determine the uncertainties. Given our typical S/N ratios of 30 - 100 at , we achieve S/N of 15-80 in the H and Mgb line indices at the outer edge of the Mitchell IFU.
Figure 10 shows a characteristic radial decline in Mgb EW, mostly due to the well-known decline in metallicity with radius in these early-type galaxies. In contrast, the H EW is relatively flat with radius, with perhaps a subtle trend of falling at the outer parts, reflecting the uniform old age of this galaxy.
6.3. Black Hole-Galaxy Correlations
New kinematic data and modeling efforts in the past several years have substantially expanded and revised dynamical measurements of . As samples of dynamical black hole masses increase at both the highest masses (e.g., McConnell et al., 2011a, b, 2012; Rusli et al., 2011, 2013b; van den Bosch et al., 2012; Walsh et al., 2013) and in spiral galaxies (e.g., Greene et al., 2010; Kuo et al., 2011; Beifiori et al., 2012; Sun et al., 2013), it becomes increasingly clear that more data are needed to better quantify the intrinsic scatter and mass dependence in the scaling relations between and properties of their host galaxies (McConnell & Ma, 2013; Kormendy & Ho, 2013).
A systematic survey of dynamical black hole masses in the most massive galaxies (without preselection based on current scaling relations) will substantially improve our leverage on the intrinsic scatter in the relations as a function of mass, which may discriminate between different models for galaxy-black hole coevolution (e.g., Peng, 2007; Hirschmann et al., 2010; Jahnke & Macciò, 2011; Anglés-Alcázar et al., 2013). Knowledge of the intrinsic scatter in is crucial for calculating the quiescent black hole mass function, as is understanding whether stellar mass or stellar velocity dispersion is a better predictor of black hole mass (e.g., Lauer et al., 2007b, a). In addition to providing key constraints on current theories of black hole and galaxy growth, these scaling relations are also a critical input in numerous applications that rely on black hole demographics, e.g., the predicted contributions from merging supermassive black hole binaries to the gravitational wave background targeted by the ongoing pulsar timing experiments (van Haasteren et al., 2011; Demorest et al., 2013; Shannon et al., 2013) and LISA.
Cores in central light profiles within a few ∼100 pc are often seen in massive galaxies. These cores are thought to be a sign of black hole scouring (Begelman et al., 1980), consistent with several scaling relations between core size and other galaxy properties (e.g., Faber et al. 1997; Ferrarese et al. 2006; Lauer et al. 2007b; Kormendy & Bender 2009; Rusli et al. 2013a). As part of our dynamical modeling, we see evidence for an excess of tangential orbits at the galaxy centers, consistent with black hole scouring. We will use our orbit modeling to investigate the connection between the central black hole mass and nuclear galaxy structure.
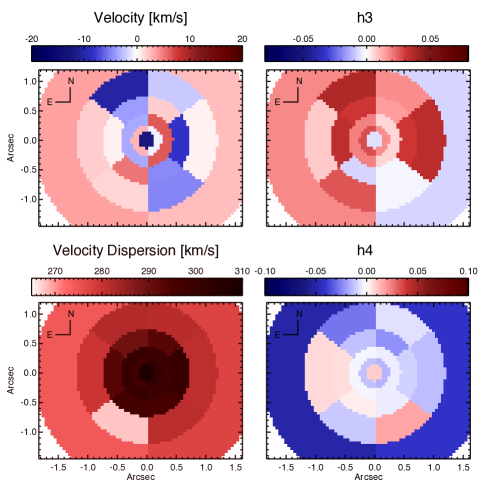
Figure 11 shows two-dimensional stellar kinematics for the central region of NGC 5557 from our observations with NIFS and LGS-AO on Gemini North. We use stellar templates from Gemini’s NIFS/GNIRS template library and fit LOSVD-convolved templates to the -band CO bandhead features in each galaxy spectrum. Figure 11 shows the resulting four Gauss-Hermite velocity moments as defined in Equation (5). When applied to stellar orbit, our combined NIFS and Mitchell data yield a black hole mass of in NGC 5557 (McConnell et al. 2014, in prep.).
6.4. The and Relations
The tight scaling relations among size, luminosity, and stellar velocity dispersion of early-type galaxies (e.g., Faber & Jackson, 1976; Kormendy, 1977; Dressler et al., 1987) have long been used to constrain galaxy assembly (e.g., Boylan-Kolchin et al., 2005; Robertson et al., 2006, and references therein). With our spatially resolved stellar kinematics and deep band imaging, we will refine the measurements of the galaxy scaling relations by adding galaxies at the most massive end (e.g., Bernardi et al., 2003a).
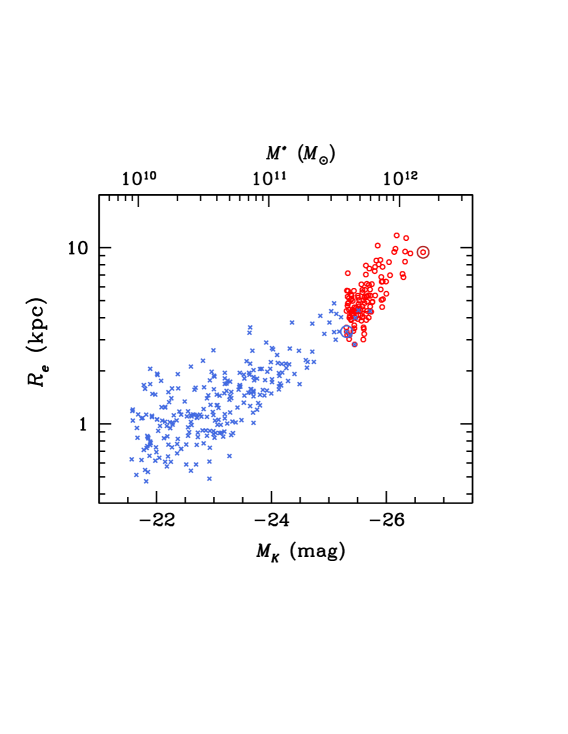
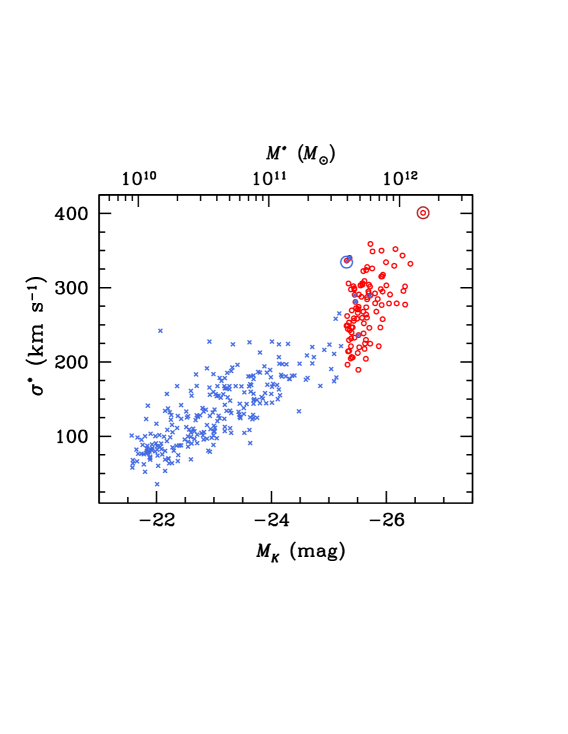
Figure 12 plots the 2MASS and relation (e.g., Kormendy, 1977) for MASSIVE and ATLASgalaxies. Figure 13 shows the stellar velocity dispersion and for the 103 MASSIVE galaxies with existing measurements. We emphasize that no cuts are made on either or in our sample selection. These plots are only meant to illustrate the demographics of our survey galaxies based on currently available data. We will improve these measurements to address possible biases in 2MASS (Sec 2.3) and massive galaxy sizes (e.g., Bernardi et al. 2012) and to study the distribution of our galaxies in projections of the fundamental plane (e.g., Lauer et al., 2007b; Kormendy et al., 2009).
6.5. X-Ray Gas and Halo Mass
Roughly 30% of the galaxies in the MASSIVE survey have archival Chandra/XMM X-ray observations that are sensitive enough to detect thermal emission from the hot halo gas. If the gas is in thermal equilibrium, then the ratio / reflects the ratio of dark matter halo to stellar mass. Empirically, large scatter (factor of ) is found between and (e.g., Forman et al., 1985; Fabbiano, 1989), and there are hints that the slope and scatter depend on environment (Mulchaey & Jeltema, 2010). Likely at play are both intrinsic scatter in the relation between stellar and dark halo mass, and non-equilibrium conditions in the hot gas, e.g., due to AGN feedback (Diehl & Statler, 2008; Dunn et al., 2010).
There is a hint of a tighter correlation between and total dynamical mass (stellar and dark matter halo) than (Mathews et al., 2006; Kim & Fabbiano, 2013), but the sample with independent dynamical halo masses and deep X-ray observations is small, and M87 is still the most massive galaxy included. With MASSIVE, we will revisit the and relations for a large and well-defined sample with uniform dynamical halo masses and a range of environments. We may also explore the importance of radio jets in keeping the halo gas from cooling (Allen et al., 2006; McNamara & Nulsen, 2007).
7. Summary
MASSIVE is a comprehensive IFS survey of a volume-limited and mass-selected sample of the most massive early-type galaxies within Mpc. MASSIVE is the first IFS survey to specifically target galaxies with . We exploit the large (107″107″) areal coverage of the Mitchell Spectrograph to obtain stellar population and kinematic information beyond twice the effective radius of our galaxies, while using AO-assisted IFS data on small scales to probe the sphere of influence of the supermassive black hole. The sample galaxies span a narrow range in stellar mass, but a wide range in stellar velocity dispersion, size, halo mass and large-scale environment. Thus, we are poised to determine the relationships between central black hole mass, stellar mass, and dark halo mass for the most massive galaxies in the universe today.
| Galaxy | R.A. | Dec. | Env. | Note | ||||||||
|---|---|---|---|---|---|---|---|---|---|---|---|---|
| (deg) | (deg) | (Mpc) | (mag) | (mag) | (mag) | (km/s) | (km/s) | (arcsec) | (arcsec) | |||
| (1) | (2) | (3) | (4) | (5) | (6) | (7) | (8) | (9) | (10) | (11) | (12) | (13) |
| NGC 0057 | 3.8787 | 17.3284 | 76.3 | 8.68 | 0.212 | 25.75 | 326 | 13.2 | 27.0 | 1 | ||
| NGC 0080 | 5.2952 | 22.3572 | 81.9 | 8.92 | 0.168 | 25.66 | 260 | 15.7 | 32.2 | 14 B | ||
| NGC 0128 | 7.3128 | 2.8641 | 59.3 | 8.52 | 0.079 | 25.35 | 215 | 10.5 | 18.0 | 1 | ||
| NGC 0227 | 10.6534 | 1.5288 | 75.9 | 9.09 | 0.084 | 25.32 | 262 | 8.7 | 27.2 | 4 B | ||
| NGC 0315 | 14.4538 | 30.3524 | 70.3 | 7.96 | 0.177 | 26.30 | 296 | 20.0 | 25.1 | 6 B | ||
| NGC 0383 | 16.8540 | 32.4126 | 71.3 | 8.48 | 0.194 | 25.81 | 279 | 15.5 | 20.5 | 29 | 4ZW038 | |
| NGC 0393 | 17.1540 | 39.6443 | 85.7 | 9.23 | 0.120 | 25.44 | 233 | 11.0 | 1 | |||
| NGC 0410 | 17.7453 | 33.1520 | 71.3 | 8.38 | 0.161 | 25.90 | 298 | 16.8 | 31.6 | 29 B | ||
| NGC 0467 | 19.7922 | 3.3008 | 75.8 | 9.01 | 0.092 | 25.40 | 247 | 14.5 | 21.5 | 1 | ||
| PGC 004829 | 20.1287 | 50.1445 | 99.0 | 9.74 | 0.554 | 25.30 | 7.3 | 1 | ||||
| NGC 0499 | 20.7978 | 33.4601 | 69.8 | 8.74 | 0.193 | 25.50 | 266 | 11.6 | 15.6 | 35 | ||
| NGC 0507 | 20.9164 | 33.2561 | 69.8 | 8.30 | 0.170 | 25.93 | 295 | 23.0 | 38.4 | 35 B | ||
| NGC 0533 | 21.3808 | 1.7590 | 77.9 | 8.42 | 0.084 | 26.05 | 279 | 21.9 | 40.7 | 3 B | ||
| NGC 0545† | 21.4963 | 1.3402 | 74.0 | 0.114 | 250 | 32 B | A194 | |||||
| NGC 0547 | 21.5024 | 1.3451 | 74.0 | 8.49 | 0.113 | 25.83 | 262 | 25.1 | 19.7 | 32 | A194 | |
| NGC 0665 | 26.2338 | 10.4230 | 74.6 | 8.88 | 0.242 | 25.51 | 190 | 11.5 | 13.7 | 4 B | ||
| UGC 01332 | 28.0755 | 48.0878 | 99.2 | 9.48 | 0.557 | 25.57 | 12.9 | 8 B | ||||
| NGC 0708 | 28.1937 | 36.1518 | 69.0 | 8.57 | 0.247 | 25.65 | 230 | 23.7 | 39 B | A262 | ||
| UGC 01389 | 28.8778 | 47.9550 | 99.2 | 9.63 | 0.519 | 25.41 | 9.2 | 8 | ||||
| NGC 0741 | 29.0874 | 5.6289 | 73.9 | 8.30 | 0.144 | 26.06 | 291 | 19.5 | 26.9 | 5 B | ||
| NGC 0777 | 30.0622 | 31.4294 | 72.2 | 8.37 | 0.128 | 25.94 | 318 | 14.6 | 18.6 | 7 B | ||
| NGC 0890 | 35.5042 | 33.2661 | 55.6 | 8.25 | 0.212 | 25.50 | 212 | 16.7 | 1 | |||
| NGC 0910 | 36.3616 | 41.8243 | 79.8 | 9.20 | 0.157 | 25.33 | 249 | 13.6 | 29 | A347 | ||
| NGC 0997 | 39.3103 | 7.3056 | 90.4 | 9.42 | 0.380 | 25.40 | 9.6 | 23.5 | 3 B | |||
| NGC 1016 | 39.5815 | 2.1193 | 95.2 | 8.58 | 0.085 | 26.33 | 302 | 18.1 | 26.8 | 8 B | ||
| NGC 1060 | 40.8127 | 32.4250 | 67.4 | 8.20 | 0.532 | 26.00 | 303 | 16.8 | 36.9 | 12 B | ||
| NGC 1066 | 40.9579 | 32.4749 | 67.4 | 8.89 | 0.563 | 25.31 | 17.5 | 26.6 | 12 | |||
| NGC 1132 | 43.2159 | 1.2747 | 97.6 | 9.26 | 0.176 | 25.70 | 246 | 16.1 | 30.9 | 3 B | ||
| NGC 1129 | 43.6141 | 41.5796 | 73.9 | 8.24 | 0.309 | 26.14 | 330 | 26.4 | 30.2 | 33 B | ||
| NGC 1167 | 45.4265 | 35.2056 | 70.2 | 8.64 | 0.496 | 25.64 | 204 | 20.7 | 29.7 | 3 B | ||
| NGC 1226 | 47.7723 | 35.3868 | 85.7 | 9.21 | 0.526 | 25.51 | 271 | 12.5 | 3 B | |||
| IC 0310 | 49.1792 | 41.3248 | 77.5 | 9.15 | 0.445 | 25.35 | 230 | 239 | 11.8 | 15.3 | 117 | Perseus/A426 |
| NGC 1272 | 49.8387 | 41.4906 | 77.5 | 8.69 | 0.441 | 25.80 | 292 | 20.7 | 31.5 | 117 | Perseus/A426 | |
| UGC 02783 | 53.5766 | 39.3568 | 85.8 | 9.27 | 0.447 | 25.44 | 299 | 8.4 | 9.0 | 4 B | ||
| NGC 1453 | 56.6136 | 3.9688 | 56.4 | 8.12 | 0.289 | 25.67 | 328 | 16.0 | 12 B | |||
| NGC 1497 | 60.5283 | 23.1329 | 87.8 | 9.48 | 0.602 | 25.31 | 249 | 10.3 | 1 | |||
| NGC 1600 | 67.9161 | 5.0861 | 63.8 | 8.04 | 0.118 | 25.99 | 334 | 20.8 | 16 B | |||
| NGC 1573 | 68.7666 | 73.2624 | 65.0 | 8.56 | 0.377 | 25.55 | 303 | 13.9 | 15 B | |||
| NGC 1684 | 73.1298 | 3.1061 | 63.5 | 8.69 | 0.159 | 25.34 | 306 | 15.8 | 11 B | |||
| NGC 1700 | 74.2347 | 4.8658 | 54.4 | 8.09 | 0.119 | 25.60 | 239 | 13.4 | 4 B | |||
| NGC 2208 | 95.6444 | 51.9095 | 84.1 | 9.04 | 0.408 | 25.63 | 225 | 14.2 | 1 | |||
| NGC 2256 | 101.8082 | 74.2365 | 79.4 | 8.67 | 0.359 | 25.87 | 221 | 20.9 | 10 B | |||
| NGC 2274 | 101.8224 | 33.5672 | 73.8 | 8.68 | 0.286 | 25.69 | 295 | 15.0 | 6 B | |||
| NGC 2258 | 101.9425 | 74.4818 | 59.0 | 8.23 | 0.351 | 25.66 | 287 | 18.6 | 3 B | |||
| NGC 2320 | 106.4251 | 50.5811 | 89.4 | 8.85 | 0.189 | 25.93 | 315 | 10.6 | 18 B | |||
| UGC 03683 | 107.0582 | 46.1159 | 85.1 | 9.16 | 0.253 | 25.52 | 291 | 11.2 | 4 B | |||
| NGC 2332 | 107.3924 | 50.1823 | 89.4 | 9.40 | 0.241 | 25.39 | 232 | 8.9 | 18 | |||
| NGC 2340 | 107.7950 | 50.1747 | 89.4 | 8.88 | 0.203 | 25.90 | 246 | 19.7 | 18 | |||
| UGC 03894 | 113.2695 | 65.0791 | 97.2 | 9.37 | 0.175 | 25.58 | 304 | 12.2 | 17.8 | 4 B | ||
| NGC 2418 | 114.1563 | 17.8839 | 74.1 | 8.95 | 0.102 | 25.42 | 247 | 11.7 | 16.2 | 1 | ||
| NGC 2456 | 118.5444 | 55.4953 | 107.3 | 9.83 | 0.106 | 25.33 | 214 | 10.9 | 1 | |||
| NGC 2492 | 119.8738 | 27.0264 | 97.8 | 9.60 | 0.109 | 25.36 | 243 | 273 | 8.7 | 12.6 | 3 B | |
| NGC 2513 | 120.6028 | 9.4136 | 70.8 | 8.74 | 0.063 | 25.52 | 274 | 13.9 | 24.0 | 4 B | ||
| NGC 2672 | 132.3412 | 19.0750 | 61.5 | 8.35 | 0.058 | 25.60 | 268 | 16.9 | 14.3 | 3 B | ||
| NGC 2693 | 134.2469 | 51.3474 | 74.4 | 8.60 | 0.054 | 25.76 | 349 | 13.7 | 15.4 | 1 | ||
| NGC 2783 | 138.4145 | 29.9929 | 101.4 | 9.32 | 0.082 | 25.72 | 301 | 254 | 11.8 | 38.2 | 3 B | |
| NGC 2832 | 139.9453 | 33.7498 | 105.2 | 8.70 | 0.047 | 26.42 | 332 | 18.2 | 21.2 | 4 B | A779 | |
| NGC 2892 | 143.2205 | 67.6174 | 101.1 | 9.35 | 0.233 | 25.70 | 304 | 12.5 | 23.3 | 1 | ||
| NGC 2918 | 143.9334 | 31.7054 | 102.3 | 9.57 | 0.053 | 25.49 | 258 | 223 | 8.8 | 18.9 | 1 | |
| NGC 3158 | 153.4605 | 38.7649 | 103.4 | 8.80 | 0.036 | 26.28 | 343 | 300 | 14.2 | 16.1 | 6 B | |
| NGC 3209 | 155.1601 | 25.5050 | 94.6 | 9.34 | 0.060 | 25.55 | 303 | 9.0 | 29.4 | 3 B | ||
| NGC 3332 | 160.1182 | 9.1825 | 89.1 | 9.37 | 0.087 | 25.38 | 221 | 220 | 12.5 | 23.7 | 1 |
Table 3, continued
| Galaxy | R.A. | Dec. | Env. | Note | ||||||||
|---|---|---|---|---|---|---|---|---|---|---|---|---|
| (deg) | (deg) | (Mpc) | (mag) | (mag) | (mag) | (km/s) | (km/s) | (arcsec) | (arcsec) | |||
| (1) | (2) | (3) | (4) | (5) | (6) | (7) | (8) | (9) | (10) | (11) | (12) | (13) |
| NGC 3343 | 161.5432 | 73.3531 | 93.8 | 9.57 | 0.331 | 25.33 | 10.6 | 1 | ||||
| NGC 3462 | 163.8378 | 7.6967 | 99.2 | 9.37 | 0.081 | 25.62 | 218 | 10.1 | 20.1 | 1 | ||
| NGC 3562 | 168.2445 | 72.8793 | 101.0 | 9.38 | 0.111 | 25.65 | 264 | 8.6 | 3 B | |||
| NGC 3615 | 169.5277 | 23.3973 | 101.2 | 9.45 | 0.049 | 25.58 | 259 | 271 | 8.2 | 20.2 | 3 B | |
| NGC 3805 | 175.1736 | 20.3430 | 99.4 | 9.30 | 0.064 | 25.69 | 293 | 295 | 8.3 | 16.5 | 42 | |
| NGC 3816 | 175.4502 | 20.1036 | 99.4 | 9.60 | 0.052 | 25.40 | 207 | 10.7 | 32.9 | 42 | ||
| NGC 3842 | 176.0090 | 19.9498 | 99.4 | 9.08 | 0.059 | 25.91 | 315 | 291 | 14.1 | 24.2 | 42 B | A1367 |
| NGC 3862 | 176.2708 | 19.6063 | 99.4 | 9.49 | 0.064 | 25.50 | 271 | 260 | 11.1 | 40.0 | 42 | |
| NGC 3937 | 178.1776 | 20.6313 | 101.2 | 9.42 | 0.117 | 25.62 | 309 | 289 | 10.7 | 34.7 | 10 B | |
| NGC 4055 | 181.0059 | 20.2323 | 107.2 | 9.76 | 0.095 | 25.40 | 270 | 8.1 | 17.5 | 18 | NGC 4061 | |
| NGC 4065 | 181.0257 | 20.2351 | 107.2 | 9.69 | 0.098 | 25.47 | 272 | 283 | 8.8 | 31.0 | 18 B | |
| NGC 4066 | 181.0392 | 20.3479 | 107.2 | 9.81 | 0.086 | 25.35 | 253 | 10.0 | 37.0 | 18 | ||
| NGC 4059 | 181.0471 | 20.4098 | 107.2 | 9.75 | 0.079 | 25.41 | 206 | 9.6 | 33.0 | 18 | ||
| NGC 4073 | 181.1128 | 1.8960 | 91.5 | 8.49 | 0.074 | 26.33 | 277 | 292 | 21.4 | 23.0 | 10 B | |
| NGC 4213 | 183.9064 | 23.9819 | 101.6 | 9.61 | 0.102 | 25.44 | 259 | 264 | 11.6 | 33.6 | 4 B | |
| NGC 4472 | 187.4450 | 8.0004 | 16.7* | 5.40 | 0.061 | 25.72 | 289 | 53.9 | 205 B | M49,Virgo | ||
| NGC 4486 | 187.7059 | 12.3911 | 16.7* | 5.81 | 0.063 | 25.31 | 336 | 41.3 | 48.7 | 205 | M87,Virgo | |
| NGC 4555 | 188.9216 | 26.5230 | 103.6 | 9.17 | 0.044 | 25.92 | 350 | 319 | 10.1 | 29.8 | 1 | |
| NGC 4649 | 190.9167 | 11.5526 | 16.5* | 5.74 | 0.072 | 25.36 | 340 | 39.8 | 44.1 | 205 | M60,Virgo | |
| NGC 4816 | 194.0506 | 27.7455 | 102.0* | 9.71 | 0.024 | 25.33 | 244 | 14.5 | 50.6 | 49 | Coma/A1656 | |
| NGC 4839 | 194.3515 | 27.4977 | 102.0* | 9.20 | 0.028 | 25.85 | 285 | 269 | 20.8 | 29.2 | 49 | Coma/A1656 |
| NGC 4874 | 194.8988 | 27.9594 | 102.0* | 8.86 | 0.025 | 26.18 | 279 | 266 | 23.8 | 32.0 | 49 | Coma/A1656 |
| NGC 4889 | 195.0338 | 27.9770 | 102.0* | 8.41 | 0.026 | 26.64 | 401 | 370 | 19.1 | 33.0 | 49 B | Coma/A1656 |
| NGC 4914 | 195.1789 | 37.3153 | 74.5 | 8.65 | 0.037 | 25.72 | 225 | 12.8 | 31.3 | 1 | NGC 4912 | |
| NGC 5129 | 201.0417 | 13.9765 | 107.5 | 9.25 | 0.078 | 25.92 | 277 | 262 | 12.3 | 21.8 | 1 | |
| NGC 5208 | 203.1163 | 7.3166 | 105.0 | 9.51 | 0.097 | 25.61 | 252 | 6.8 | 18.3 | 3 B | ||
| PGC 047776 | 203.4770 | 3.2836 | 103.8 | 9.73 | 0.076 | 25.36 | 7.9 | 13.2 | 9 B | |||
| NGC 5252 | 204.5661 | 4.5426 | 103.8 | 9.77 | 0.095 | 25.32 | 196 | 9.3 | 19.8 | 9 | ||
| NGC 5322 | 207.3133 | 60.1904 | 34.2 | 7.16 | 0.038 | 25.51 | 236 | 26.6 | 20.1 | 8 B | ||
| NGC 5353 | 208.3613 | 40.2831 | 41.1 | 7.63 | 0.035 | 25.45 | 290 | 14.2 | 27.8 | 12 B | ||
| NGC 5490 | 212.4888 | 17.5455 | 78.6 | 8.92 | 0.073 | 25.57 | 288 | 10.1 | 19.5 | 1 | ||
| NGC 5557 | 214.6071 | 36.4936 | 51.0 | 8.08 | 0.016 | 25.46 | 281 | 16.2 | 14.7 | 4 B | ||
| IC 1143 | 232.7345 | 82.4558 | 97.3 | 9.51 | 0.172 | 25.45 | 9.2 | 3 B | ||||
| UGC 10097 | 238.9303 | 47.8673 | 91.5 | 9.38 | 0.049 | 25.43 | 302 | 7.6 | 17.2 | 7 B | ||
| NGC 6223 | 250.7679 | 61.5789 | 86.7 | 9.11 | 0.100 | 25.59 | 10.6 | 4 B | ||||
| NGC 6364 | 261.1139 | 29.3902 | 105.3 | 9.74 | 0.106 | 25.38 | 205 | 7.7 | 11.5 | 1 | ||
| NGC 6375 | 262.3411 | 16.2067 | 95.8 | 9.42 | 0.334 | 25.53 | 220 | 10.8 | 1 | |||
| UGC 10918 | 264.3892 | 11.1217 | 100.2 | 9.31 | 0.498 | 25.75 | 12.8 | 1 | ||||
| NGC 6442 | 266.7139 | 20.7611 | 98.0 | 9.59 | 0.239 | 25.40 | 240 | 9.1 | 1 | |||
| NGC 6482 | 267.9534 | 23.0719 | 61.4 | 8.37 | 0.277 | 25.60 | 322 | 10.1 | 3 B | |||
| NGC 6575 | 272.7395 | 31.1162 | 106.0 | 9.56 | 0.172 | 25.58 | 306 | 9.0 | 1 | |||
| NGC 7052 | 319.6377 | 26.4469 | 69.3 | 8.58 | 0.337 | 25.67 | 284 | 14.7 | 1 | |||
| NGC 7242 | 333.9146 | 37.2987 | 84.4 | 8.33 | 0.415 | 26.34 | 27.7 | 15 B | ||||
| NGC 7265 | 335.6145 | 36.2098 | 82.8 | 8.69 | 0.325 | 25.93 | 258 | 16.0 | 21 B | |||
| NGC 7274 | 336.0462 | 36.1259 | 82.8 | 9.24 | 0.295 | 25.39 | 298 | 12.6 | 21 | |||
| NGC 7386 | 342.5089 | 11.6987 | 99.1 | 9.42 | 0.200 | 25.58 | 11.6 | 38.1 | 3 B | |||
| NGC 7426 | 344.0119 | 36.3614 | 80.0 | 8.82 | 0.337 | 25.74 | 11.2 | 4 B | ||||
| NGC 7436 | 344.4897 | 26.1500 | 106.6 | 9.01 | 0.250 | 26.16 | 352 | 19.1 | 25.0 | 8 B | ||
| NGC 7550 | 348.8170 | 18.9614 | 72.7 | 8.91 | 0.375 | 25.43 | 255 | 12.4 | 28.0 | 3 B | ||
| NGC 7556 | 348.9353 | 2.3815 | 103.0 | 9.25 | 0.097 | 25.83 | 268 | 16.9 | 26.4 | 4 B | ||
| NGC 7618 | 349.9468 | 42.8526 | 76.3 | 9.04 | 0.609 | 25.44 | 298 | 9.8 | 10 B | |||
| NGC 7619 | 350.0605 | 8.2063 | 54.0 | 8.03 | 0.224 | 25.65 | 324 | 14.8 | 34.6 | 12 B | ||
| NGC 7626 | 350.1772 | 8.2170 | 54.0 | 8.03 | 0.197 | 25.65 | 274 | 20.1 | 26.7 | 12 | ||
| NGC 7681 | 352.2287 | 17.3096 | 96.8 | 9.22 | 0.149 | 25.72 | 359 | 11.4 | 5.5 | 1 |
Notes. Column (1): in order of increasing R.A.
Column (2): right ascension in degrees (J2000.0).
Column (3): declination in degrees (J2000.0).
Column (4): distance. Symbol indicates SBF distances; others are from group-corrected flow velocities,
as described in Sec 2.2.
Column (5): “total” galaxy apparent -band magnitude from 2MASS XSC (parameter k_m_ext).
Column (6): foreground galactic extinction in Landolt -band (Schlafly & Finkbeiner, 2011) with reddening relation of Fitzpatrick (1999).
Column (7): extinction-corrected “total” absolute -band magnitude derived from distance in column (4), apparent magnitude in column (5),
and foreground extinction in column (6), using Equation (1). Column (8): central stellar velocity dispersion from HyperLeda. Column (9): central stellar velocity dispersion from the NASA-Sloan Atlas.
Column (10): effective radius from 2MASS, defined in Equation (3).
Column (11): optical half-light radius from the NASA-Sloan Atlas.
Column (12): galaxy environment – number of group members in the 2MASS HDC group catalog (Crook et al., 2007);
“B” indicates brightest group galaxy.
Column (13): additional comments, e.g., alternative names, associated clusters.
† NGC 545 is a close companion of NGC 547. It is not listed in 2MASS but is designated the BCG of Abell 194 with in Lauer et al. (2007b).
Appendix A
![[Uncaptioned image]](/html/1407.1054/assets/x15.png)
![[Uncaptioned image]](/html/1407.1054/assets/x16.png)
References
- Adams et al. (2012) Adams, J. J., Gebhardt, K., Blanc, G. A., et al. 2012, ApJ, 745, 92
- Adams et al. (2011) Adams, J. J., et al. 2011, ApJS, 192, 5
- Aihara et al. (2011) Aihara, H., et al. 2011, ApJS, 193, 29
- Allen et al. (2006) Allen, S. W., Dunn, R. J. H., Fabian, A. C., Taylor, G. B., & Reynolds, C. S. 2006, MNRAS, 372, 21
- Anglés-Alcázar et al. (2013) Anglés-Alcázar, D., Özel, F., & Davé, R. 2013, ApJ, 770, 5
- Arnold et al. (2014) Arnold, J. A., Romanowsky, A. J., Brodie, J. P., et al. 2014, ApJ, 791, 80
- Auger et al. (2010) Auger, M. W., Treu, T., Gavazzi, R., et al. 2010, ApJ, 721, L163
- Barden et al. (1998) Barden, S. C., Sawyer, D. G., & Honeycutt, R. K. 1998, in Society of Photo-Optical Instrumentation Engineers (SPIE) Conference Series, Vol. 3355, Society of Photo-Optical Instrumentation Engineers (SPIE) Conference Series, ed. S. D’Odorico, 892–899
- Barnabè et al. (2011) Barnabè, M., Czoske, O., Koopmans, L. V. E., Treu, T., & Bolton, A. S. 2011, MNRAS, 415, 2215
- Barnabè et al. (2013) Barnabè, M., Spiniello, C., Koopmans, L. V. E., et al. 2013, MNRAS, 436, 253
- Begelman et al. (1980) Begelman, M. C., Blandford, R. D., & Rees, M. J. 1980, Nature, 287, 307
- Beifiori et al. (2012) Beifiori, A., Courteau, S., Corsini, E. M., & Zhu, Y. 2012, MNRAS, 419, 2497
- Bender et al. (1989) Bender, R., Surma, P., Doebereiner, S., Moellenhoff, C., & Madejsky, R. 1989, A&A, 217, 35
- Bernardi et al. (2012) Bernardi, M., Meert, A., Vikram, V., et al. 2012, ArXiv e-prints
- Bernardi et al. (2003a) Bernardi, M., Sheth, R. K., Annis, J., et al. 2003a, AJ, 125, 1866
- Bernardi et al. (2003b) —. 2003b, AJ, 125, 1882
- Binney (1978) Binney, J. 1978, MNRAS, 183, 501
- Blakeslee (2013) Blakeslee, J. P. 2013, in IAU Symposium, Vol. 289, IAU Symposium, ed. R. de Grijs, 304–311
- Blakeslee et al. (2003) Blakeslee, J. P., Franx, M., Postman, M., et al. 2003, ApJ, 596, L143
- Blakeslee et al. (2009) Blakeslee, J. P., Jordán, A., Mei, S., et al. 2009, ApJ, 694, 556
- Blakeslee et al. (2010) Blakeslee, J. P., Cantiello, M., Mei, S., et al. 2010, ApJ, 724, 657
- Blanc et al. (2009) Blanc, G. A., Heiderman, A., Gebhardt, K., Evans, II, N. J., & Adams, J. 2009, ApJ, 704, 842
- Blanc et al. (2013) Blanc, G. A., Weinzirl, T., Song, M., et al. 2013, AJ, 145, 138
- Blanton et al. (2005) Blanton, M. R., Eisenstein, D., Hogg, D. W., Schlegel, D. J., & Brinkmann, J. 2005, ApJ, 629, 143
- Blanton et al. (2011) Blanton, M. R., Kazin, E., Muna, D., Weaver, B. A., & Price-Whelan, A. 2011, AJ, 142, 31
- Bolton et al. (2012) Bolton, A. S., Schlegel, D. J., Aubourg, É., et al. 2012, AJ, 144, 144
- Bower et al. (1992) Bower, R. G., Lucey, J. R., & Ellis, R. S. 1992, MNRAS, 254, 601
- Boylan-Kolchin et al. (2005) Boylan-Kolchin, M., Ma, C.-P., & Quataert, E. 2005, MNRAS, 362, 184
- Boylan-Kolchin et al. (2006) —. 2006, MNRAS, 369, 1081
- Brodie et al. (2014) Brodie, J. P., Romanowsky, A. J., Strader, J., et al. 2014, ArXiv e-prints
- Canning et al. (2014) Canning, R. E. A., Ryon, J. E., Gallagher, J. S., et al. 2014, MNRAS, 444, 336
- Cantiello et al. (2007) Cantiello, M., Blakeslee, J., Raimondo, G., Brocato, E., & Capaccioli, M. 2007, ApJ, 668, 130
- Cappellari (2013) Cappellari, M. 2013, ApJ, 778, L2
- Cappellari & Emsellem (2004) Cappellari, M., & Emsellem, E. 2004, PASP, 116, 138
- Cappellari et al. (2009) Cappellari, M., di Serego Alighieri, S., Cimatti, A., et al. 2009, ApJ, 704, L34
- Cappellari et al. (2011) Cappellari, M., et al. 2011, MNRAS, 413, 813
- Cappellari et al. (2012) —. 2012, Nature, 484, 485
- Carollo & Danziger (1994) Carollo, C. M., & Danziger, I. J. 1994, MNRAS, 270, 523
- Conroy & van Dokkum (2012) Conroy, C., & van Dokkum, P. 2012, ApJ, 747, 69
- Crook et al. (2007) Crook, A. C., Huchra, J. P., Martimbeau, N., et al. 2007, ApJ, 655, 790
- Crook et al. (2008) —. 2008, ApJ, 685, 1320
- Croom et al. (2012) Croom, S. M., Lawrence, J. S., Bland-Hawthorn, J., et al. 2012, MNRAS, 421, 872
- Daddi et al. (2005) Daddi, E., et al. 2005, ApJ, 626, 680
- Damjanov et al. (2009) Damjanov, I., et al. 2009, ApJ, 695, 101
- Davies et al. (1983) Davies, R. L., Efstathiou, G., Fall, S. M., Illingworth, G., & Schechter, P. L. 1983, ApJ, 266, 41
- De Lucia et al. (2006) De Lucia, G., Springel, V., White, S. D. M., Croton, D., & Kauffmann, G. 2006, MNRAS, 366, 499
- de Vaucouleurs et al. (1991) de Vaucouleurs, G., de Vaucouleurs, A., Corwin, Jr., H. G., et al. 1991, Third Reference Catalogue of Bright Galaxies. Volume I: Explanations and references. Volume II: Data for galaxies between 0h and 12h. Volume III: Data for galaxies between 12h and 24h.
- Demorest et al. (2013) Demorest, P. B., Ferdman, R. D., Gonzalez, M. E., et al. 2013, ApJ, 762, 94
- Desroches et al. (2007) Desroches, L.-B., Quataert, E., Ma, C.-P., & West, A. A. 2007, MNRAS, 377, 402
- Diehl & Statler (2008) Diehl, S., & Statler, T. S. 2008, ApJ, 680, 897
- Donato et al. (2004) Donato, D., Sambruna, R. M., & Gliozzi, M. 2004, ApJ, 617, 915
- Dressler et al. (1987) Dressler, A., Lynden-Bell, D., Burstein, D., et al. 1987, ApJ, 313, 42
- Dunn et al. (2010) Dunn, R. J. H., Allen, S. W., Taylor, G. B., et al. 2010, MNRAS, 404, 180
- Dutton et al. (2013) Dutton, A. A., Macciò, A. V., Mendel, J. T., & Simard, L. 2013, MNRAS, 432, 2496
- Eisenhardt et al. (2007) Eisenhardt, P. R., De Propris, R., Gonzalez, A. H., et al. 2007, ApJS, 169, 225
- Emsellem et al. (1994) Emsellem, E., Monnet, G., & Bacon, R. 1994, A&A, 285, 723
- Emsellem et al. (2011) Emsellem, E., Cappellari, M., Krajnović, D., et al. 2011, MNRAS, 414, 888
- Fabbiano (1989) Fabbiano, G. 1989, ARA&A, 27, 87
- Faber et al. (1985) Faber, S. M., Friel, E. D., Burstein, D., & Gaskell, C. M. 1985, ApJS, 57, 711
- Faber & Jackson (1976) Faber, S. M., & Jackson, R. E. 1976, ApJ, 204, 668
- Faber et al. (1997) Faber, S. M., et al. 1997, AJ, 114, 1771
- Faber et al. (2007) Faber, S. M., Willmer, C. N. A., Wolf, C., et al. 2007, ApJ, 665, 265
- Ferrarese & Merritt (2000) Ferrarese, L., & Merritt, D. 2000, ApJ, 539, L9
- Ferrarese et al. (2006) Ferrarese, L., Côté, P., Jordán, A., et al. 2006, ApJS, 164, 334
- Fitzpatrick (1999) Fitzpatrick, E. L. 1999, PASP, 111, 63
- Forman et al. (1985) Forman, W., Jones, C., & Tucker, W. 1985, ApJ, 293, 102
- Franx et al. (1991) Franx, M., Illingworth, G., & de Zeeuw, T. 1991, ApJ, 383, 112
- Gebhardt et al. (2011) Gebhardt, K., Adams, J., Richstone, D., et al. 2011, ApJ, 729, 119
- Gebhardt & Thomas (2009) Gebhardt, K., & Thomas, J. 2009, ApJ, 700, 1690
- Gebhardt et al. (2000) Gebhardt, K., Richstone, D., Kormendy, J., et al. 2000, AJ, 119, 1157
- Graves et al. (2009) Graves, G. J., Faber, S. M., & Schiavon, R. P. 2009, ApJ, 693, 486
- Graves et al. (2007) Graves, G. J., Faber, S. M., Schiavon, R. P., & Yan, R. 2007, ApJ, 671, 243
- Graves & Schiavon (2008) Graves, G. J., & Schiavon, R. P. 2008, ApJS, 177, 446
- Greene et al. (2012) Greene, J. E., Murphy, J. D., Comerford, J. M., Gebhardt, K., & Adams, J. J. 2012, ApJ, 750, 32
- Greene et al. (2013) Greene, J. E., Murphy, J. D., Graves, G. J., et al. 2013, ApJ, 776, 64
- Greene et al. (2010) Greene, J. E., Peng, C. Y., Kim, M., et al. 2010, ApJ, 721, 26
- Gültekin et al. (2009) Gültekin, K., et al. 2009, ApJ, 698, 198
- Häring & Rix (2004) Häring, N., & Rix, H.-W. 2004, ApJ, 604, L89
- Heisler et al. (1985) Heisler, J., Tremaine, S., & Bahcall, J. N. 1985, ApJ, 298, 8
- Hill et al. (2008) Hill, G. J., et al. 2008, in Society of Photo-Optical Instrumentation Engineers (SPIE) Conference Series, Vol. 7014, Society of Photo-Optical Instrumentation Engineers (SPIE) Conference Series
- Hilz et al. (2013) Hilz, M., Naab, T., & Ostriker, J. P. 2013, MNRAS, 429, 2924
- Hirschmann et al. (2010) Hirschmann, M., Khochfar, S., Burkert, A., et al. 2010, MNRAS, 407, 1016
- Ho (2007) Ho, L. C. 2007, ApJ, 668, 94
- Huchra et al. (2012) Huchra, J. P., et al. 2012, ApJS, 199, 26
- Jahnke & Macciò (2011) Jahnke, K., & Macciò, A. V. 2011, ApJ, 734, 92
- Jarrett et al. (2000) Jarrett, T. H., Chester, T., Cutri, R., et al. 2000, AJ, 119, 2498
- Jarrett et al. (2003) Jarrett, T. H., Chester, T., Cutri, R., Schneider, S. E., & Huchra, J. P. 2003, AJ, 125, 525
- Jones et al. (2003) Jones, L. R., Ponman, T. J., Horton, A., et al. 2003, MNRAS, 343, 627
- Kelson et al. (2006) Kelson, D. D., Illingworth, G. D., Franx, M., & van Dokkum, P. G. 2006, ApJ, 653, 159
- Kim & Fabbiano (2013) Kim, D.-W., & Fabbiano, G. 2013, ApJ, 776, 116
- Kormendy (1977) Kormendy, J. 1977, ApJ, 218, 333
- Kormendy & Bender (1996) Kormendy, J., & Bender, R. 1996, ApJ, 464, L119
- Kormendy & Bender (2009) —. 2009, ApJ, 691, L142
- Kormendy et al. (2009) Kormendy, J., Fisher, D. B., Cornell, M. E., & Bender, R. 2009, ApJS, 182, 216
- Kormendy & Ho (2013) Kormendy, J., & Ho, L. C. 2013, ARA&A, 51, 511
- Krajnović et al. (2011) Krajnović, D., Emsellem, E., Cappellari, M., et al. 2011, MNRAS, 414, 2923
- Krajnović et al. (2013) Krajnović, D., Karick, A. M., Davies, R. L., et al. 2013, MNRAS, 433, 2812
- Kuo et al. (2011) Kuo, C. Y., et al. 2011, ApJ, 727, 20
- Larkin et al. (2006) Larkin, J., Barczys, M., Krabbe, A., et al. 2006, in Society of Photo-Optical Instrumentation Engineers (SPIE) Conference Series, Vol. 6269, Society of Photo-Optical Instrumentation Engineers (SPIE) Conference Series
- Läsker et al. (2014) Läsker, R., Ferrarese, L., & van de Ven, G. 2014, ApJ, 780, 69
- Lauer et al. (2007a) Lauer, T. R., Tremaine, S., Richstone, D., & Faber, S. M. 2007a, ApJ, 670, 249
- Lauer et al. (2007b) Lauer, T. R., et al. 2007b, ApJ, 662, 808
- Lavaux & Hudson (2011) Lavaux, G., & Hudson, M. J. 2011, MNRAS, 416, 2840
- Magorrian et al. (1998) Magorrian, J., Tremaine, S., Richstone, D., et al. 1998, AJ, 115, 2285
- Marconi & Hunt (2003) Marconi, A., & Hunt, L. K. 2003, ApJ, 589, L21
- Martín-Navarro et al. (2014) Martín-Navarro, I., La Barbera, F., Vazdekis, A., Falcón-Barroso, J., & Ferreras, I. 2014, MNRAS, submitted (arXiv:1404.6533)
- Mathews et al. (2006) Mathews, W. G., Brighenti, F., Faltenbacher, A., et al. 2006, ApJ, 652, L17
- McConnell & Ma (2013) McConnell, N. J., & Ma, C.-P. 2013, ApJ, 764, 184
- McConnell et al. (2011a) McConnell, N. J., Ma, C.-P., Gebhardt, K., et al. 2011a, Nature, 480, 215
- McConnell et al. (2011b) McConnell, N. J., Ma, C.-P., Graham, J. R., et al. 2011b, ApJ, 728, 100
- McConnell et al. (2012) McConnell, N. J., Ma, C.-P., Murphy, J. D., et al. 2012, ApJ, 756, 179
- McNamara & Nulsen (2007) McNamara, B. R., & Nulsen, P. E. J. 2007, ARA&A, 45, 117
- Mehlert et al. (2003) Mehlert, D., Thomas, D., Saglia, R. P., Bender, R., & Wegner, G. 2003, A&A, 407, 423
- Memola et al. (2009) Memola, E., Trinchieri, G., Wolter, A., Focardi, P., & Kelm, B. 2009, A&A, 497, 359
- Mould et al. (2000) Mould, J. R., Huchra, J. P., Freedman, W. L., et al. 2000, ApJ, 529, 786
- Mulchaey & Jeltema (2010) Mulchaey, J. S., & Jeltema, T. E. 2010, ApJ, 715, L1
- Murphy et al. (2011) Murphy, J. D., Gebhardt, K., & Adams, J. J. 2011, ApJ, 729, 129
- Naab et al. (2009) Naab, T., Johansson, P. H., & Ostriker, J. P. 2009, ApJ, 699, L178
- Naab et al. (2007) Naab, T., Johansson, P. H., Ostriker, J. P., & Efstathiou, G. 2007, ApJ, 658, 710
- Naab et al. (2014) Naab, T., Oser, L., Emsellem, E., et al. 2014, MNRAS, 444, 3357
- Oguri et al. (2014) Oguri, M., Rusu, C. E., & Falco, E. E. 2014, MNRAS, 439, 2494
- Oser et al. (2010) Oser, L., Ostriker, J. P., Naab, T., Johansson, P. H., & Burkert, A. 2010, ApJ, 725, 2312
- O’Sullivan & Ponman (2004) O’Sullivan, E., & Ponman, T. J. 2004, MNRAS, 354, 935
- O’Sullivan et al. (2007) O’Sullivan, E., Sanderson, A. J. R., & Ponman, T. J. 2007, MNRAS, 380, 1409
- Pastorello et al. (2014) Pastorello, N., Forbes, D. A., Foster, C., et al. 2014, MNRAS, 442, 1003
- Paturel et al. (2003) Paturel, G., Petit, C., Prugniel, P., et al. 2003, A&A, 412, 45
- Peng (2007) Peng, C. Y. 2007, ApJ, 671, 1098
- Ponman et al. (1994) Ponman, T. J., Allan, D. J., Jones, L. R., et al. 1994, Nature, 369, 462
- Prugniel & Simien (1996) Prugniel, P., & Simien, F. 1996, A&A, 309, 749
- Pu et al. (2010) Pu, S. B., Saglia, R. P., Fabricius, M. H., et al. 2010, A&A, 516, A4
- Raskutti et al. (2014) Raskutti, S., Greene, J. E., & Murphy, J. D. 2014, ApJ, 786, 23
- Robertson et al. (2006) Robertson, B., et al. 2006, ApJ, 641, 21
- Rusli et al. (2013a) Rusli, S. P., Erwin, P., Saglia, R. P., et al. 2013a, AJ, 146, 160
- Rusli et al. (2011) Rusli, S. P., Thomas, J., Erwin, P., et al. 2011, MNRAS, 410, 1223
- Rusli et al. (2013b) Rusli, S. P., Thomas, J., Saglia, R. P., et al. 2013b, AJ, 146, 45
- Sánchez et al. (2012) Sánchez, S. F., Kennicutt, R. C., Gil de Paz, A., et al. 2012, A&A, 538, A8
- Sánchez-Blázquez et al. (2006) Sánchez-Blázquez, P., Peletier, R. F., Jiménez-Vicente, J., et al. 2006, MNRAS, 371, 703
- Schlafly & Finkbeiner (2011) Schlafly, E. F., & Finkbeiner, D. P. 2011, ApJ, 737, 103
- Schombert & Smith (2012) Schombert, J., & Smith, A. K. 2012, PASA, 29, 174
- Schulze & Gebhardt (2011) Schulze, A., & Gebhardt, K. 2011, ApJ, 729, 21
- Shannon et al. (2013) Shannon, R. M., Ravi, V., Coles, W. A., et al. 2013, Science, 342, 334
- Shen & Gebhardt (2010) Shen, J., & Gebhardt, K. 2010, ApJ, 711, 484
- Skrutskie et al. (2006) Skrutskie, M. F., Cutri, R. M., Stiening, R., et al. 2006, AJ, 131, 1163
- Smith (2014) Smith, R. J. 2014, MNRAS, 443, L69
- Smith & Lucey (2013) Smith, R. J., & Lucey, J. R. 2013, MNRAS, 434, 1964
- Sonnenfeld et al. (2012) Sonnenfeld, A., et al. 2012, ApJ, 752, 163
- Spiniello et al. (2014) Spiniello, C., Trager, S., Koopmans, L. V. E., & Conroy, C. 2014, MNRAS, 438, 1483
- Spolaor et al. (2010) Spolaor, M., Kobayashi, C., Forbes, D. A., Couch, W. J., & Hau, G. K. T. 2010, MNRAS, 408, 272
- Sun et al. (2013) Sun, A.-L., Greene, J. E., Impellizzeri, C. M. V., et al. 2013, ApJ, 778, 47
- Thomas et al. (2005) Thomas, D., Maraston, C., Bender, R., & Mendes de Oliveira, C. 2005, ApJ, 621, 673
- Thomas et al. (2014) Thomas, J., Saglia, R. P., Bender, R., Erwin, P., & Fabricius, M. 2014, ApJ, 782, 39
- Thomas et al. (2007) Thomas, J., et al. 2007, MNRAS, 382, 657
- Thomas et al. (2011) Thomas, J., Saglia, R. P., Bender, R., et al. 2011, MNRAS, 415, 545
- Tortora et al. (2013) Tortora, C., Romanowsky, A. J., & Napolitano, N. R. 2013, ApJ, 765, 8
- Tremaine et al. (2002) Tremaine, S., et al. 2002, ApJ, 574, 740
- Tremblay & Merritt (1996) Tremblay, B., & Merritt, D. 1996, AJ, 111, 2243
- Treu et al. (2010) Treu, T., Auger, M. W., Koopmans, L. V. E., et al. 2010, ApJ, 709, 1195
- Trujillo et al. (2006) Trujillo, I., et al. 2006, MNRAS, 373, L36
- van de Sande et al. (2011) van de Sande, J., Kriek, M., Franx, M., et al. 2011, ApJ, 736, L9
- van den Bosch et al. (2012) van den Bosch, R. C. E., Gebhardt, K., Gültekin, K., et al. 2012, Nature, 491, 729
- van der Marel & van den Bosch (1998) van der Marel, R. P., & van den Bosch, F. C. 1998, AJ, 116, 2220
- van der Wel et al. (2008) van der Wel, A., Holden, B. P., Zirm, A. W., et al. 2008, ApJ, 688, 48
- van Dokkum et al. (2008) van Dokkum, P. G., et al. 2008, ApJ, 677, L5
- van Dokkum et al. (2010) —. 2010, ApJ, 709, 1018
- van Haasteren et al. (2011) van Haasteren, R., Levin, Y., Janssen, G. H., et al. 2011, MNRAS, 414, 3117
- Walcher et al. (2014) Walcher, C. J., Wisotzki, L., Bekeraité, S., et al. 2014, A&A, 569, A1
- Walsh et al. (2013) Walsh, J. L., Barth, A. J., Ho, L. C., & Sarzi, M. 2013, ApJ, 770, 86
- Wegner et al. (2012) Wegner, G. A., Corsini, E. M., Thomas, J., et al. 2012, AJ, 144, 78
- Weijmans et al. (2009) Weijmans, A.-M., et al. 2009, MNRAS, 398, 561
- Worthey et al. (1994) Worthey, G., Faber, S. M., Gonzalez, J. J., & Burstein, D. 1994, ApJS, 94, 687
- Wu et al. (2014) Wu, X., Gerhard, O., Naab, T., et al. 2014, MNRAS, 438, 2701
- York et al. (2000) York, D. G., Adelman, J., Anderson, Jr., J. E., et al. 2000, AJ, 120, 1579